NASA Delivers Navigation System for Commercial Lunar Relay

4 Min Read

NASA Delivers Navigation System for Commercial Lunar Relay
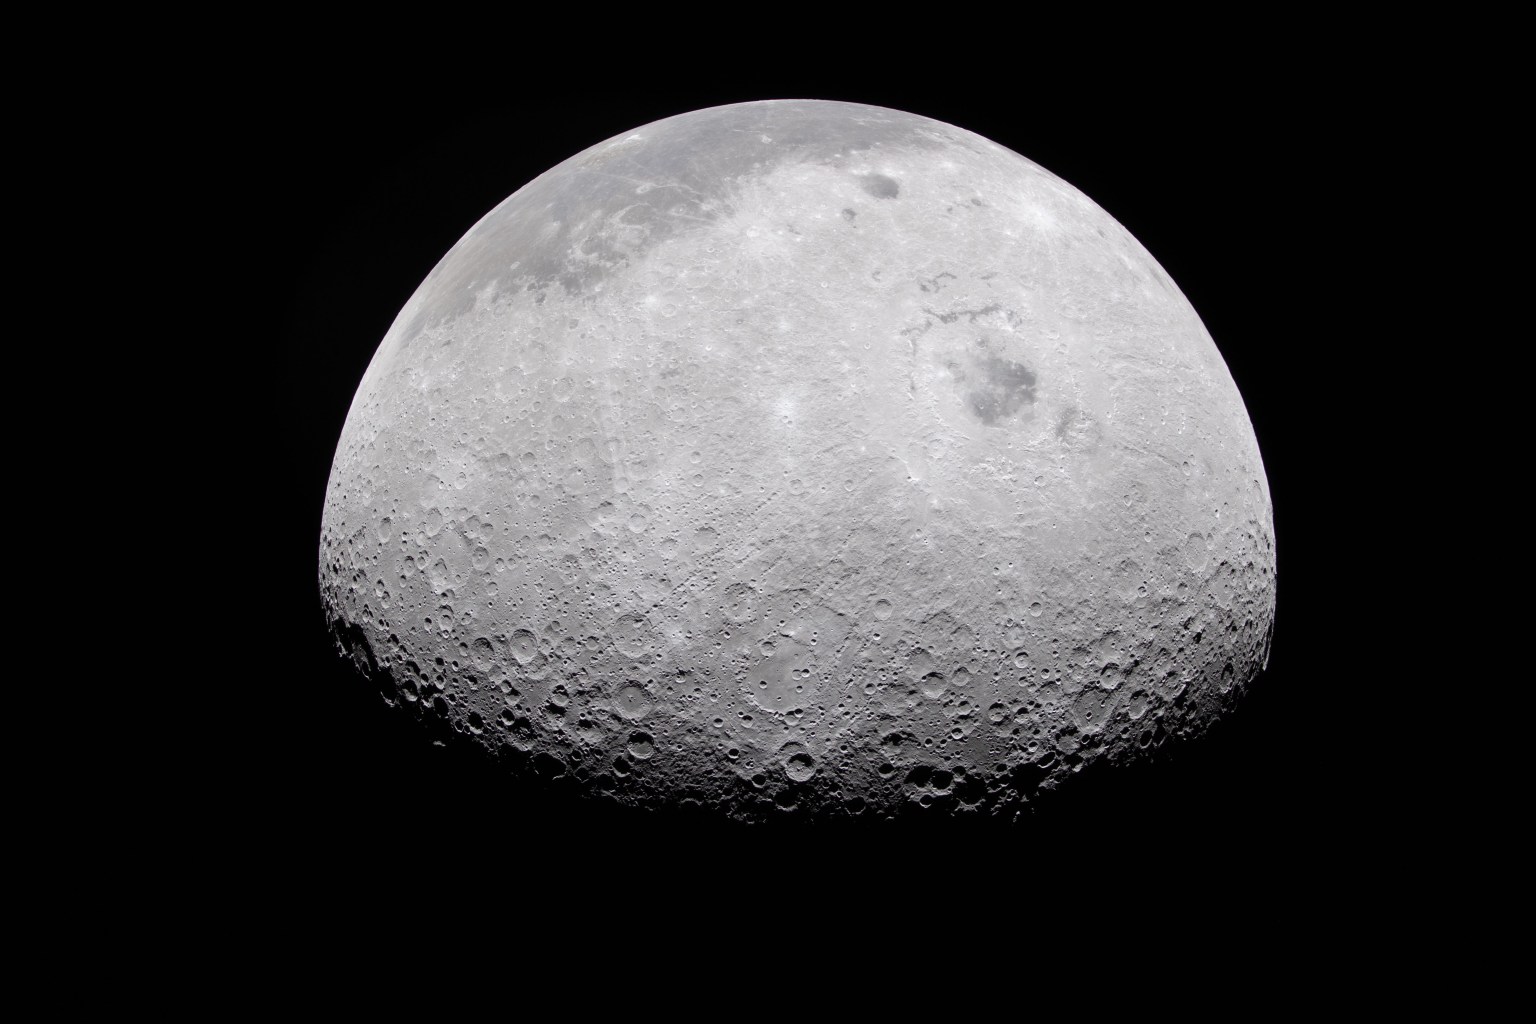
The Moon's rugged surface is on display in this image. Most of the Moon is visible, with the bottom of the sphere disappearing into the darkness. This line between light and dark is called the terminator. The terminator is lined with many craters.

The Moon’s rocky, uneven, and otherworldly surface features are highlighted by the terminator – the difference between light and darkness.

Credits:
NASA

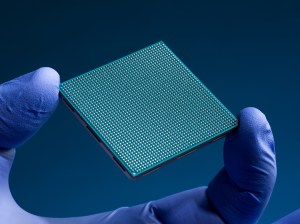
NASA delivered the NavCube3-mini payload on July 13 to Intuitive Machines for integration into Altus-1, the company’s first lunar relay satellite, marking an important milestone in the development of future lunar communications and navigation services. The lunar relays are designed to enable communications and navigation for astronauts and rovers operating at the agency’s future Moon Base.

About half the size of a shoebox and weighing just 3.5 pounds, NavCube3-mini is a compact but powerful navigation receiver designed to use signals from Earth-based GPS and Galileo Global Navigation Satellite Systems (GNSS) at lunar distances. Operating on less than 20 watts of power, roughly the same as a laptop computer, it can determine a spacecraft’s precise position far beyond Earth orbit. The compact payload builds on a series of navigation technology advancements developed at NASA’s Goddard Space Flight Center in Greenbelt, Maryland, each extending GPS navigation to new record-breaking distances from Earth.
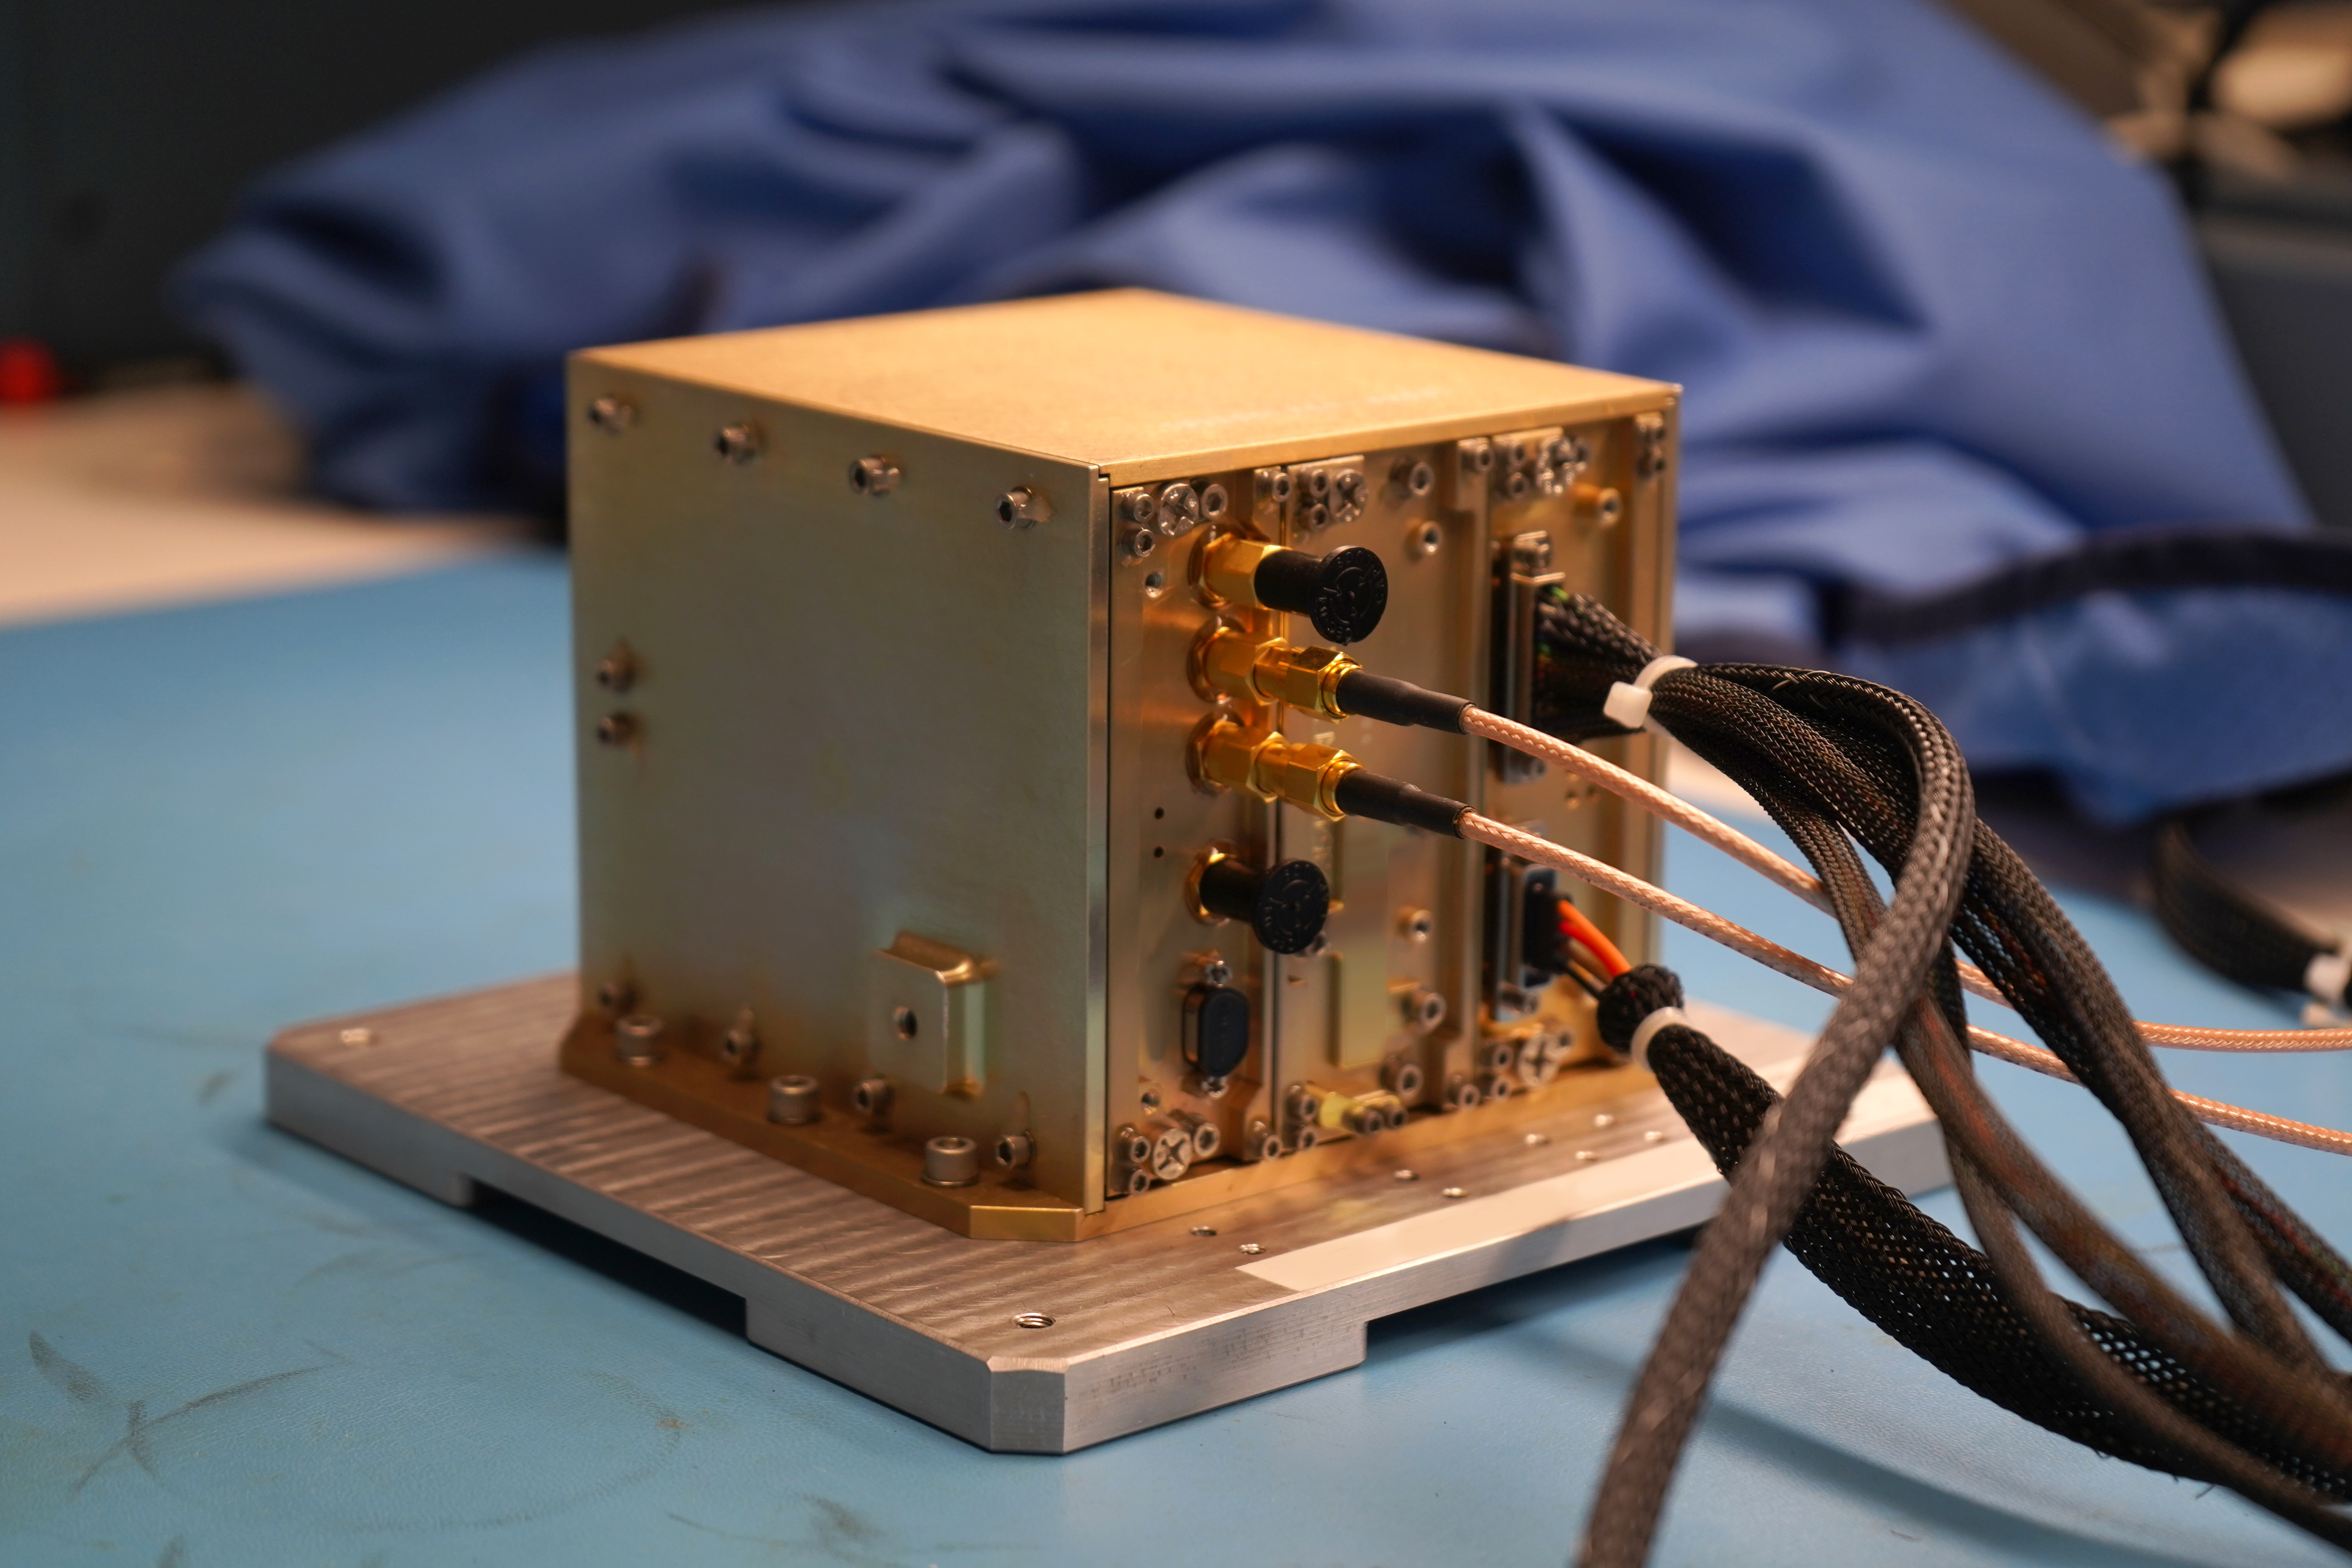
The NavCube3-mini payload in a laboratory at NASA's Goddard Space Flight Center in Greenbelt, Md.
NavCube3-mini in the Space Navigation Laboratory at NASA’s Goddard Space Flight Center in Greenbelt, Md., prior to delivery to Intuitive Machines for integration into the Altus-1 lunar relay satellite.
NASA/Dave Ryan

The payload will fly aboard Intuitive Machines’ Altus-1 lunar relay satellite, the first of a planned network of lunar relay satellites being developed under the company’s Near Space Network Services contract with NASA. The relays will provide communications and navigation support for missions operating at the Moon, including the challenging lunar South Pole region, where Artemis astronauts will land in 2028, and where direct communications with Earth can be difficult. By extending communications coverage and improving navigation services, the relay network will help realize NASA’s vision for a sustained human presence on the lunar surface.

Before being shipped to Intuitive Machines, NavCube3-mini underwent an extensive environmental and performance test campaign at NASA Goddard to verify it is ready for spaceflight. The environmental testing included vibration testing to simulate launch conditions, thermal vacuum testing in the extreme temperatures and vacuum of space, and electromagnetic compatibility testing to ensure the payload can operate reliably alongside other spacecraft systems without causing or experiencing electromagnetic interference. Performance testing was conducted before and after each environmental test using high-fidelity simulations of the GPS and Galileo signals the NavCube will encounter in lunar orbit, verifying functionality and performance throughout the testing campaign. 
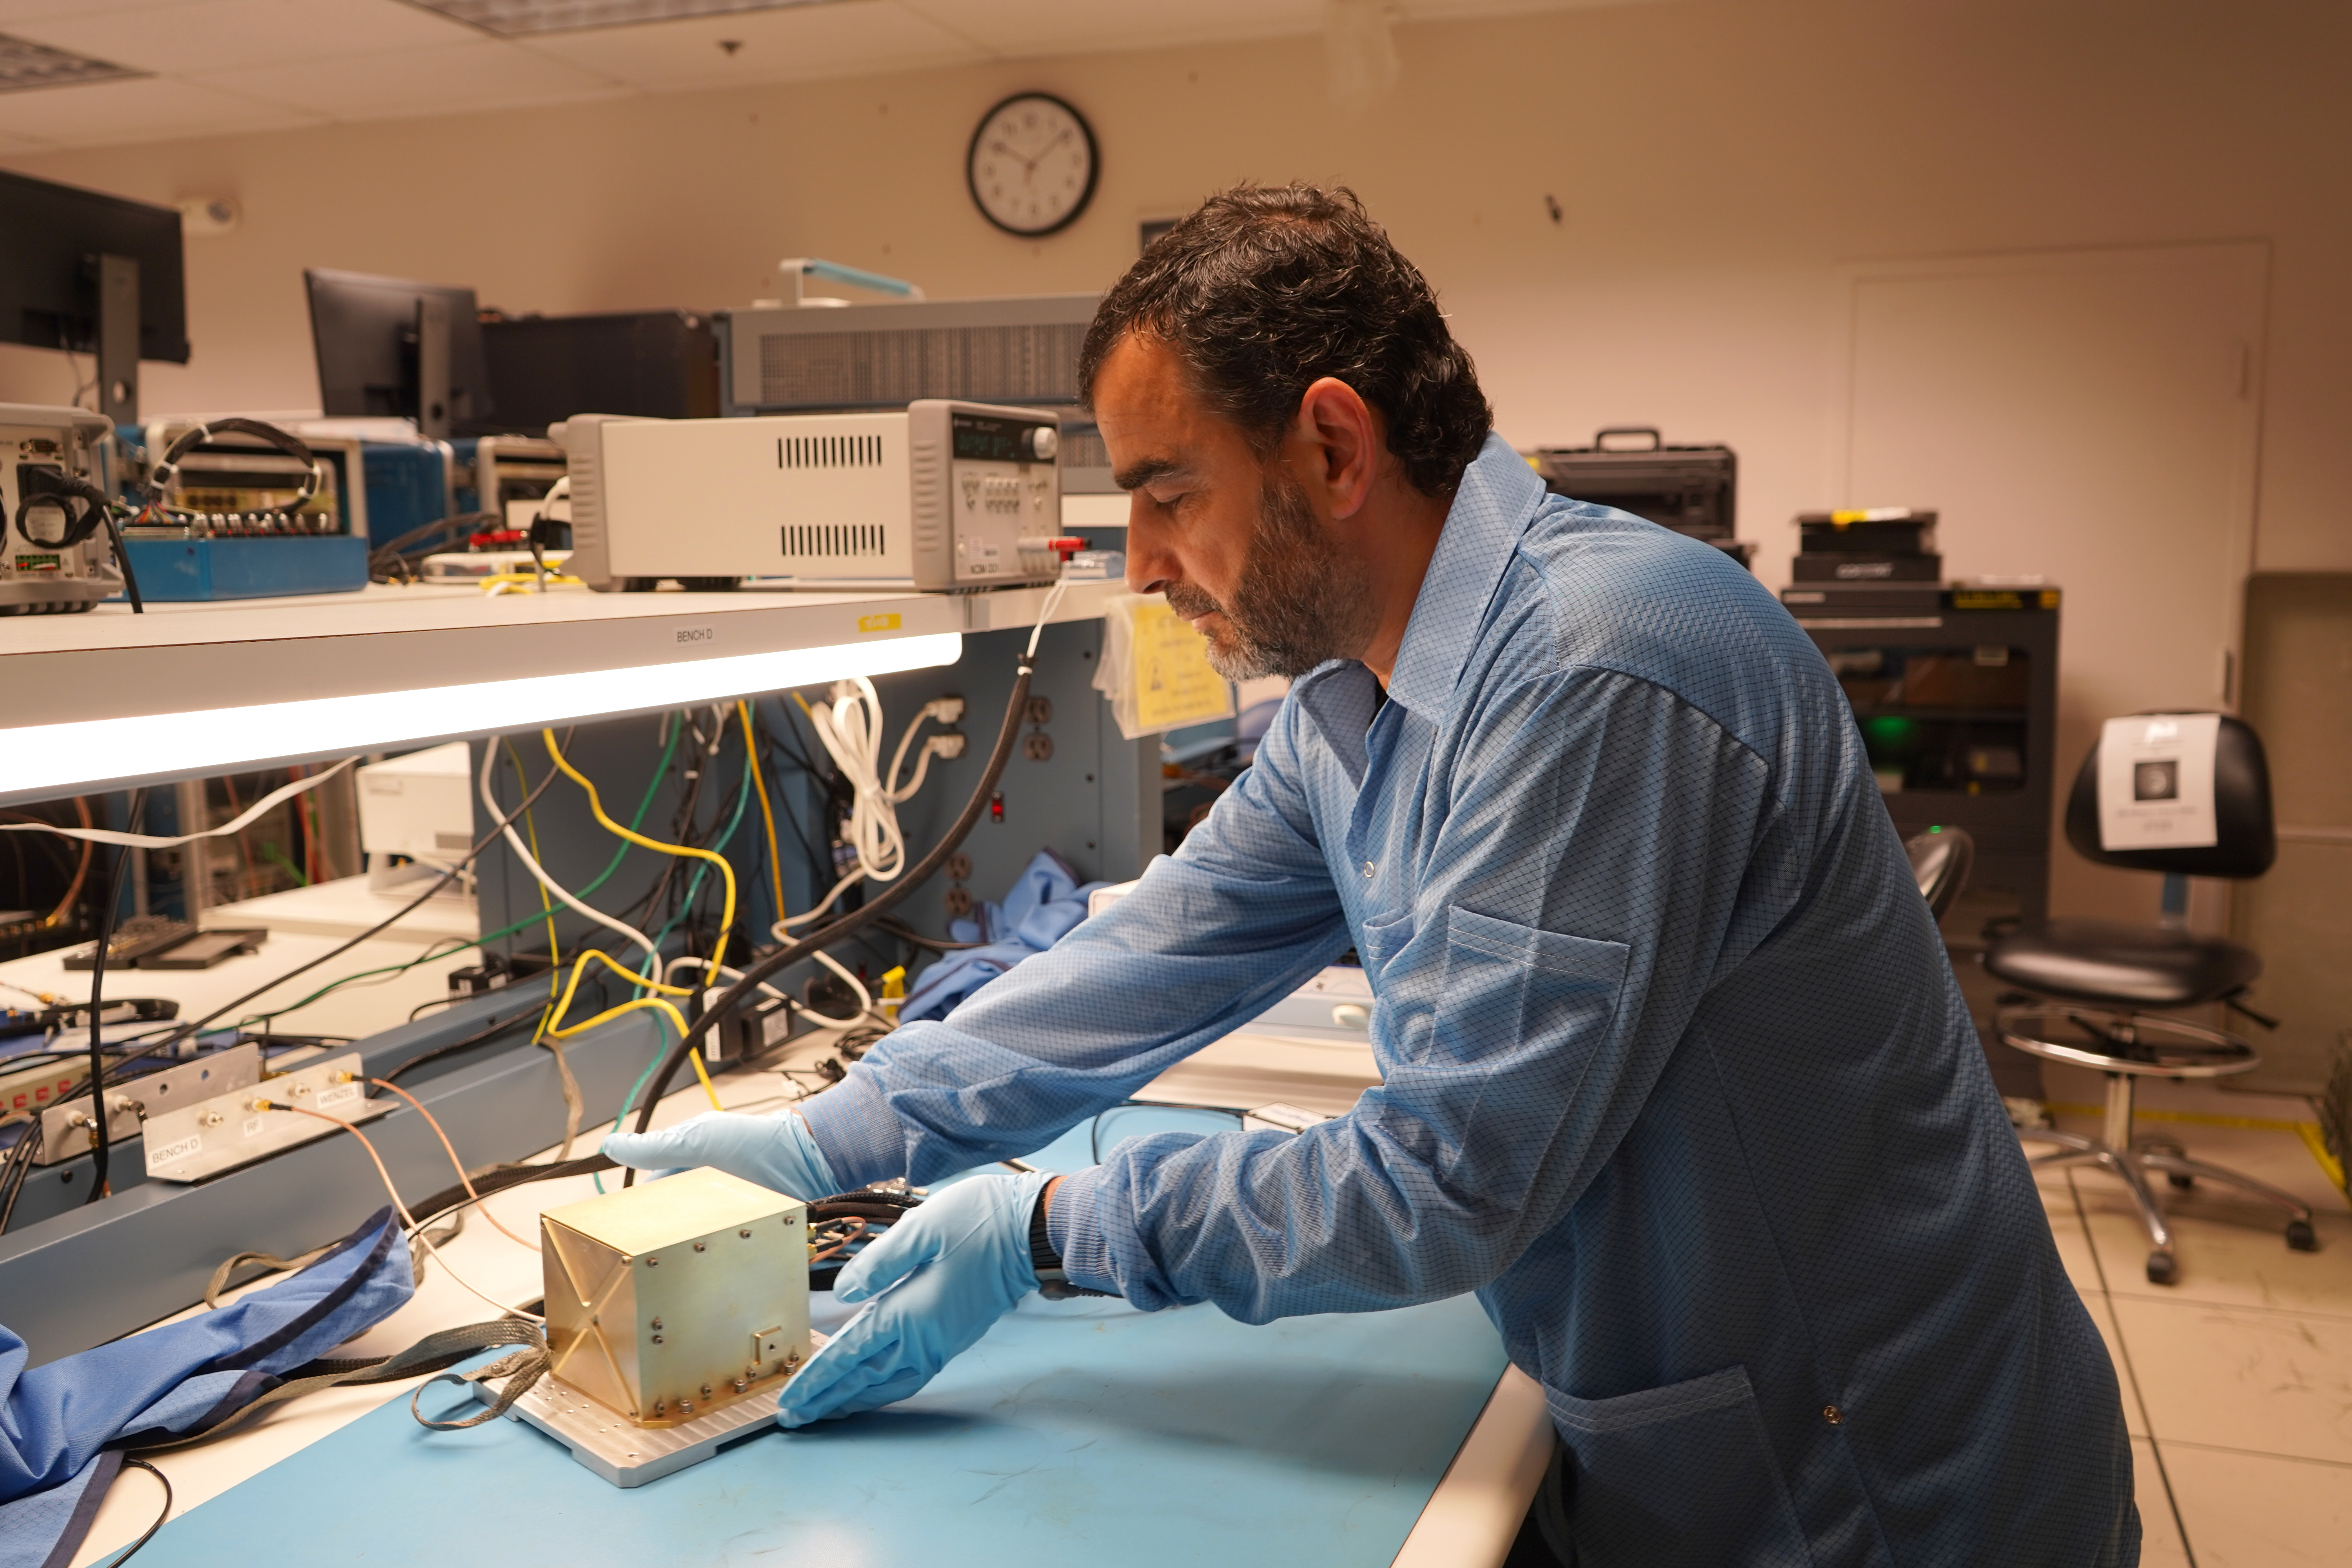
The NavCube3-mini payload and project manager in a laboratory at NASA's Goddard Space Flight Center in Greenbelt, Md.
Munther Hassouneh, the NavCube3-mini project manager, in the Space Navigation Laboratory at NASA’s Goddard Space Flight Center in Greenbelt, Md.
NASA/Dave Ryan

NavCube3-mini will serve as a key technology demonstration aboard Altus-1, validating the use of GNSS-based navigation in the lunar region and providing valuable performance data to support the development of future lunar navigation infrastructure. This technology is part of NASA’s broader strategy to develop communications and navigation services that work across both commercial providers and NASA’s networks. These capabilities are designed to support a growing lunar ecosystem that includes orbiters, landers, rovers, and, eventually, astronauts living and working on the Moon.

The delivery of NavCube3-mini marks another step toward building the communications and navigation infrastructure needed for long-term lunar exploration. Through partnerships with commercial providers like Intuitive Machines, NASA is building a more connected and capable lunar environment. As activity around the Moon continues to grow, these capabilities will enable lunar spacecraft and explorers to operate more safely, efficiently, and autonomously.

About the Author

Katherine Schauer

Katherine Schauer

Katherine Schauer is a writer for the Space Communications and Navigation (SCaN) Program office and covers emerging technologies, commercialization efforts, exploration activities, and more.

Source: www.nasa.gov
NASA Completes Astronaut-Deployed Science Instrument for Lunar Surface

Rectangular box-shaped device resting on a metal table. The front face is covered with a grid of many small black rectangular panels bordered in white. Metal components, brackets, and small box units are mounted along the top. The background shows a large windowed wall with a blurred American flag and an Artemis flag visible behind the device.
The fully-integrated LEMS (Lunar Environment Monitoring Station) ready for environmental testing. A small suitcase-size instrument suite built at NASA Goddard, LEMS is designed to carry out continuous, long-term monitoring of the seismic environment at the Moon, including surface motion caused by moonquakes and meteorite impacts in the lunar south polar region.
NASA Goddard/Mike Guinto

NASA has declared “wrenches down” on the first completed payload designed for Artemis astronauts to deploy on the Moon’s surface. Engineers working on NASA’s Lunar Environment Monitoring Station, or LEMS, have completed hardware development and testing and the payload is ready for its permanent home near the lunar South Pole. With the hardware complete, LEMS is ready to support one of the Artemis program’s core goals: enabling sustained lunar science and exploration.

The LEMS instrument package contains two highly sensitive seismometers that will monitor ground vibrations from moonquakes and meteorite impacts, providing scientists with insights into the Moon’s interior and the seismic hazards astronauts might encounter at the surface. Its modular design allows the system to be adapted or expanded to host new instruments in the future, creating a reusable platform that can evolve as scientific priorities grow.

The payload will remain in a clean room at NASA’s Goddard Space Flight Center in Greenbelt, Maryland, where it was built, until it is assigned to an Artemis mission for deployment to the lunar surface.

“The completion of the LEMS scientific instrument is a major step in a new era of lunar surface science. Innovative science experiments will uncover, measure, and reveal the Moon’s secrets while astronauts open new frontiers for discovery,” said Joel Kearns, deputy associate administrator for exploration, Science Mission Directorate, NASA Headquarters in Washington. “And, behind the scenes, countless teams across NASA and our partners are pushing the boundaries of what surface instruments can do, building the tools that will make future exploration possible and safer.”

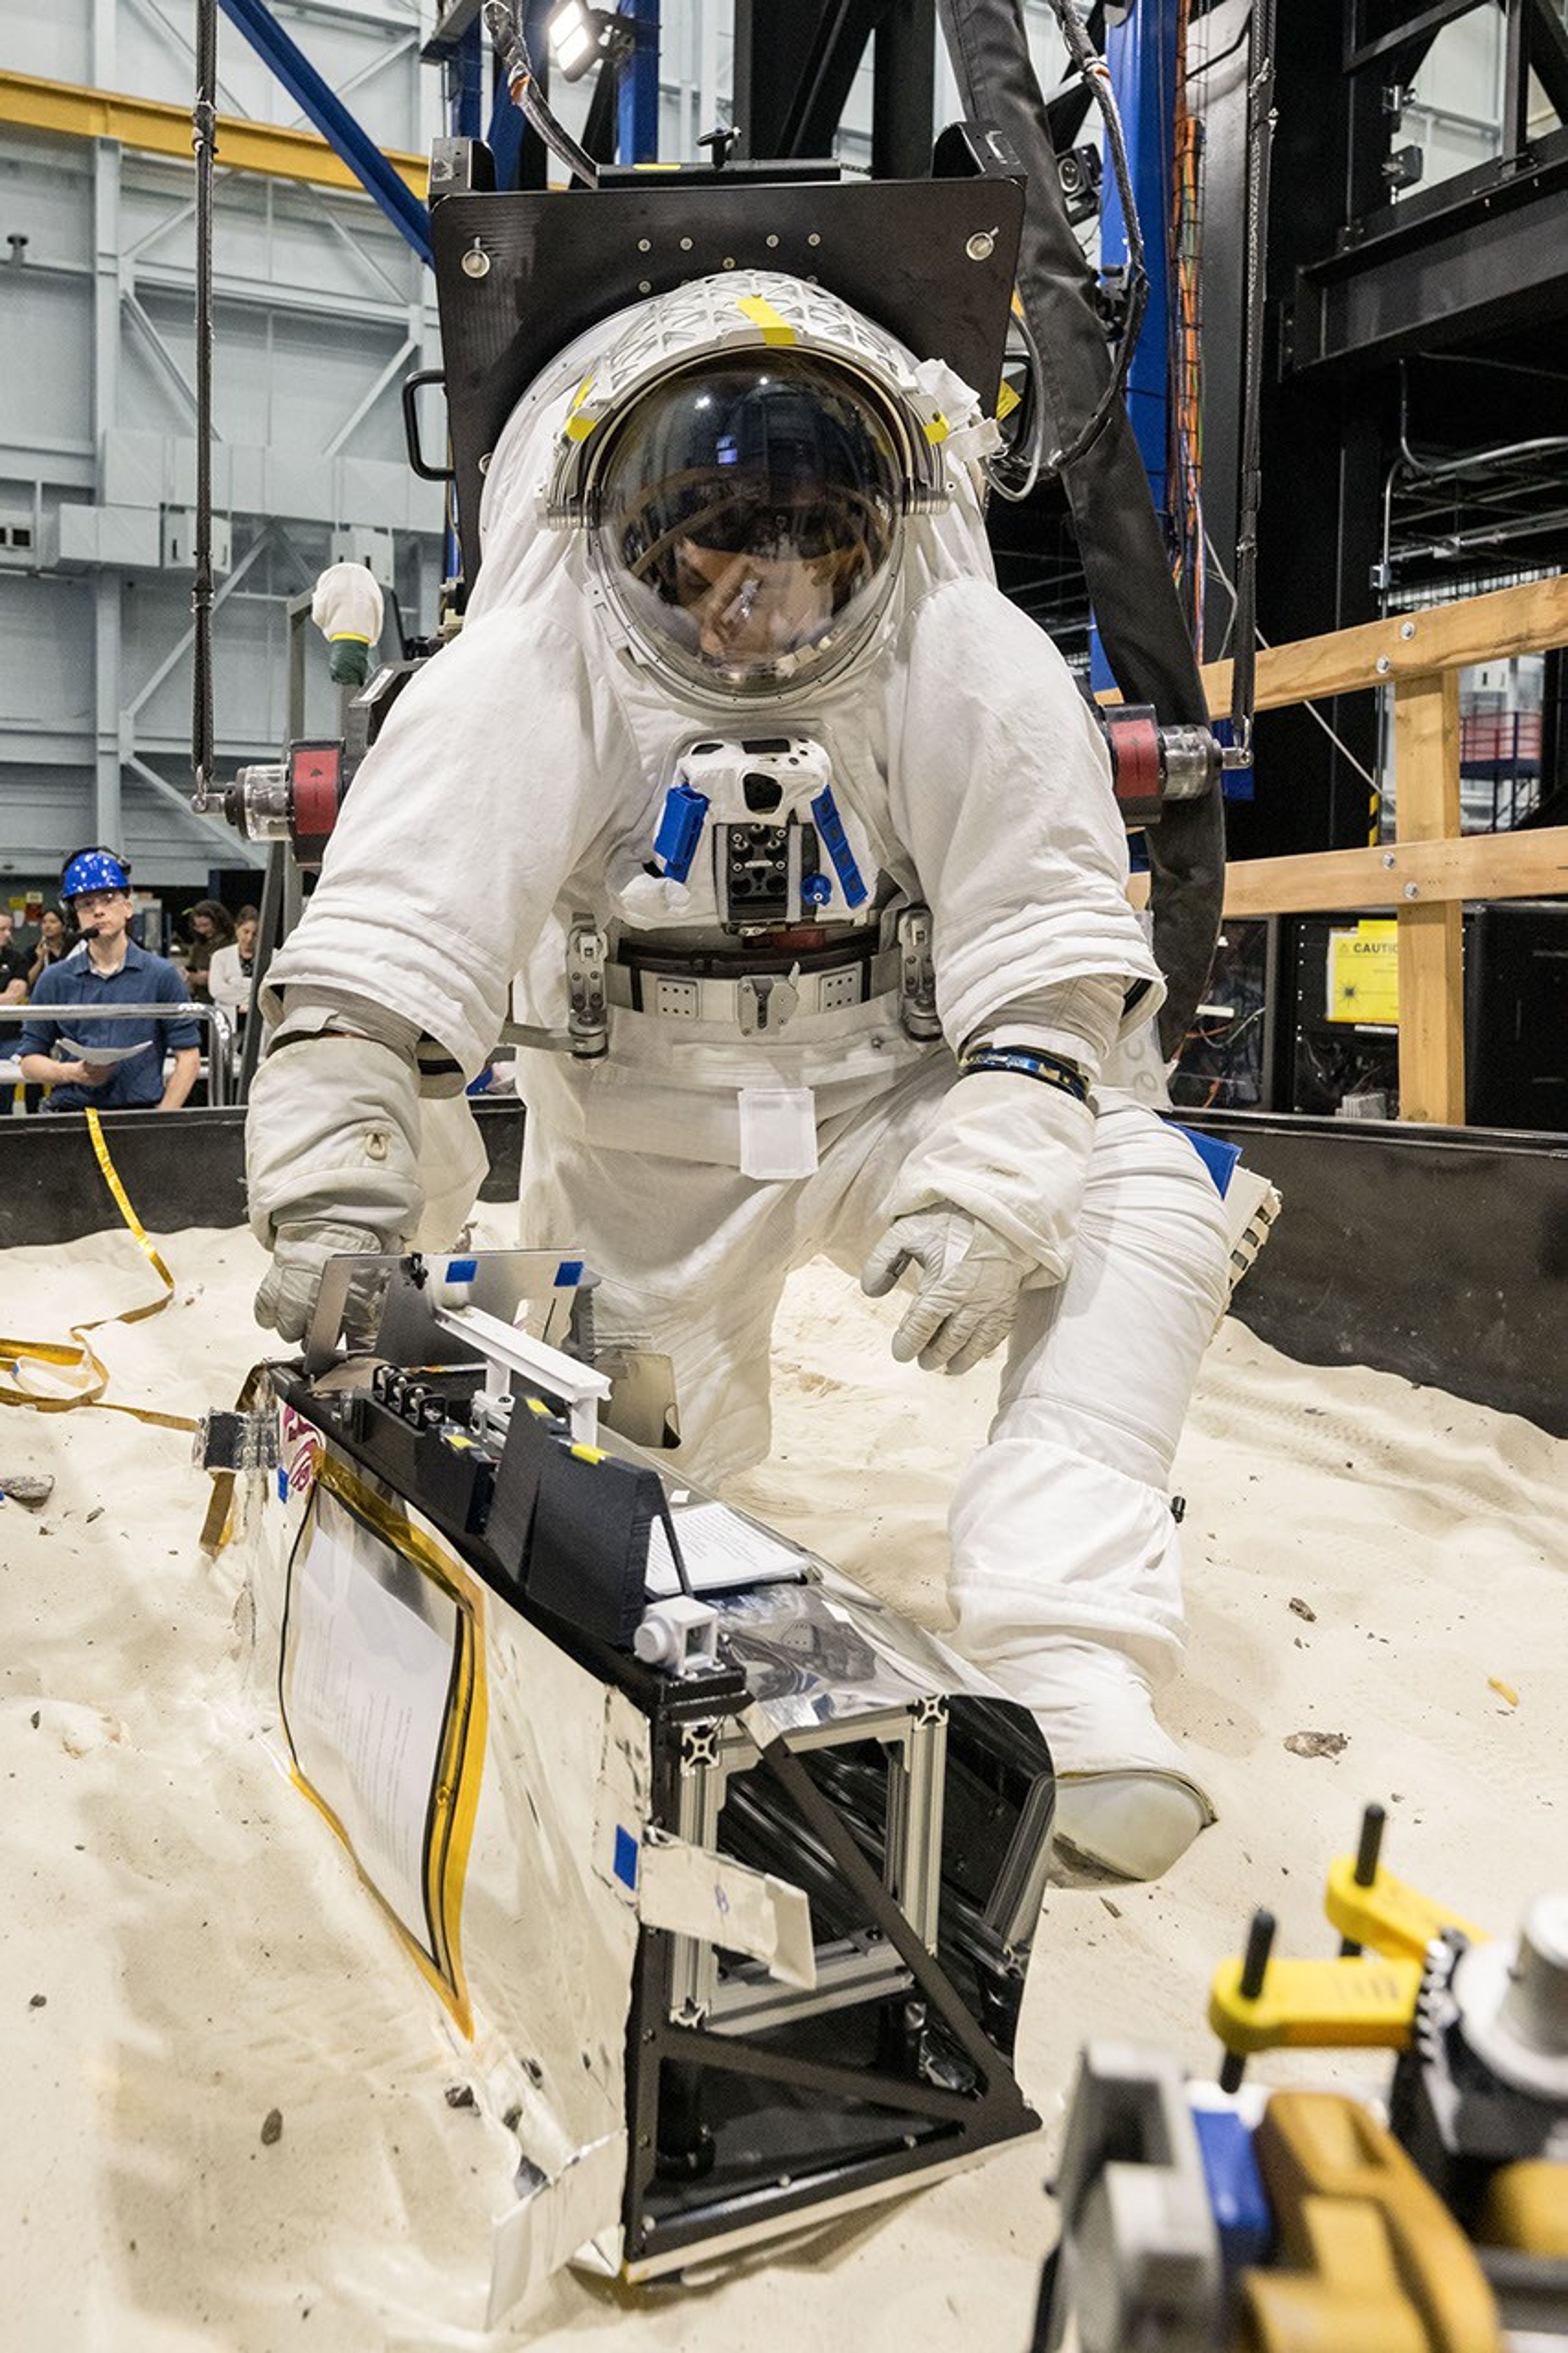
An astronaut in a white spacesuit kneels in simulated lunar soil while working with scientific equipment in a large testing facility. Staff members and support structures are visible in the background.
A scientist wearing NASA’s xEMU prototype space suit is testing the handling of a mockup version of NASA’s Lunar Environment Monitoring Station, or LEMS. The testing took place at the Active Response Gravity Offload System, a simulated reduced gravity environment at NASA’s Johnson Space Center in Houston.
NASA Johnson

The LEMS payload builds on a legacy of lunar seismic tracking. Apollo astronauts deployed a network of seismometers on the Moon’s nearside equatorial region between 1969 and 1972. Those instruments operated until 1977, recording about 13,000 moonquakes and other ground vibrations that helped scientists begin to understand the composition of the Moon’s interior. For decades, researchers have hoped to spread more seismometers, updated with new technologies, across the lunar surface.

Now, LEMS will carry the first seismometers to be deployed by future astronauts to listen for faint ground vibrations, collecting new clues to the Moon’s internal structure and ongoing seismic activity. The sensors will be the most compact, sensitive, and energy-efficient seismometers ever built for planetary exploration.

LEMS itself is about the size of a small suitcase, weighing 11 pounds in the Moon’s low-gravity environment. It will carry not just these seismic sensors, but everything it needs to function independently of humans after deployment. LEMS is built to manage its own power production via a lightweight, flexible solar array that conforms to the shape of the LEMS unit. It also will manage its operational activities to ensure continuous data collection based on a preset plan, and monthly data transmission to Earth. The payload will do all this while maintaining a stable internal temperature throughout the massive day-to-night temperature swings of the South Pole region.

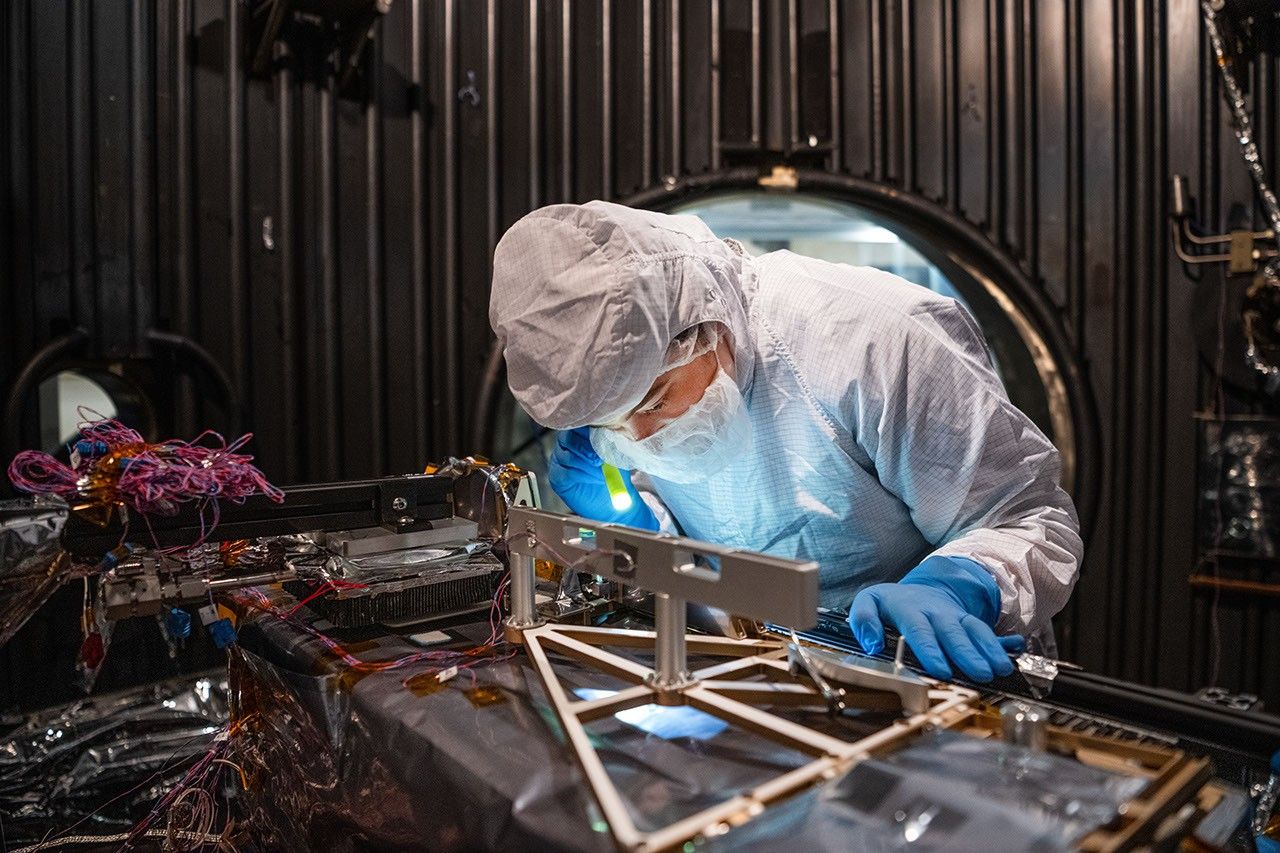
A technician in a white clean-room suit and blue gloves uses a small flashlight to inspect a spacecraft instrument inside a dark testing chamber. Colorful wires and metallic components surround the instrument.
Mechanical Engineer Brie Ludwig inspects the Lunar Environment Monitoring Station (LEMS) in preparation for testing in a thermal vacuum chamber at Goddard Space Flight Center in Greenbelt, Maryland, on March 31, 2026. LEMS is a compact, autonomous, and self-sustaining seismometer suite designed to carry out continuous, long-term monitoring of the lunar seismic environment at the South Polar region.
NASA/Denny Henry

“When we conceived of LEMS, we weren’t just thinking about the next mission, we were thinking about the next generation of lunar exploration,” said Mehdi Benna, a University of Maryland Baltimore County scientist who leads LEMS from NASA Goddard. “Our vision was to create a scientific buoy for the Moon. Like an ocean buoy on Earth, LEMS is designed to be easy to build, adaptable to different scientific objectives, and capable of operating independently for years.”

Before any surface science could happen, Benna and his team had to ensure that LEMS could survive the trip to the Moon and the harsh environment of its surface. Over the past five months, LEMS and its components have been subjected to a demanding series of environmental and operational tests. Engineers verified LEMS can endure the violent shaking of launch, the journey to the lunar surface, and the Moon’s temperature and radiation environment. The team also showed that the instrument package’s mechanical and electrical design is safe for astronaut handling.

The LEMS payload was built to operate through the lunar night, which lasts two Earth weeks, without external power assistance or a heat source. Past lunar surface instruments relied on radioisotope heaters for warmth and power. But LEMS instead will withstand temperatures that dip to minus 400 degrees Fahrenheit in some areas by using advanced insulation materials, low-thermal-conductivity cables that minimize heat loss, and a thermal regulator that conducts heat away during the day to prevent overheating and helps retain heat at night.

These innovations reduce mass and power needs, setting the stage for lighter, energy-efficient instruments that can operate continuously at future Artemis landing sites and the NASA-led Moon Base.

The LEMS payload is led by University of Maryland Baltimore County and University of Maryland College Park. Technical implementation is led by NASA Goddard. The University of Arizona, in partnership with Silicon Audio, Inc., supplied LEMS’ two state-of-the-art seismometers. Morehead State University in Kentucky provided LEMS’ telecommunication system and will operate the instrument on the surface. Washington University in St. Louis will manage the instrument’s data processing and dissemination to the larger scientific community.

Source: science.nasa.gov

NASA Data Helps Commercial Space Plan Living Off Our Moon 

3 min read

Preparations for Next Moonwalk Simulations Underway (and Underwater)

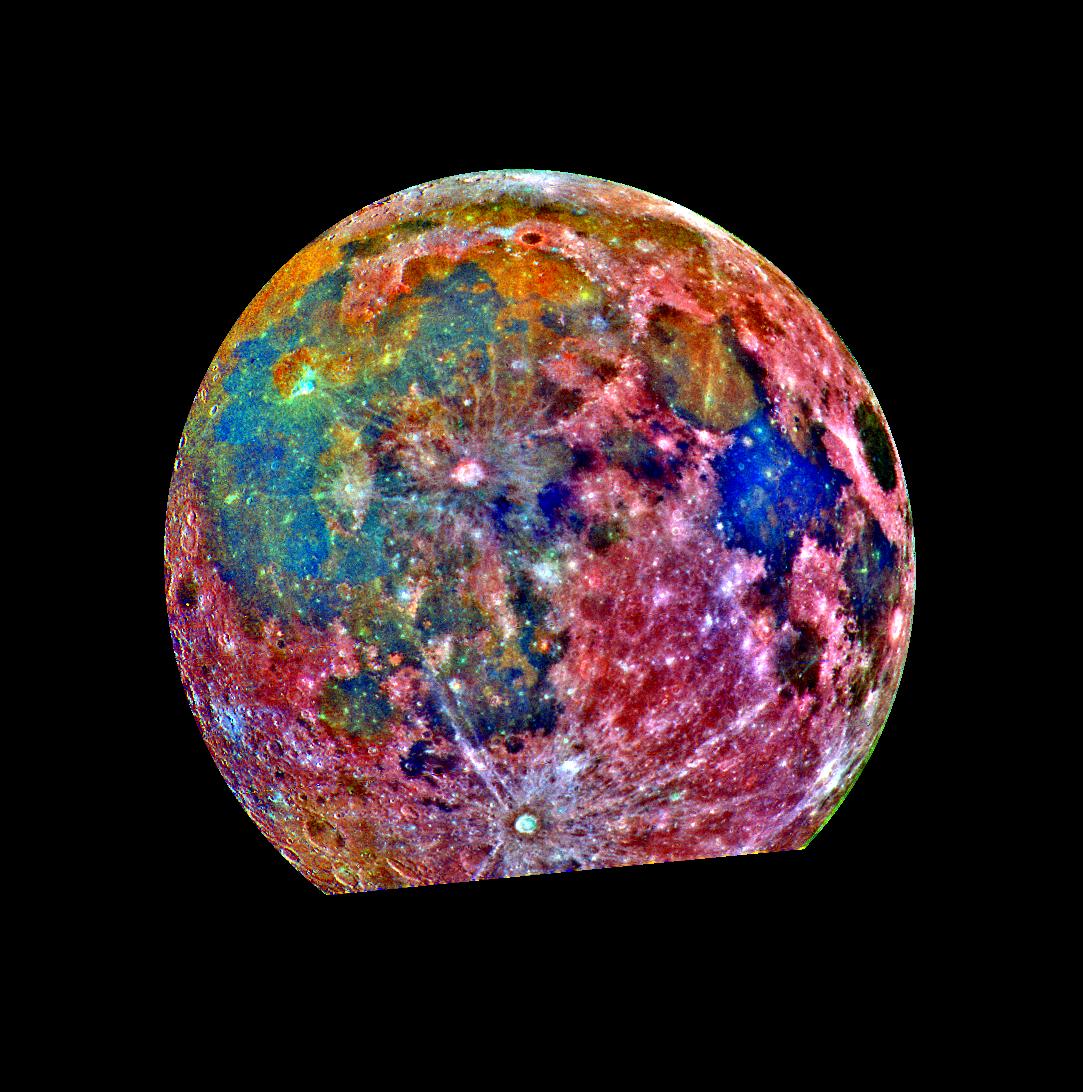
A multicolored picture of Earth's Moon.
NASA has been taking pictures of the Moon for decades, collecting a wealth of data. This false-color picture is a composite of 15 images of the Moon taken through three color filters on NASA’s Galileo solid-state imaging system.
Credit: NASA

The barren lunar landscape has some important resources, such as water and minerals like iron and titanium, but extracting and processing them will require special equipment. Where those resources can be found will dictate where to land and how to mine them. To help with that, Lunar Station Corp. is using a wealth of NASA data in multiple computer models.

“With 60 years of lunar data available to us, we help our clients understand the environmental factors for any given location on the Moon,” said Blair DeWitt, CEO of Lunar Station. Combining disparate data from different sensors used by NASA and other space agencies is a critical first step. One NASA resource the Cambridge, Massachusetts-based company used to build terrain maps is the Ames Stereo Pipeline. The open-source code automatically processes images captured from satellites, robotic rovers, historical images, and more to create a 3D model revealing features such as rock placement and elevation.

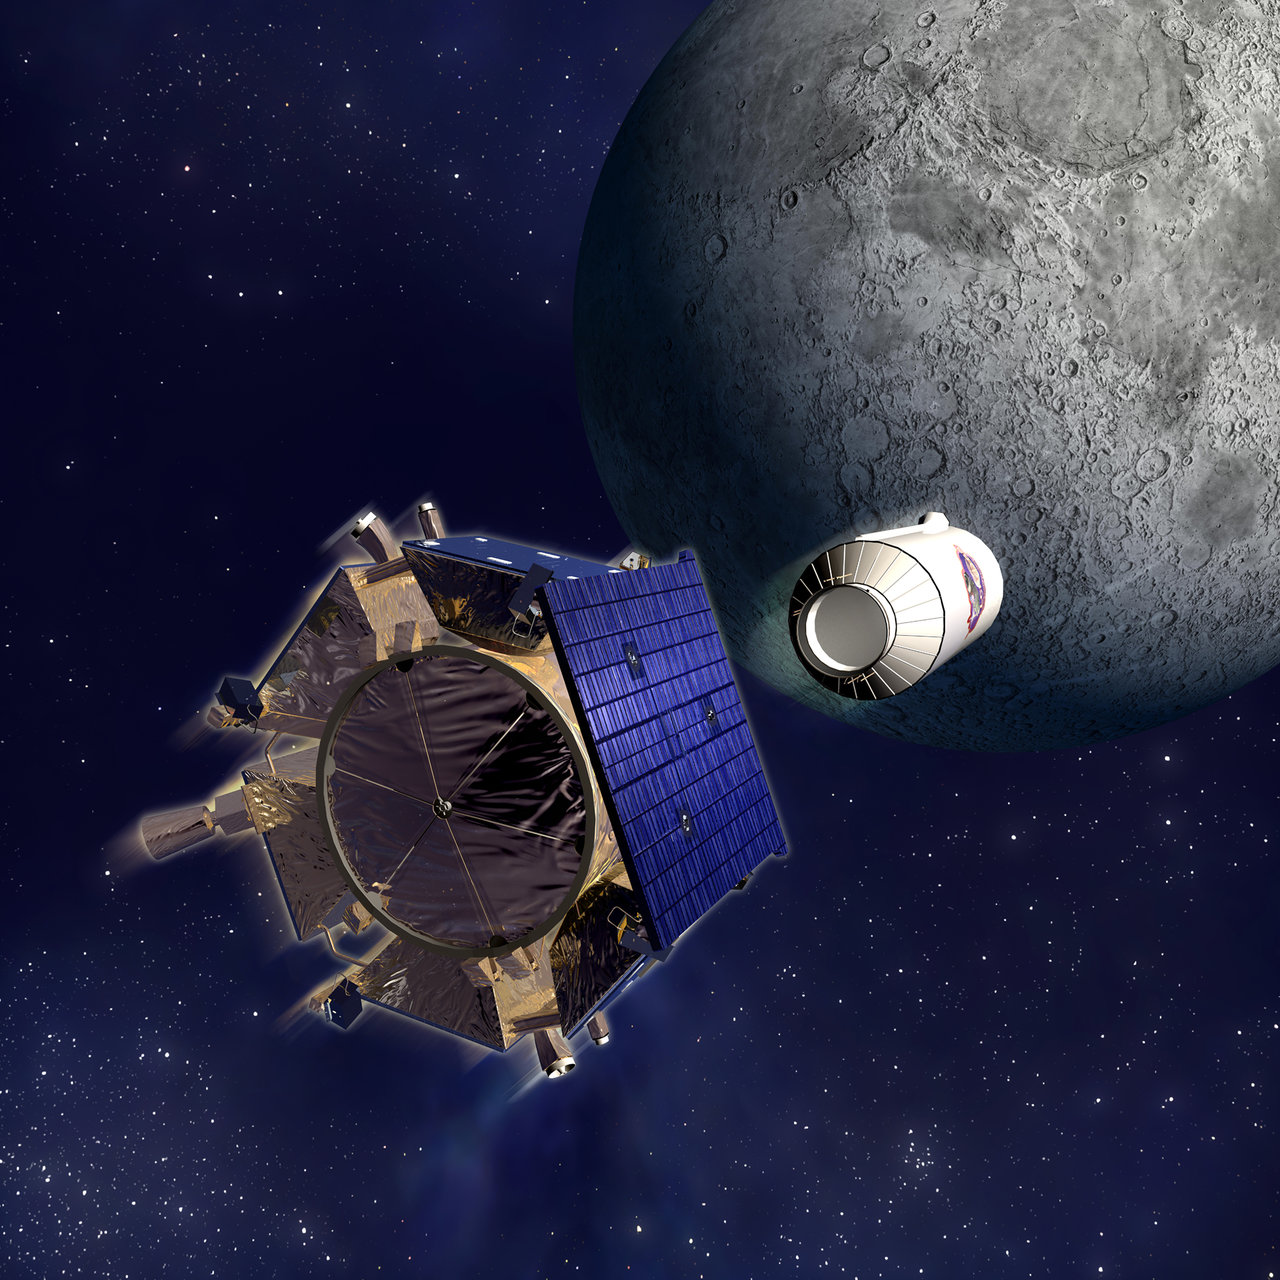
But the availability of in-situ lunar water resources at any location is largely unknown, according to Gerry Sanders, in-situ resource utilization system capability lead at NASA’s Johnson Space Center in Houston. To begin to fill that gap, the Lunar Crater Observation and Sensing Satellite was designed to crash its uppers stage into the Moon’s South Pole in 2009. The examination of the resulting plume revealed the presence of water ice.

Lunar Station is building on that work and more to help commercial space companies with mission planning, which includes scientific research for mining operations. The MoonHacker program uses proprietary geospatial analytics platform and advanced algorithms to fuse all the lunar data in NASA’s Planetary Data System to help identify indicators for shallow pits of lunar water.

“We can find sites for landing pads, for cultivating the best paths for roving, and inform our clients about communications. If you can’t see Earth at a given location like in the polar regions or the far side of the Moon, you have to come up with a relay strategy,” said DeWitt. “We can do this in part thanks to NASA data.”

In MoonHacker’s Radiation Simulator, an electronic version of a company’s rover or satellite, called a digital twin, can be subjected to the radiation en route or at the mission site to determine the protection required.

These innovations exemplify the purpose of NASA’s Technology Transfer program within the Research and Technology Mission Directorate, which uses space-based solutions to improve life on Earth. For 50 years, NASA has documented the everyday benefits of space technology through the agency’s Spinoff publication. 

Details

Last Updated

Aug 12, 2026

Source: www.nasa.gov
Chasing Fire Clouds in Utah


Natural Color
Brightness Temperature

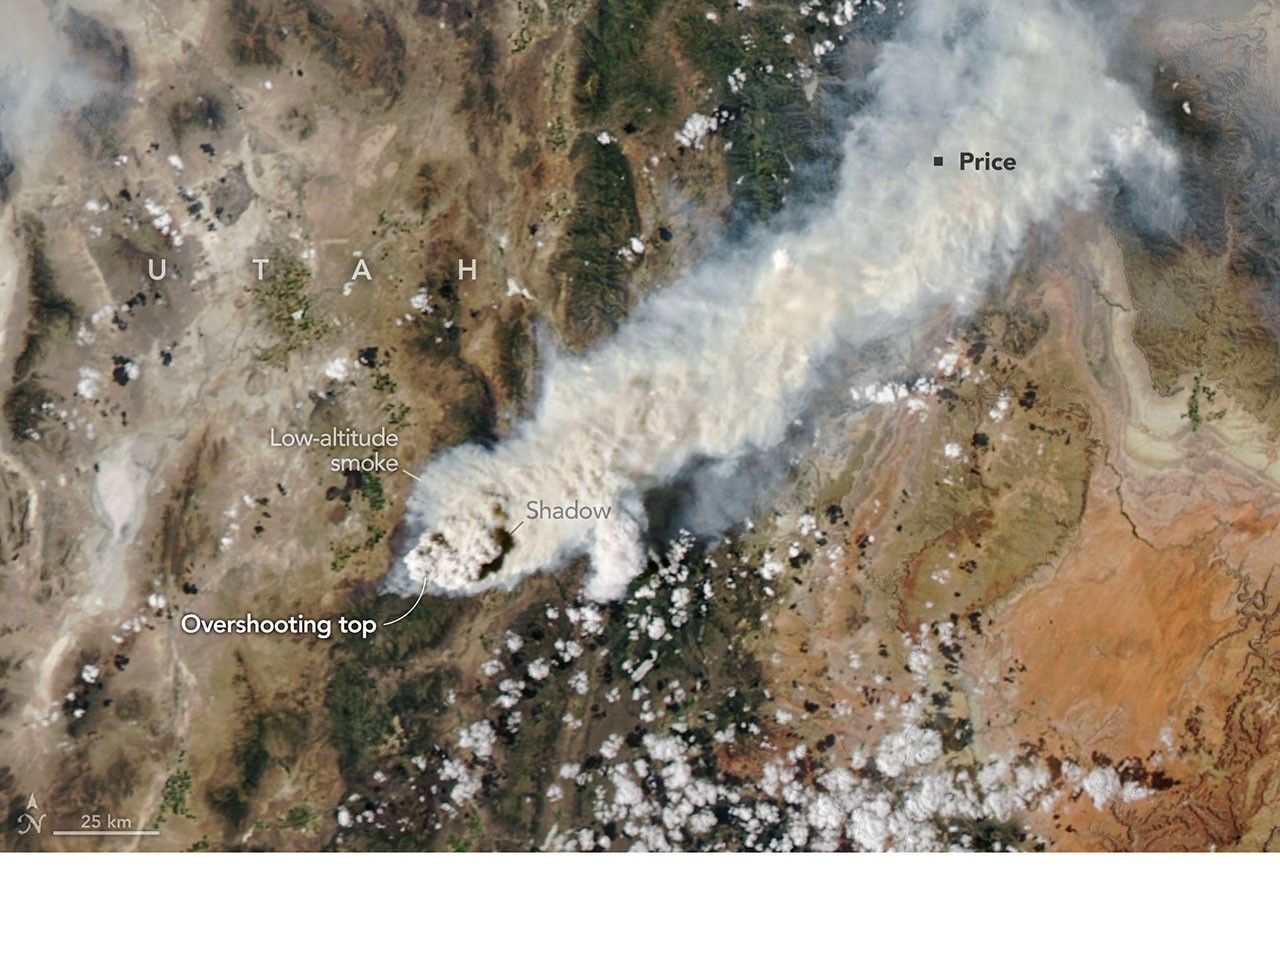
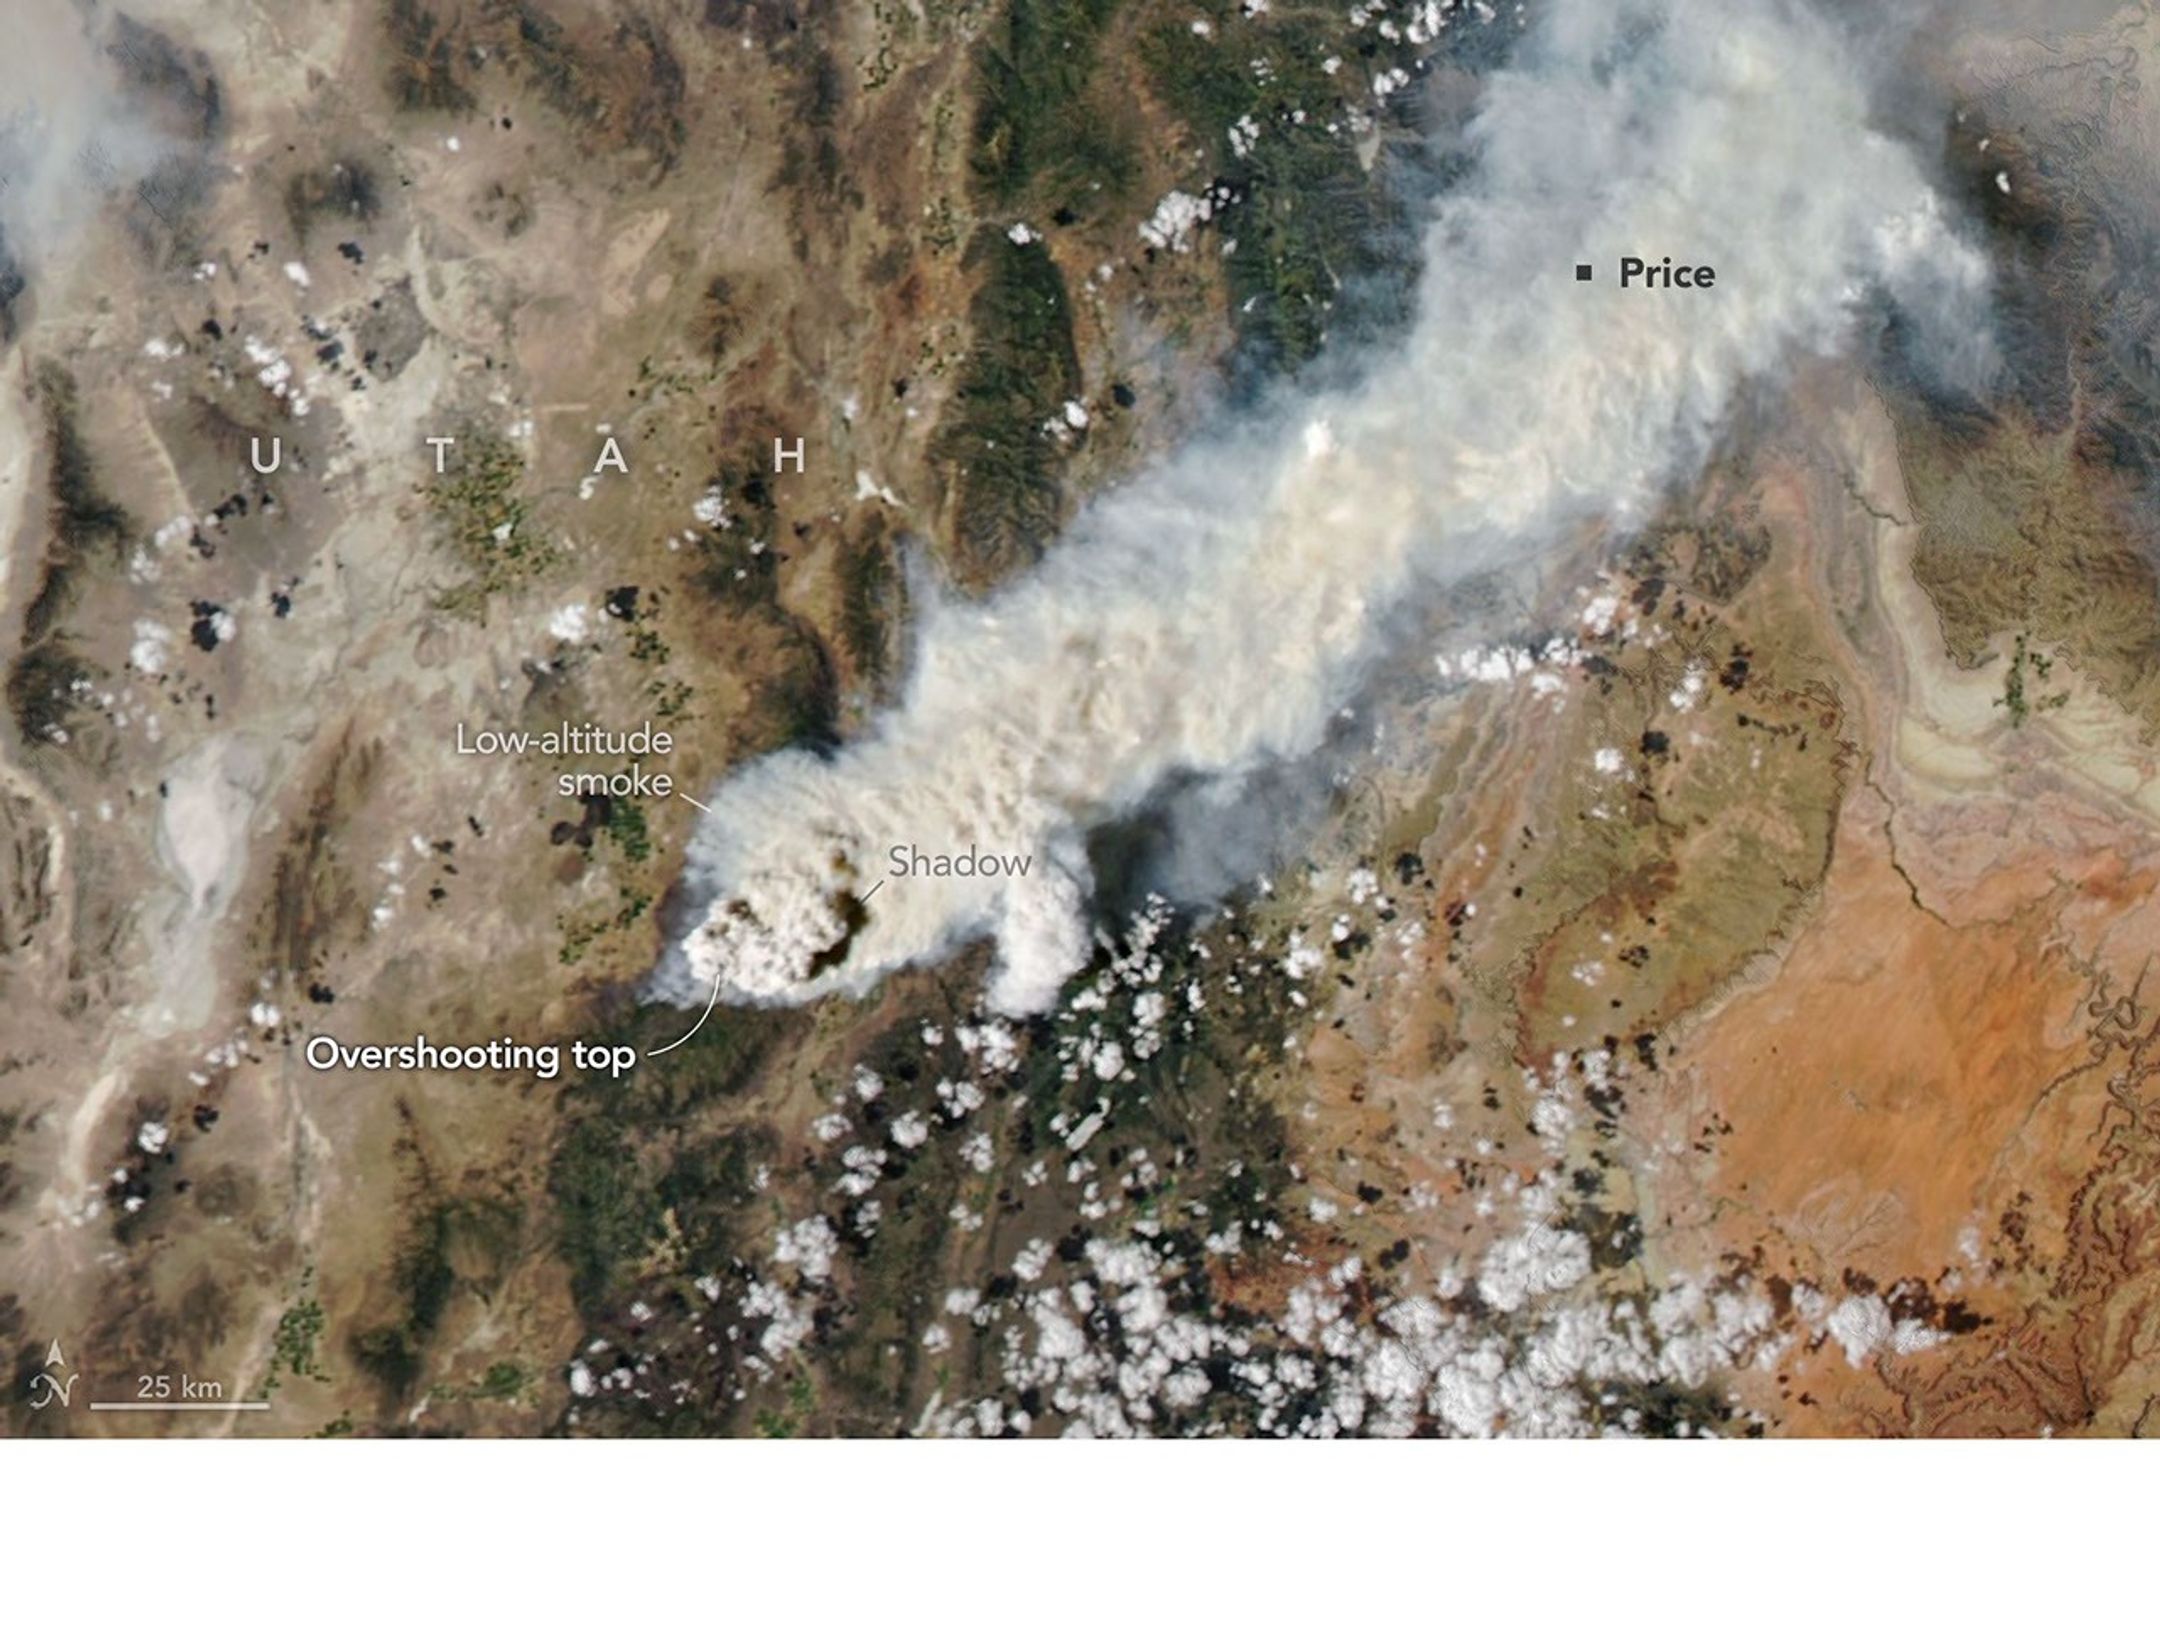
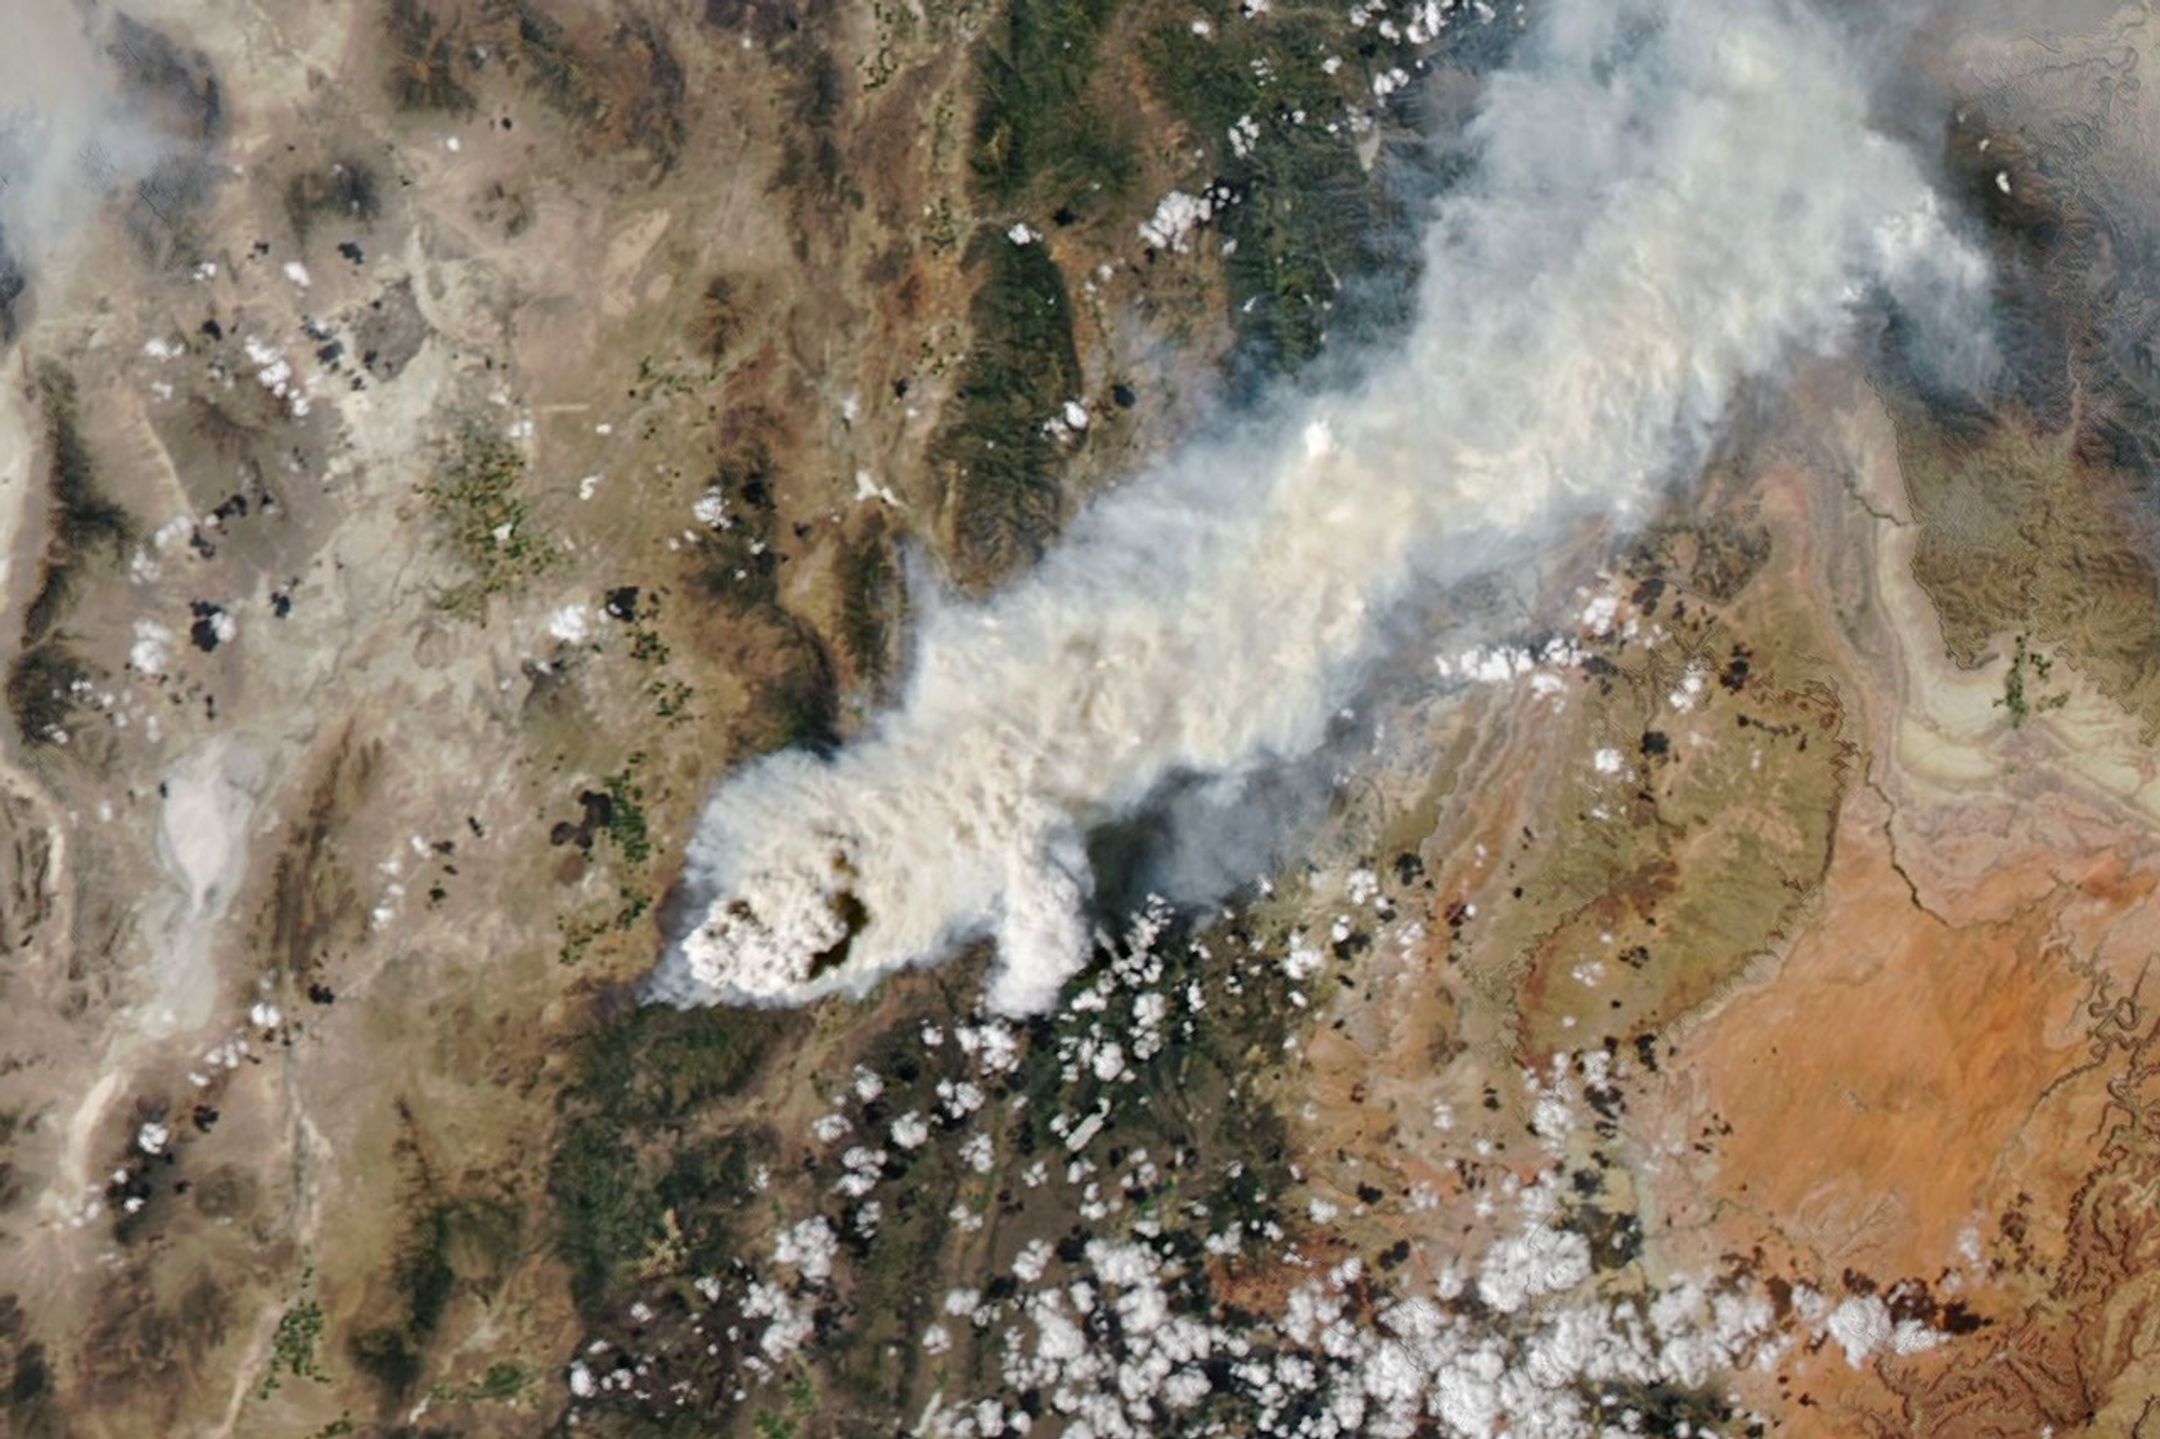
Textured gray wildfire smoke streams east from a fire burning near Fishlake National Forest. A dark shadow is visible to the east of a tall plume near the fire front.
NASA Earth Observatory/Michala Garrison

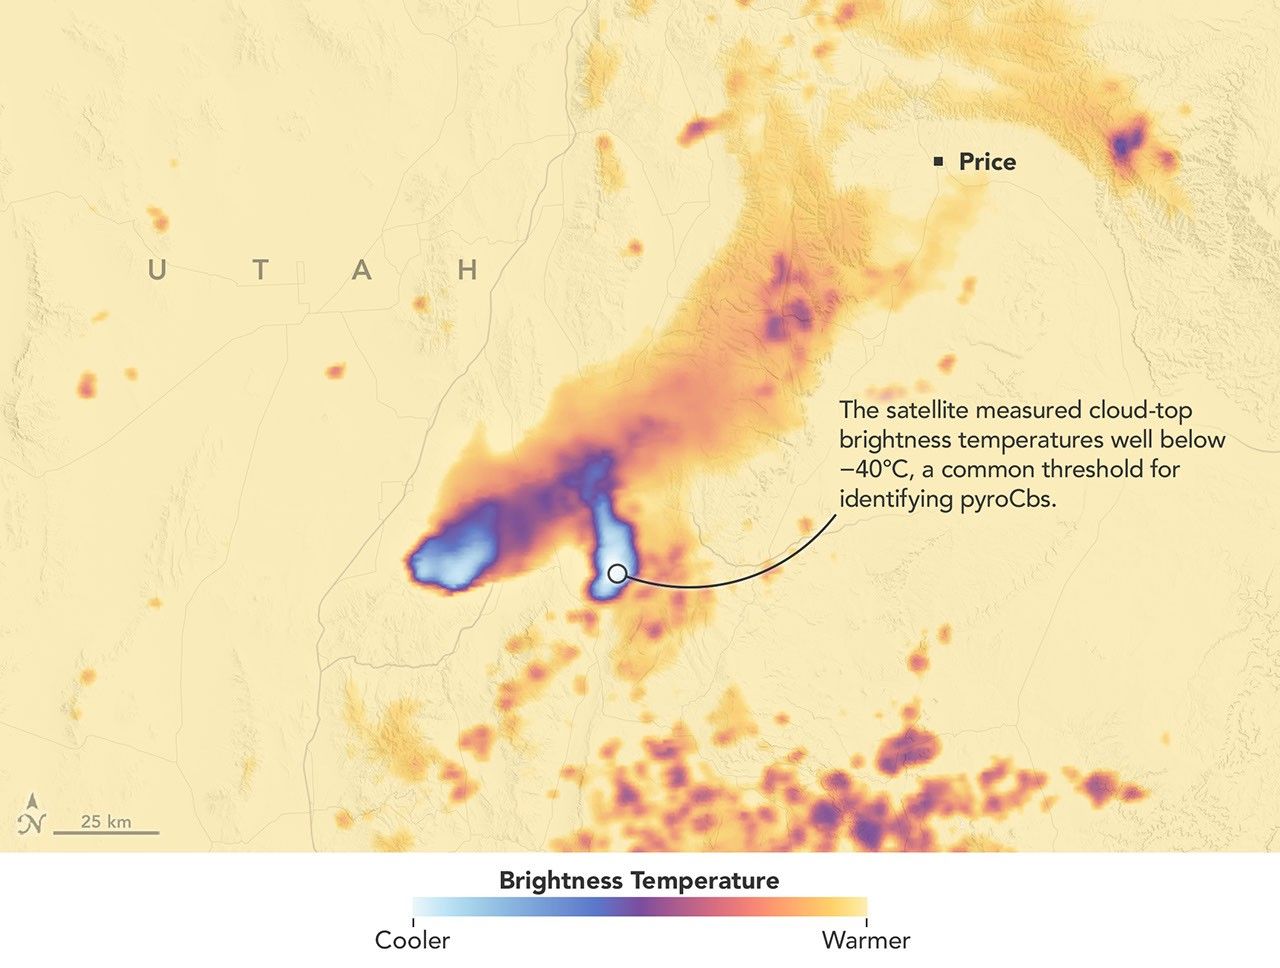
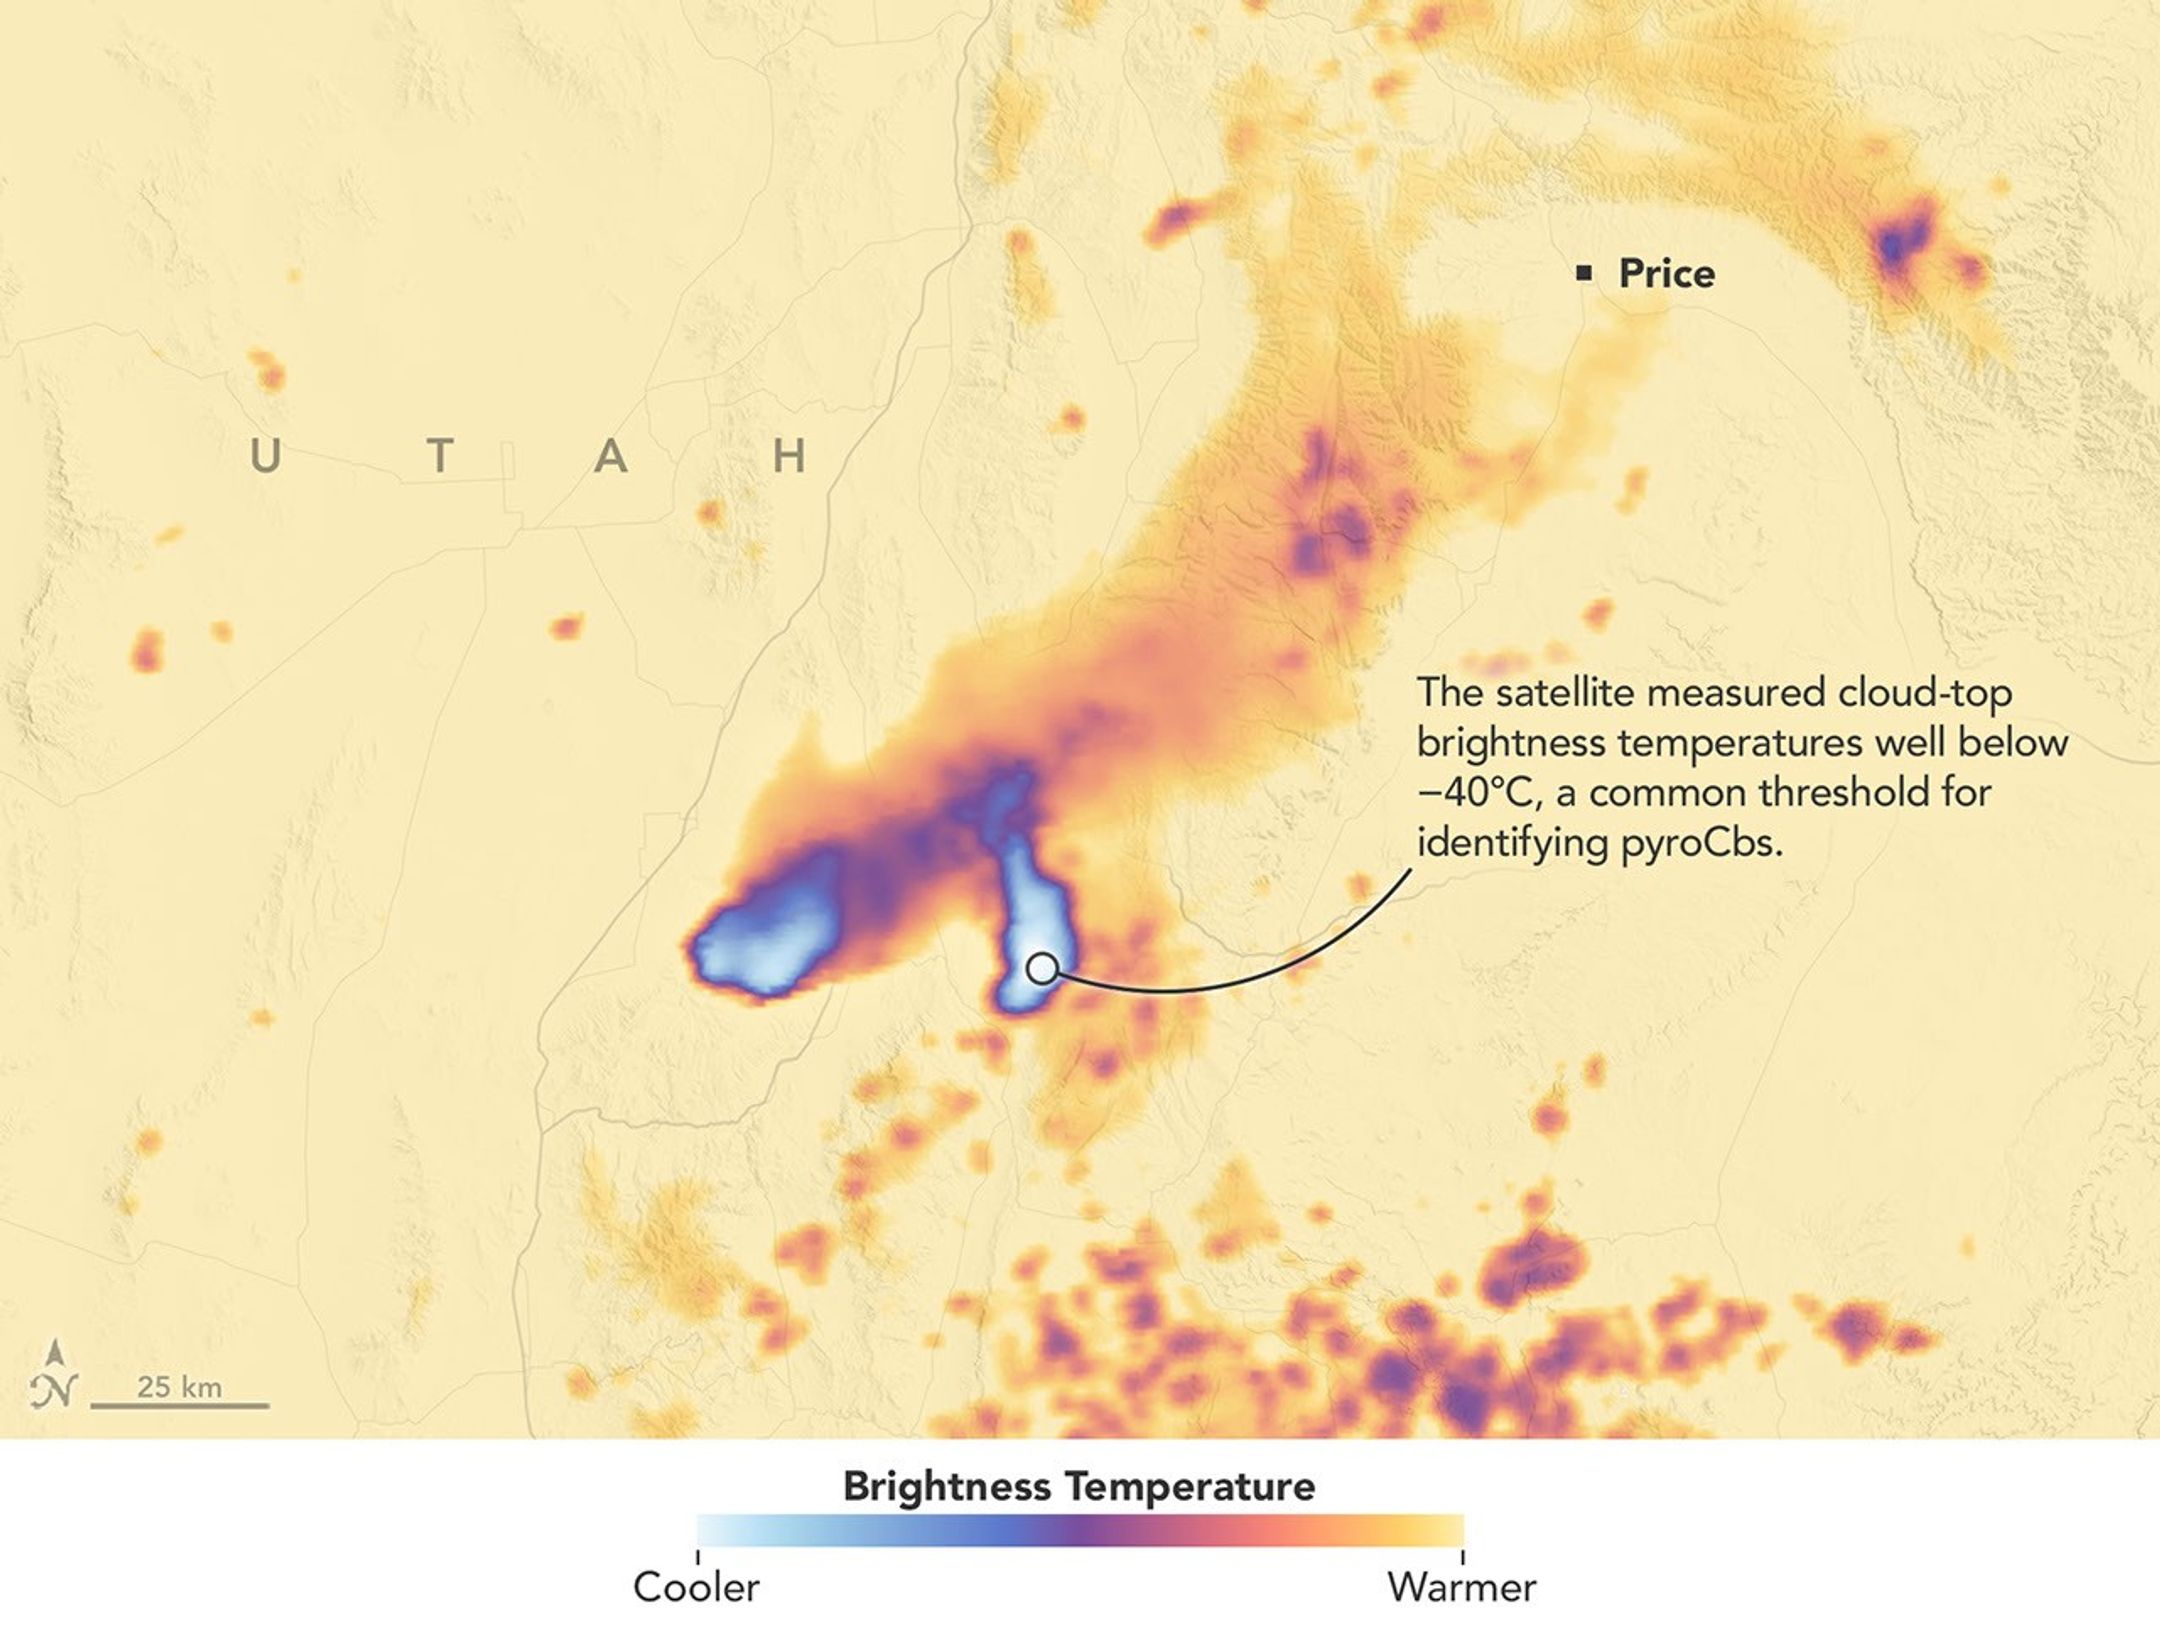
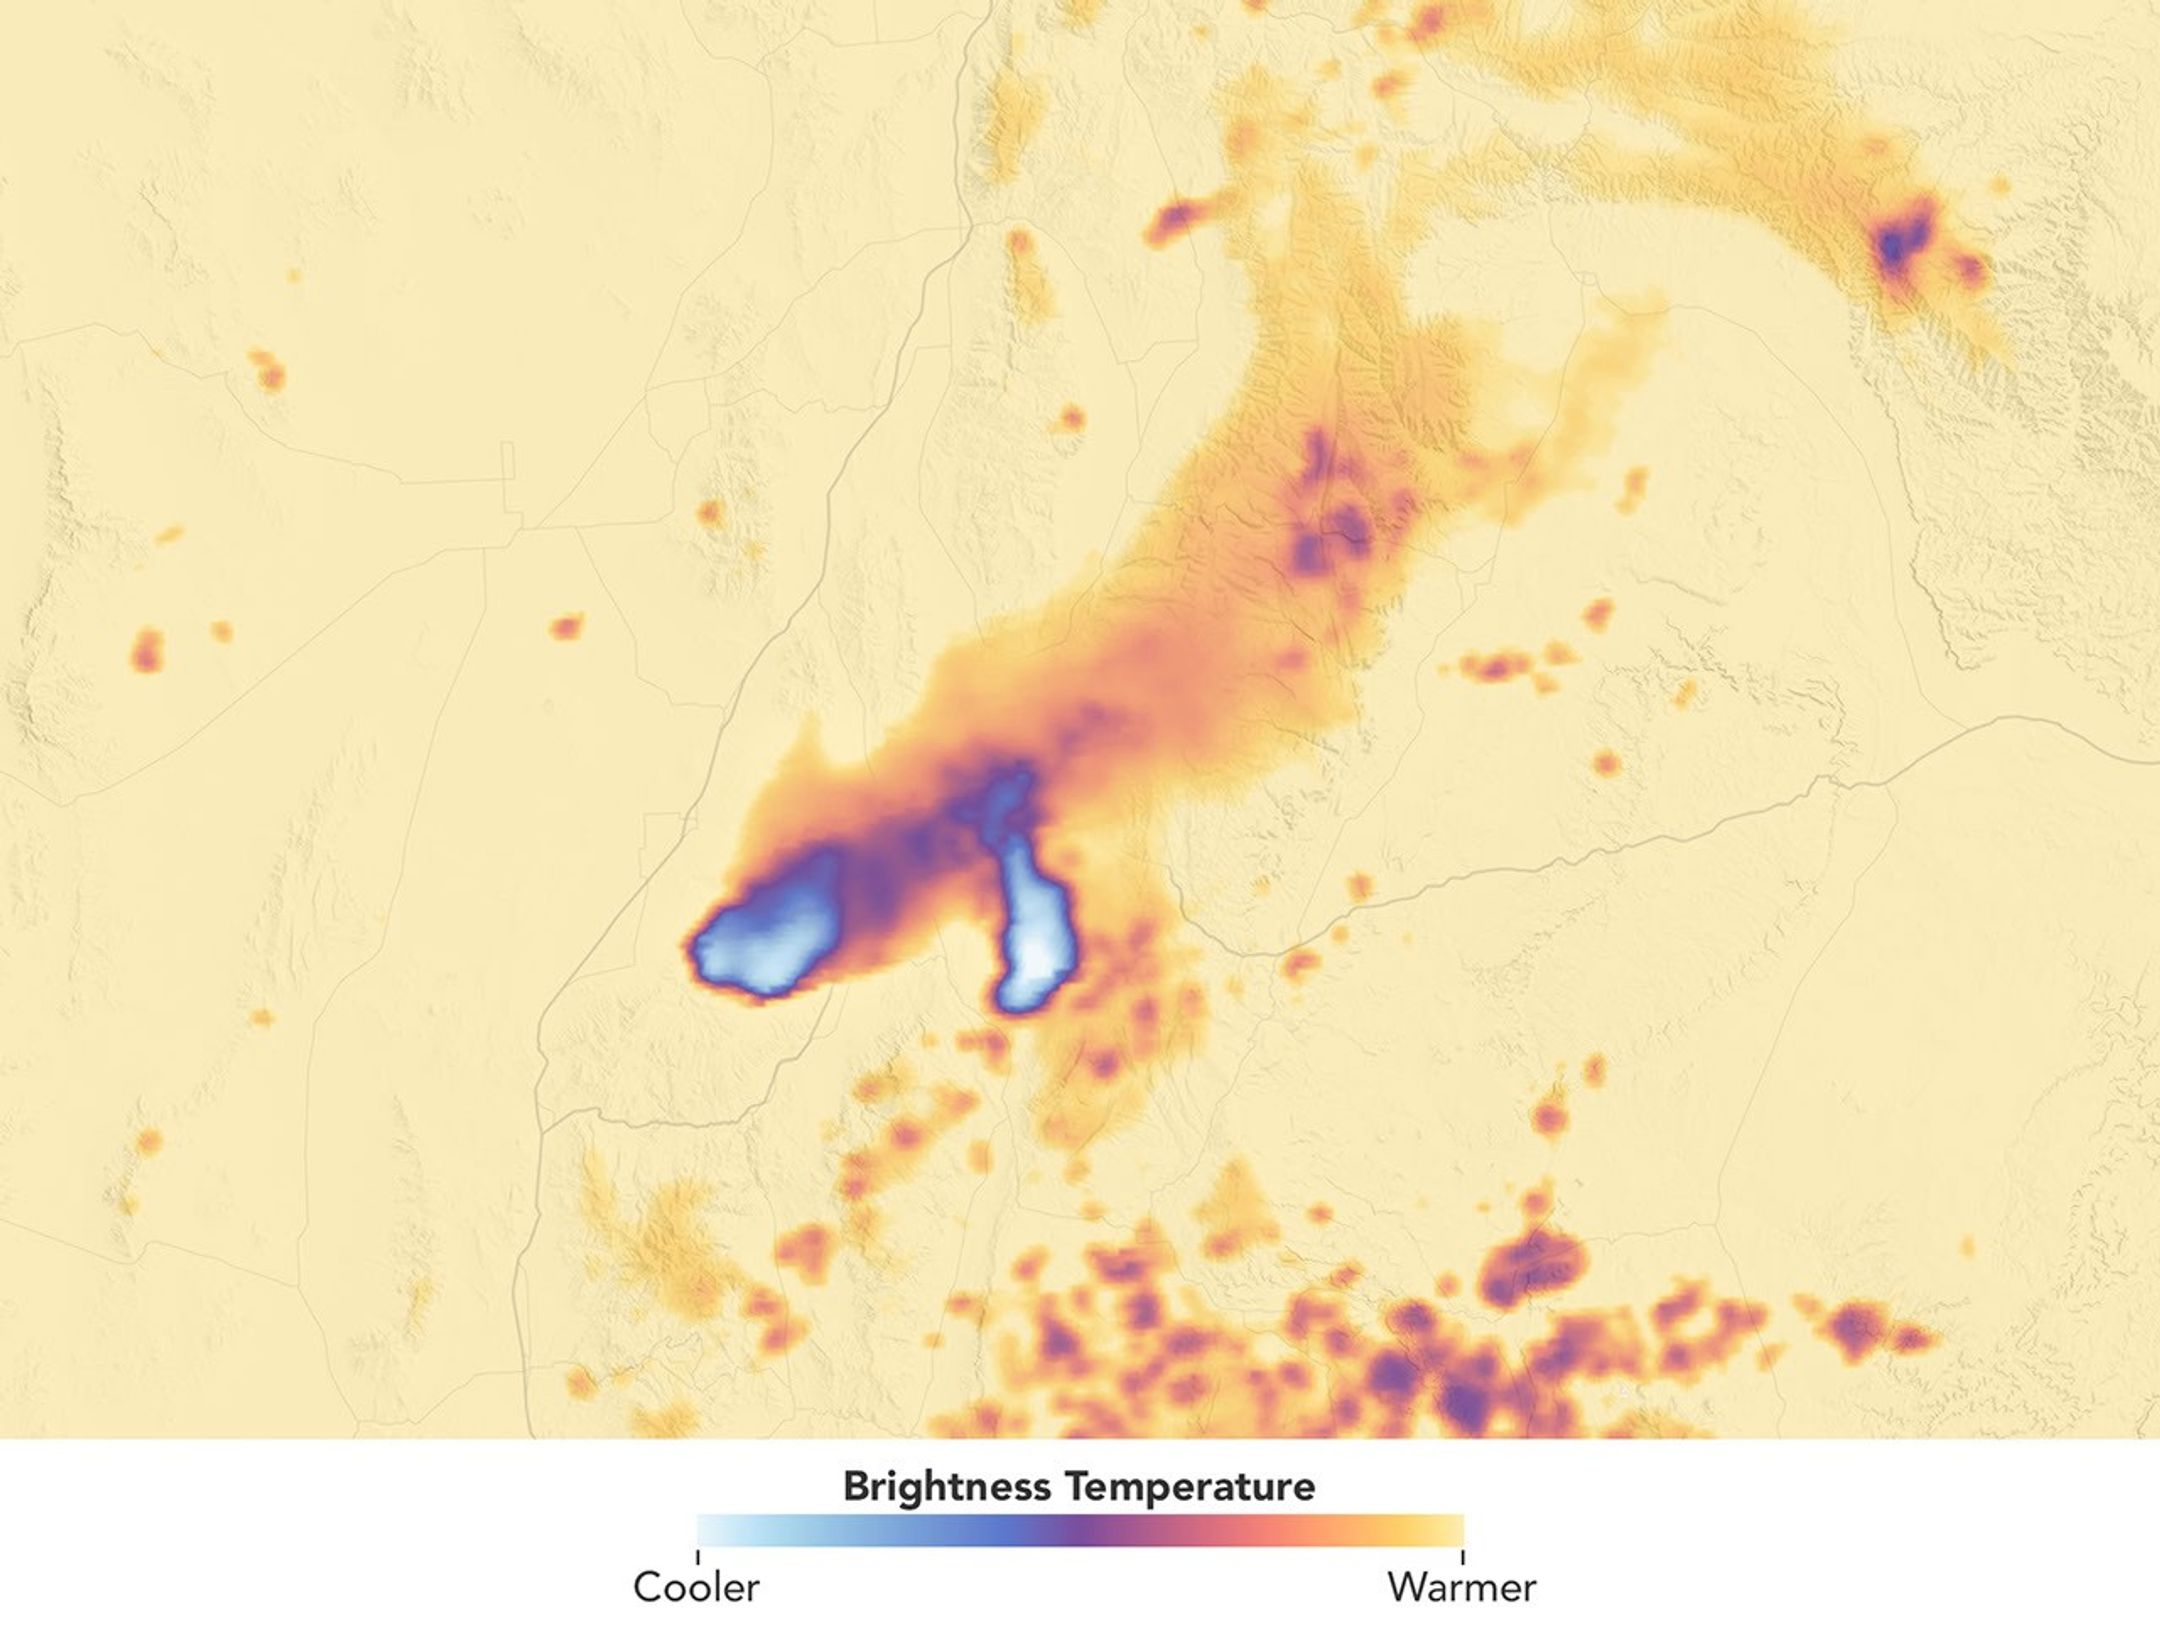
A data visualization shows the cloud-top brightness temperature of the same scene. Tall, cold smoky clouds appear white, and warmer plumes at lower heights appear purple.
NASA Earth Observatory/Michala Garrison

Textured gray wildfire smoke streams east from a fire burning near Fishlake National Forest. A dark shadow is visible to the east of a tall plume near the fire front.
NASA Earth Observatory/Michala Garrison

A data visualization shows the cloud-top brightness temperature of the same scene. Tall, cold smoky clouds appear white, and warmer plumes at lower heights appear purple.
NASA Earth Observatory/Michala Garrison


Natural Color

Brightness Temperature


A smoke-infused pyrocumulonimbus (pyroCb) rises from the Widemouth 2 fire in Utah in these images captured by the MODIS (Moderate Resolution Imaging Spectroradiometer) on NASA’s Aqua satellite. The left image is natural color; the right image is false color, revealing cloud-top brightness temperatures below -40°C, a commonly used threshold for identifying pyroCbs. NASA Earth Observatory images by Michala Garrison.

Scientists have long known that volcanoes can launch large quantities of particles into the stratosphere. In the past few decades, it has become clear that wildfires do this, too, by generating towering, smoke-infused pyrocumulonimbus (pyroCb) clouds.

The largest pyroCbs are stunning weather-making features that generate massive thunderheads capable of unleashing lightning, hail, and heavy rain. A growing body of research shows that pyroCbs can also leave an outsized imprint on the upper atmosphere by channeling pulses of particles and gases into the stratosphere’s mostly dry, cloudless confines. Once there, smoke can spread widely and linger for months or years, sometimes circling the globe and likely influencing the ozone layer and Earth’s energy budget.

Understanding these enigmatic and dangerous clouds is why a team of atmospheric scientists—part of a NASA mission called INSPYRE (INjected Smoke and PYRocumulonimbus Experiment)—is spending the summer chasing them with NASA’s ER-2 aircraft, NSF/NCAR’s GV, and a suite of truck-based sensors. The team completed one of its first sampling runs of the summer on August 3, 2026, when the GV flew through a high-altitude pulse of smoke from the Widemouth 2 fire, one of Utah’s largest so far this year.

Lightning ignited the fire on July 27, 2026, but it remained relatively small until August 2, when it more than doubled in size amid intense winds and hot, dry conditions. That afternoon, soon after it had produced two pyroCb bursts, the MODIS (Moderate Resolution Imaging Spectroradiometer) on NASA’s Aqua satellite captured this image (above), showing a chimney of high-altitude cloud and smoke casting a shadow on low-altitude smoke below.

These bursts propelled clouds high enough that Aqua measured cloud-top brightness temperatures well below −40°C, a common threshold for identifying pyroCbs and a sign that the cloud tops were bubbling to the top of the troposphere and sometimes into the stratosphere. The brightness temperature measurements “reveal two discrete pulses of pyroCb action,” said Michael Fromm, a scientist at the U.S. Naval Research Laboratory. “The westernmost is the youngest pulse and stands out in the visible imagery by virtue of its shadow.”

Though relatively routine and minor, this pyroCb event followed a pre-dawn pyroCb from the same fire, imaged by the NOAA weather satellite GOES-West. “Morning pyroCbs are much more unusual,” Fromm said, because they don’t benefit from daytime heating that helps fuel convection. In this case, however, there appeared to be enough atmospheric instability and water vapor in the air to allow for pyroCb development. 

Multiple pyroCbs in a single day could have added unwanted complexity for forecasters and fire officials battling the blaze and organizing evacuations, said David Peterson, INSPYRE’s principal investigator. “Minimizing that sort of uncertainty for fire forecasters is a big part of the reason we’re out here studying this,” he added.

Remote sensing experts like Peterson and Fromm routinely study pyroCbs from afar with satellites, but it’s less common for pilots to chase and sample smoke plumes just hours after they form. In this case, the GV aircraft, on the ground in Colorado when the Widemouth 2 fire blew up, made a beeline for a high-altitude smoke plume as it drifted over New Mexico on August 3. The instruments on the plane sampled smoke at roughly 12 kilometers (8 miles) above the surface, collecting data at a height that isn’t typically incorporated into forecast models.

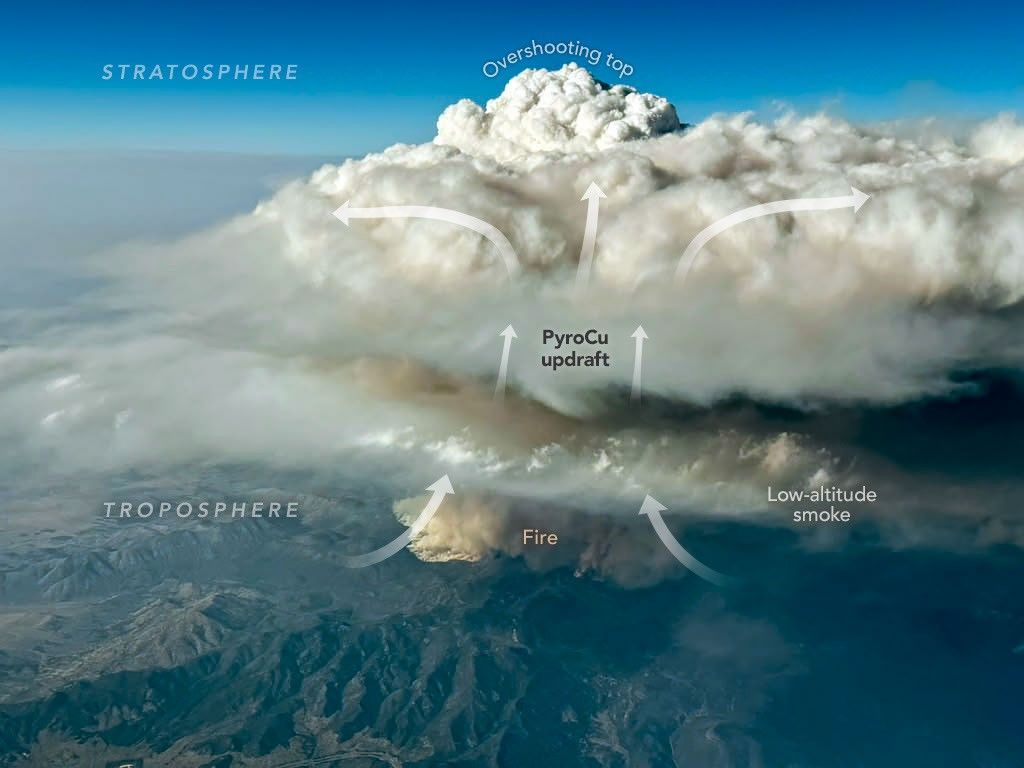
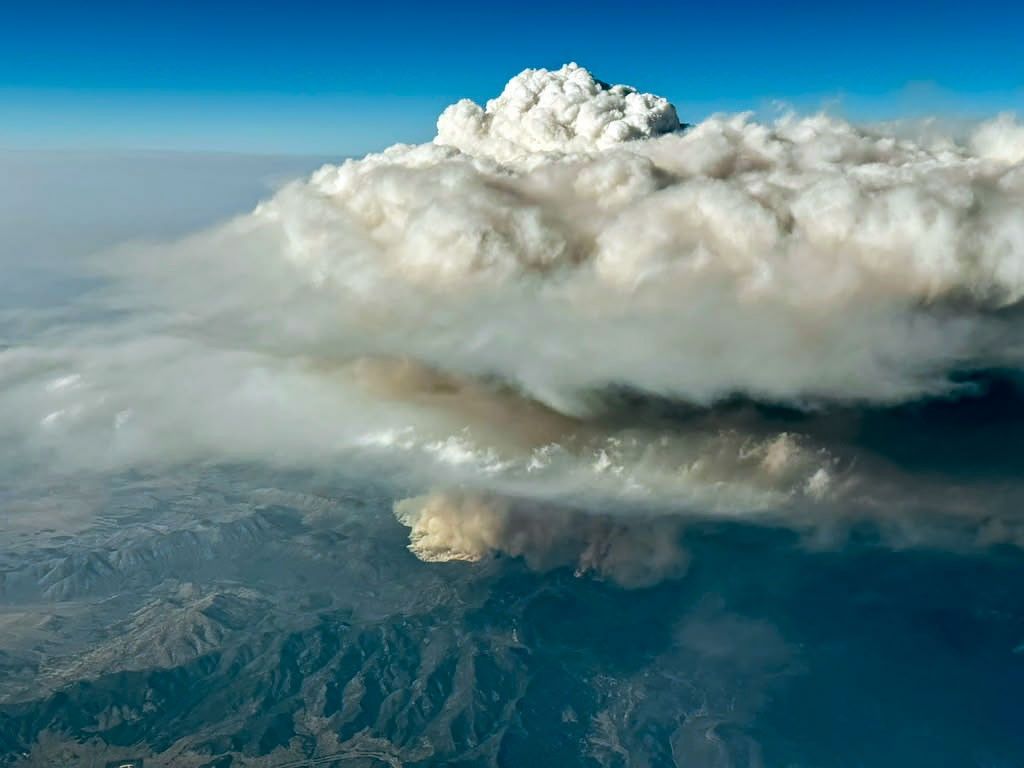
An aerial image shows a thick, puffy white cloud rising high above a patch of darker smoke visible near a surface of variable mountainous terrain.
A photo of the Widemouth 2 fire taken from an INSPYRE aircraft during a sampling flight on August 3, 2026, shows a smoke-infused cloud rising high above the fire.
Bernadett Weinzierl/University of Vienna

During that mission, a scientist on board captured this image (above) of a pyrocumulus (pyroCu) billowing up over the Widemouth 2 fire. While not as tall or energetic as pyroCbs, pyroCus are precursor clouds that share many of the same characteristics. Here, heat from the fire is fueling strong convective updrafts, forming a towering cloud with puffy overshooting tops that poke into the upper troposphere as lower-altitude smoke drifts below.

Satellites excel at identifying pyroCbs by measuring the temperature of the cloud tops that form above smoke plumes. Using this technique, researchers have established that wildfires produce about 70 pyroCbs per year, many in dense forests of Canada and Russia, though plenty also occur in grasslands and savannas in the United States and Australia. So far in 2026, Fromm and colleagues have identified at least 13 in the continental United States.

Since one of the first pyroCbs appeared in the scientific literature in the early 2000s, scientists have cataloged well over 700 events, and they now believe that wildfires may contribute up to 25 percent of the black carbon and organic aerosols in the lower stratosphere. The sheer frequency of pyroCbs means that the total mass of particles they inject over the course of a wildfire season may rival that of large volcanic eruptions.

Still, many questions about the enigmatic clouds remain unanswered. It isn’t clear what vegetation is most likely to fuel pyroCbs, why some form more lightning than others, why they form in only a small fraction of fires, and how to accurately forecast them.

“Whether it be their dangerous manifestations on the ground or their long-lasting imprint on the upper troposphere and lower stratosphere,” Fromm said, “pyroCbs continue to surprise us.”

NASA Earth Observatory images by Michala Garrison, using MODIS data from NASA EOSDIS LANCE and GIBS/WorldviewPhoto by Bernadett Weinzierl/University of Vienna. Story by Adam Voiland.

References & Resources

You may also be interested in:

Stay up-to-date with the latest content from NASA as we explore the universe and discover more about our home planet.

Cottonwood Fire Chars Utah

5 min read

The blaze burned more than 150 square miles and swept through parts of a ski resort.

Article

Ontario Wildfire Smoke Moves East

3 min read

Canadian wildfires sent plumes of smoke streaming over Ontario, Quebec, and parts of the U.S. Midwest and Northeast.

Article

Cascade Volcanoes Shrouded in Smoke

3 min read

From the International Space Station, astronauts photographed Mount Hood and Mount Rainier as wildfire smoke spread across the Pacific Northwest…

Article

Source: science.nasa.gov

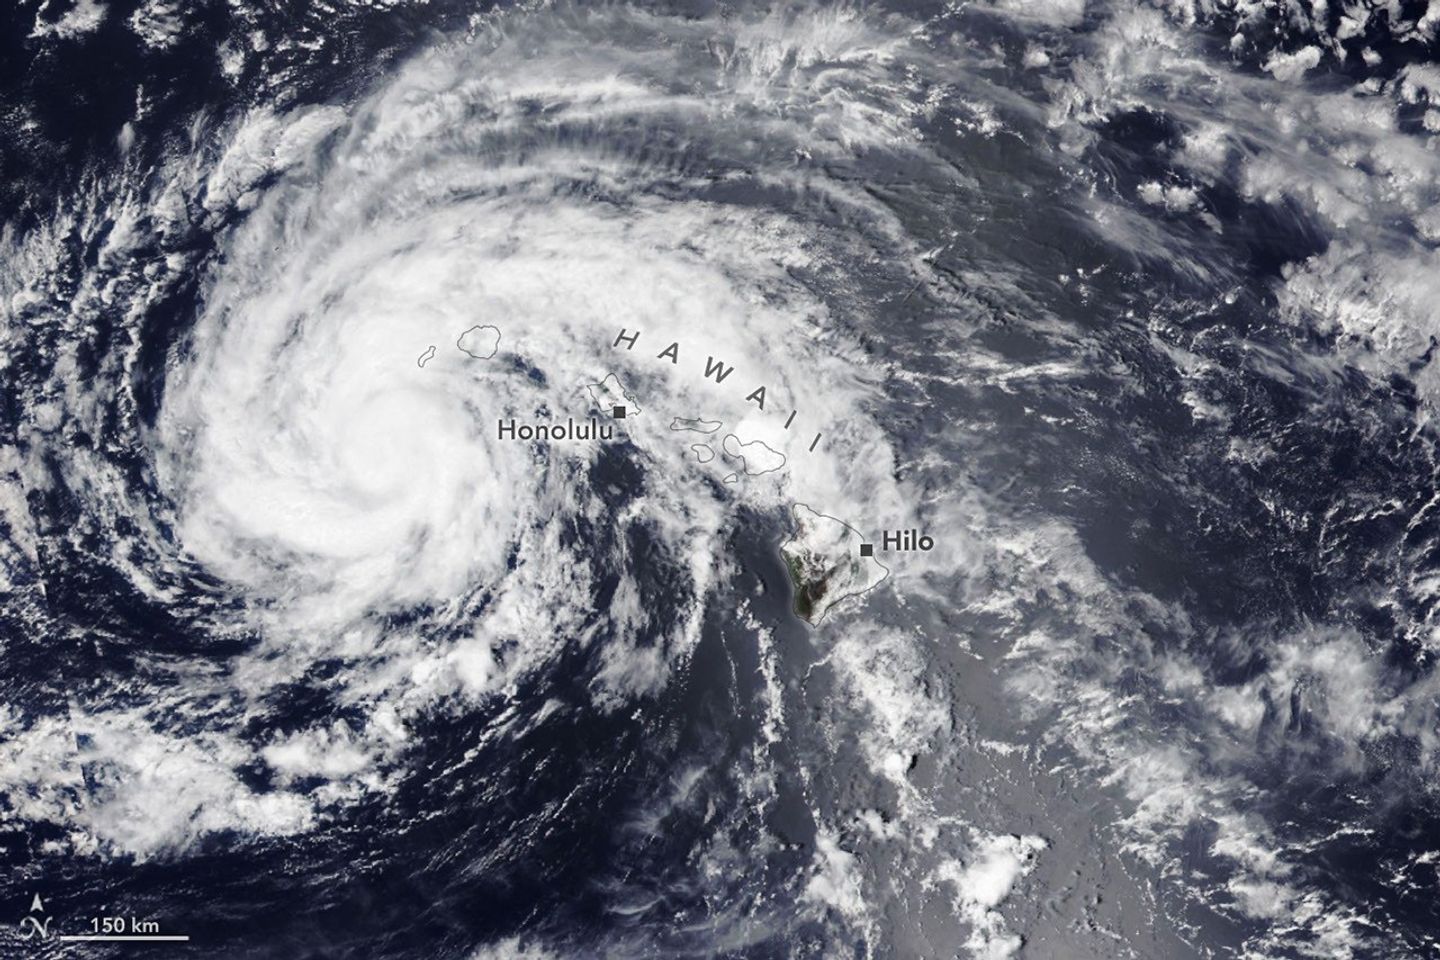
Lala Batters Hawaii


August 16, 2026
August 15, 2026

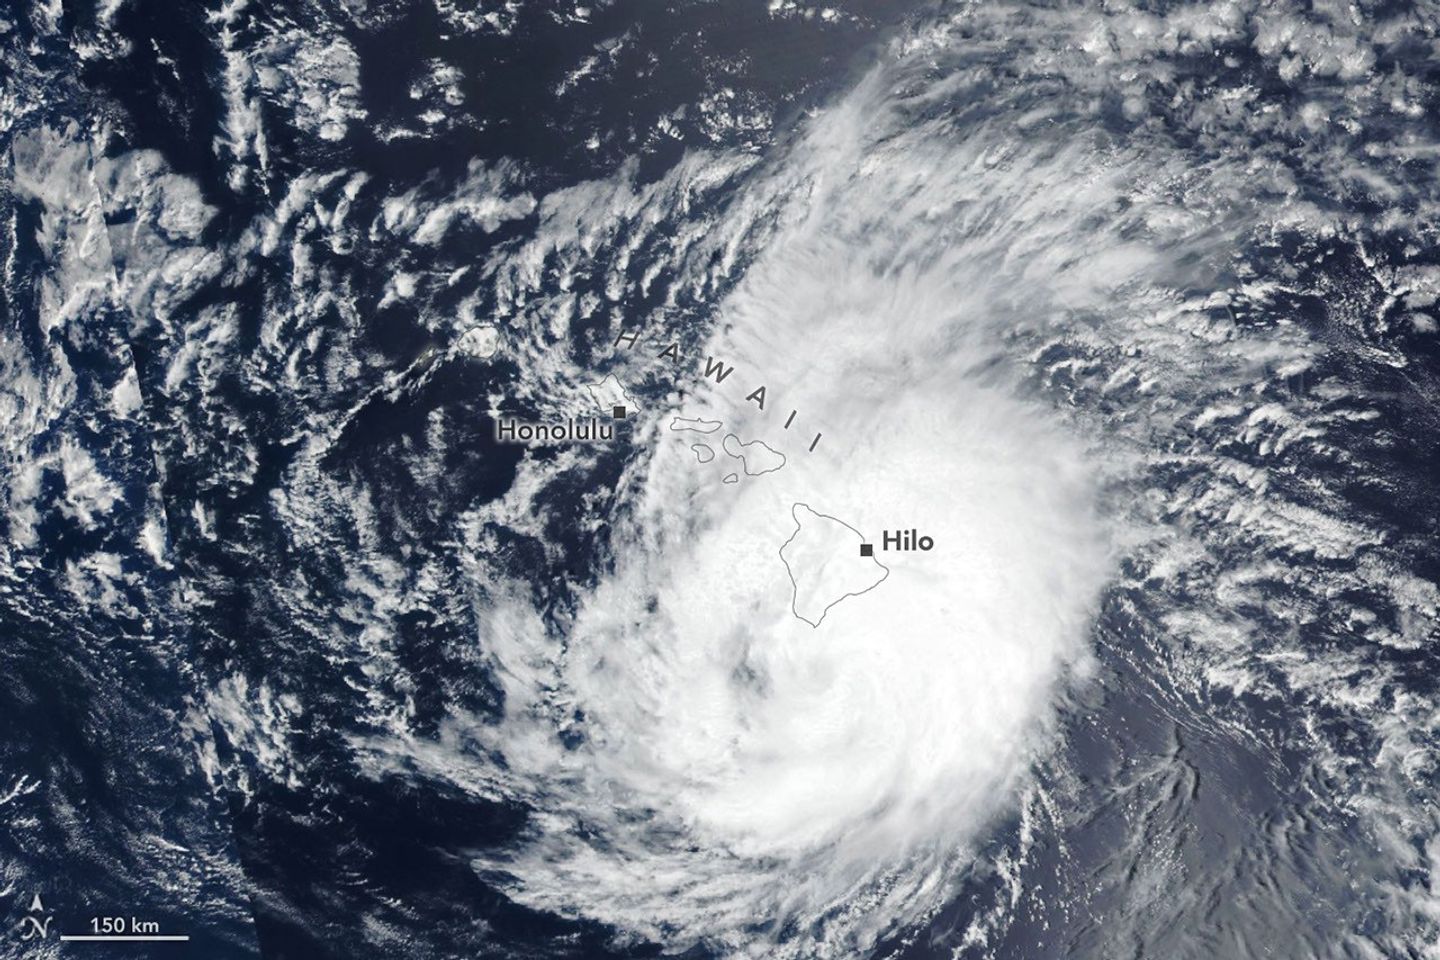
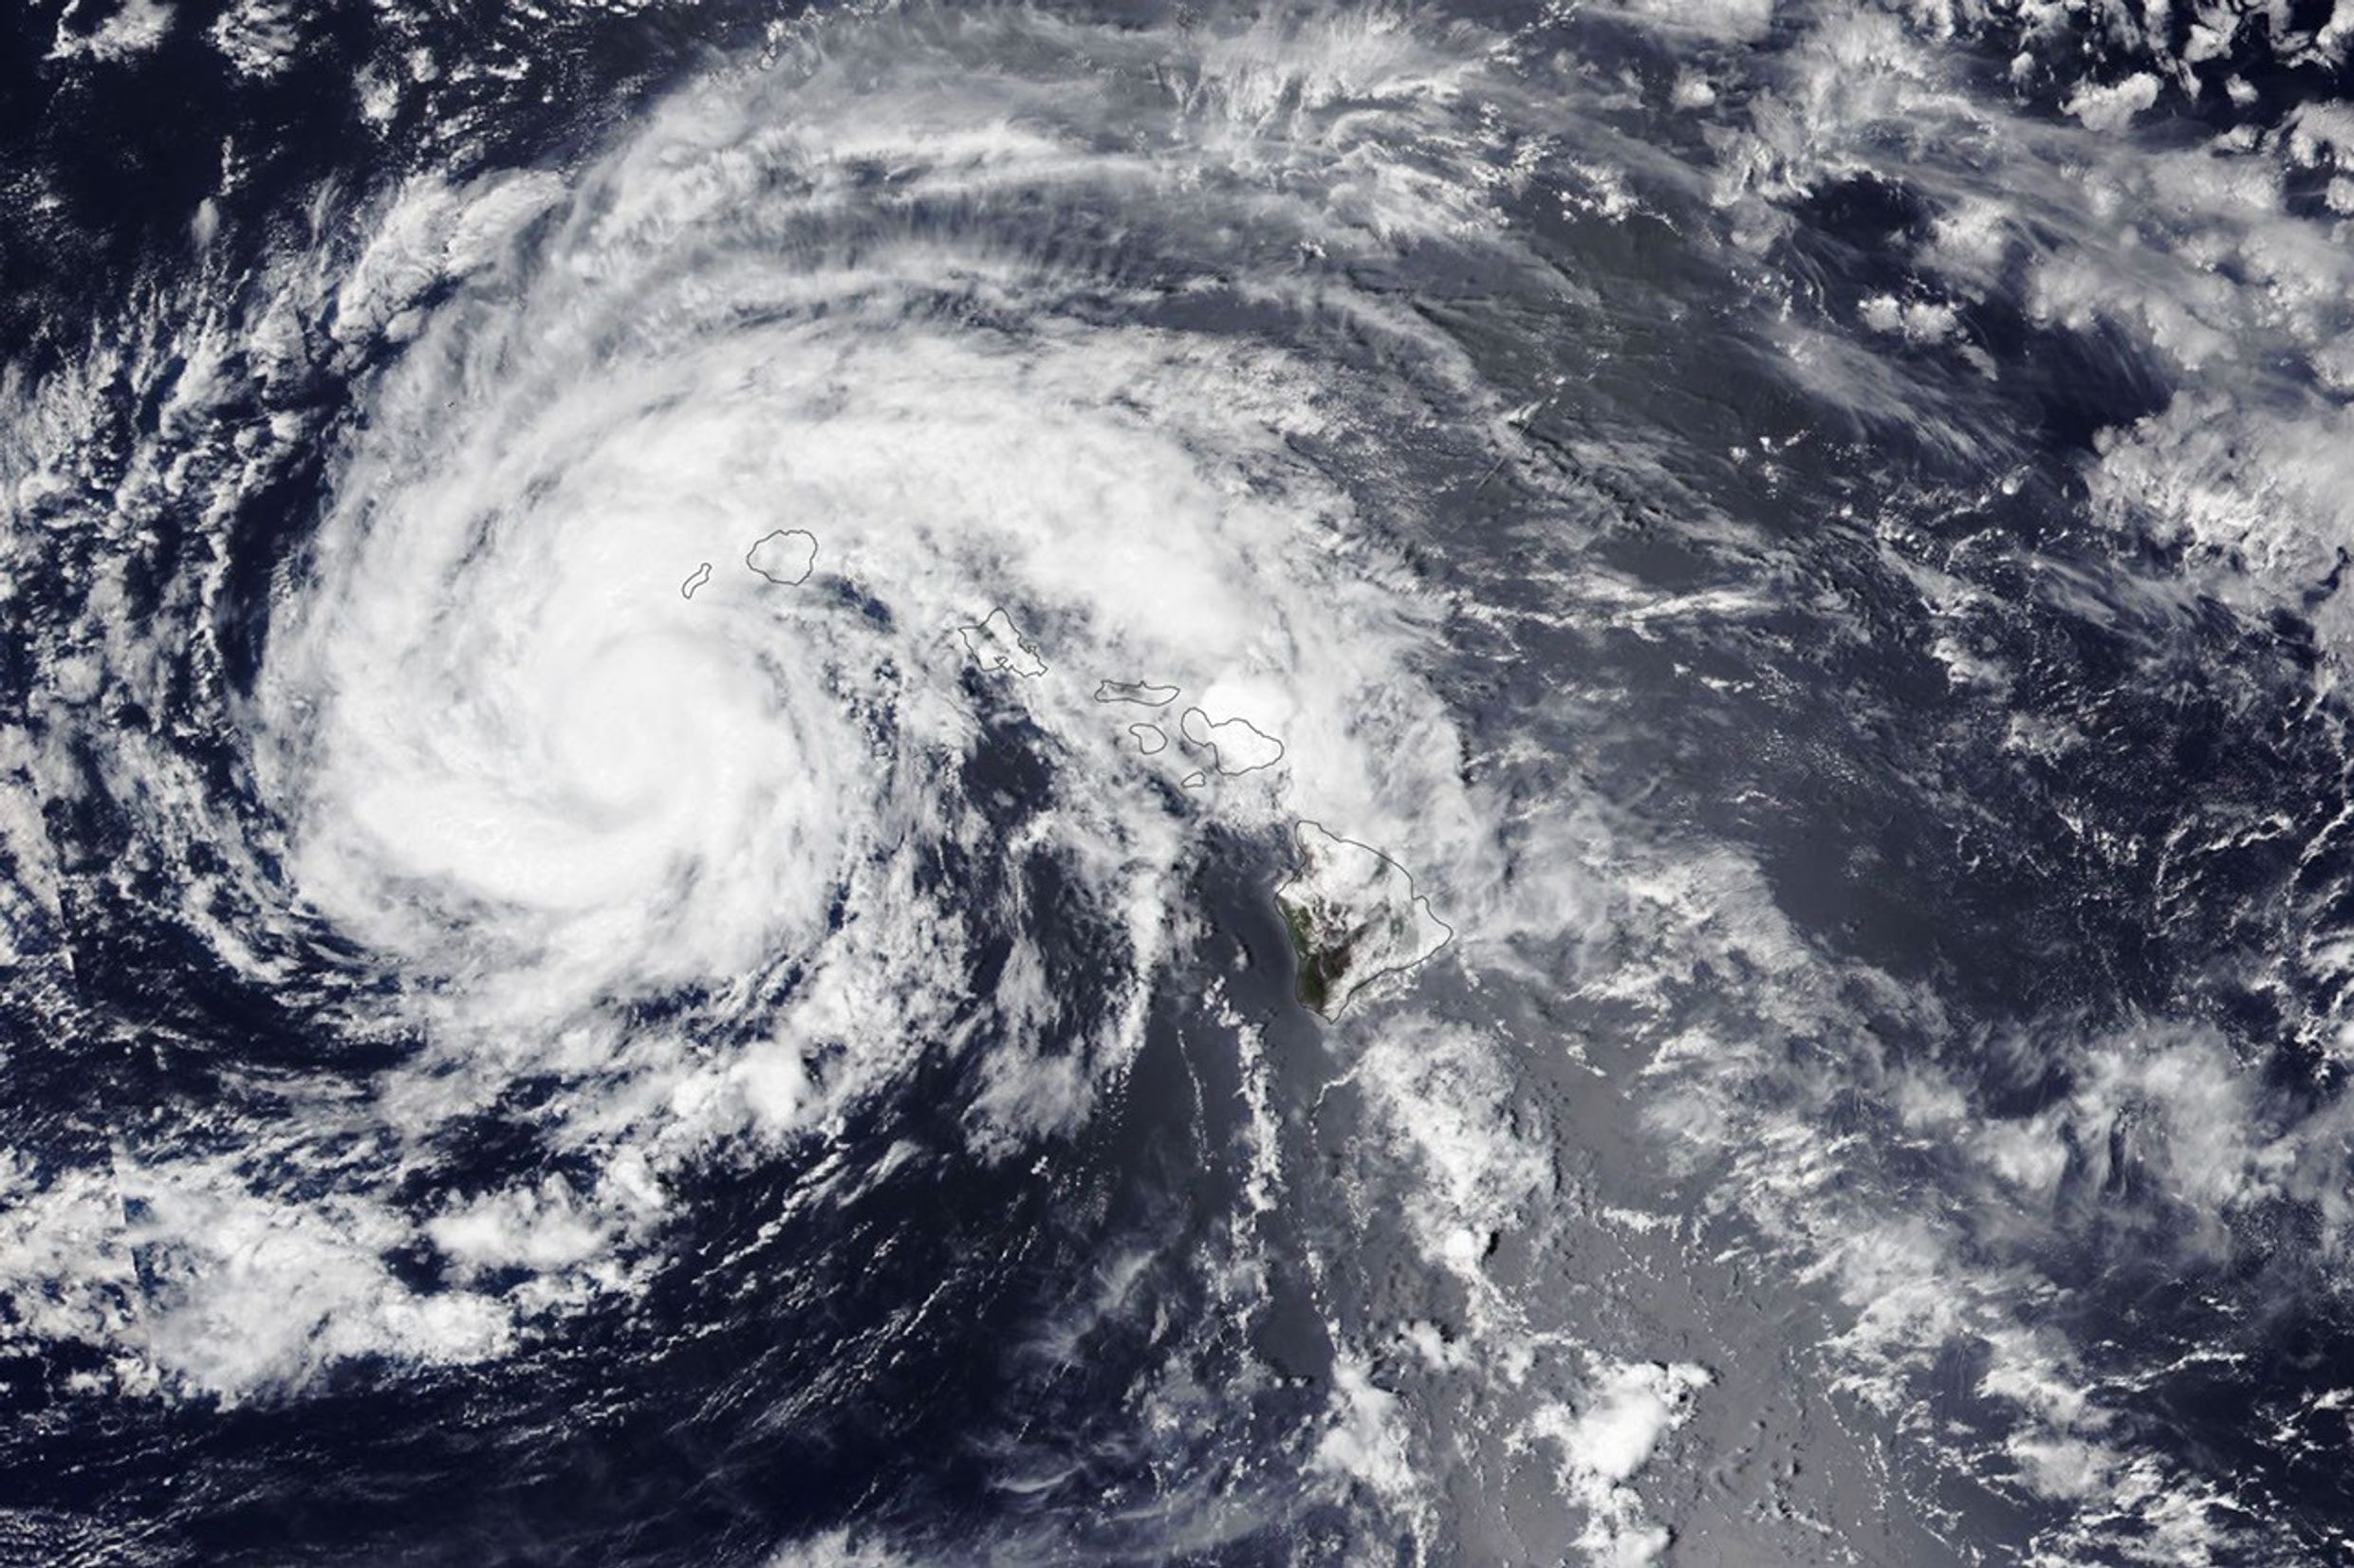
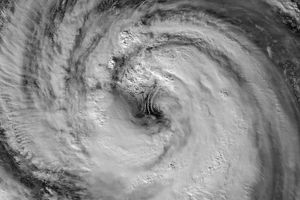
The spiraling clouds of a tropical storm are centered near the Hawaiian island of Kauaʻi.
NASA Earth Observatory / Lauren Dauphin

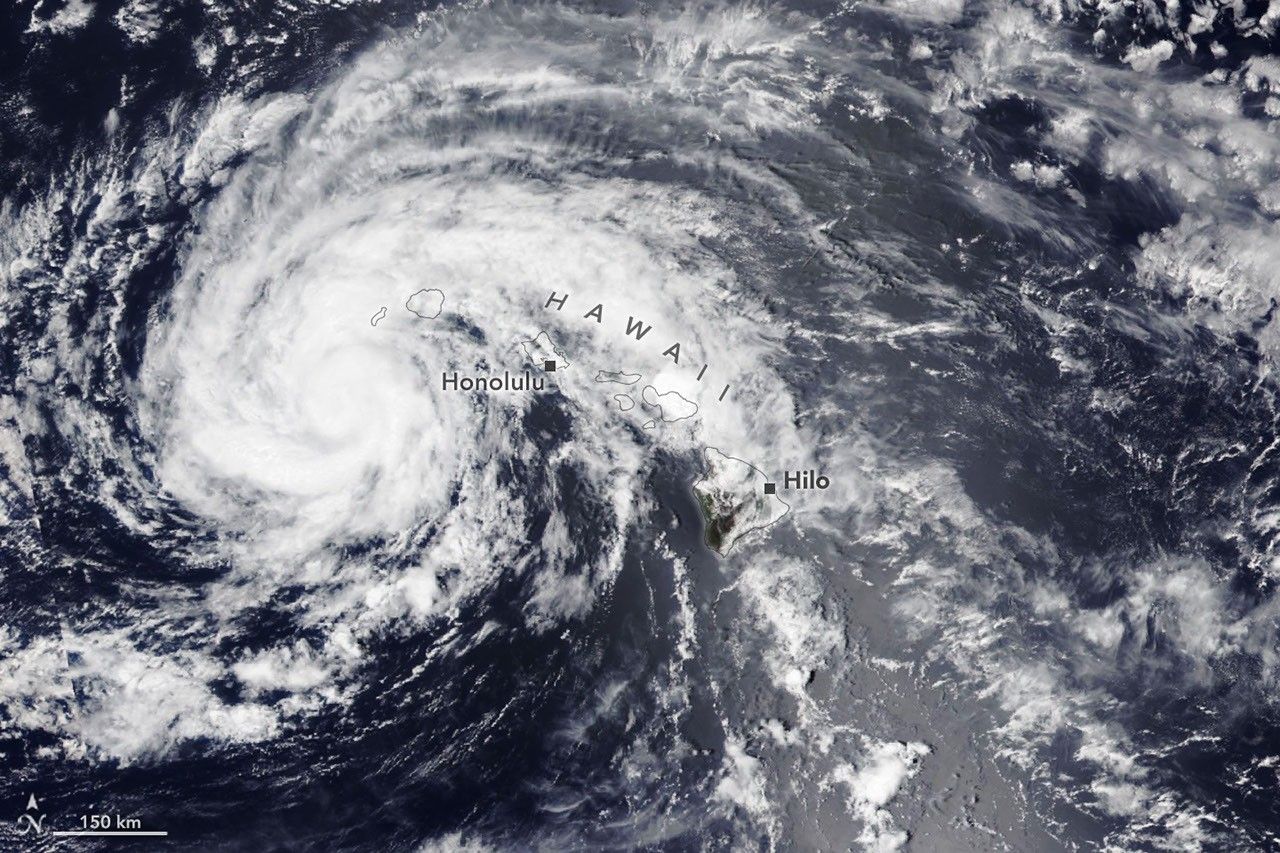
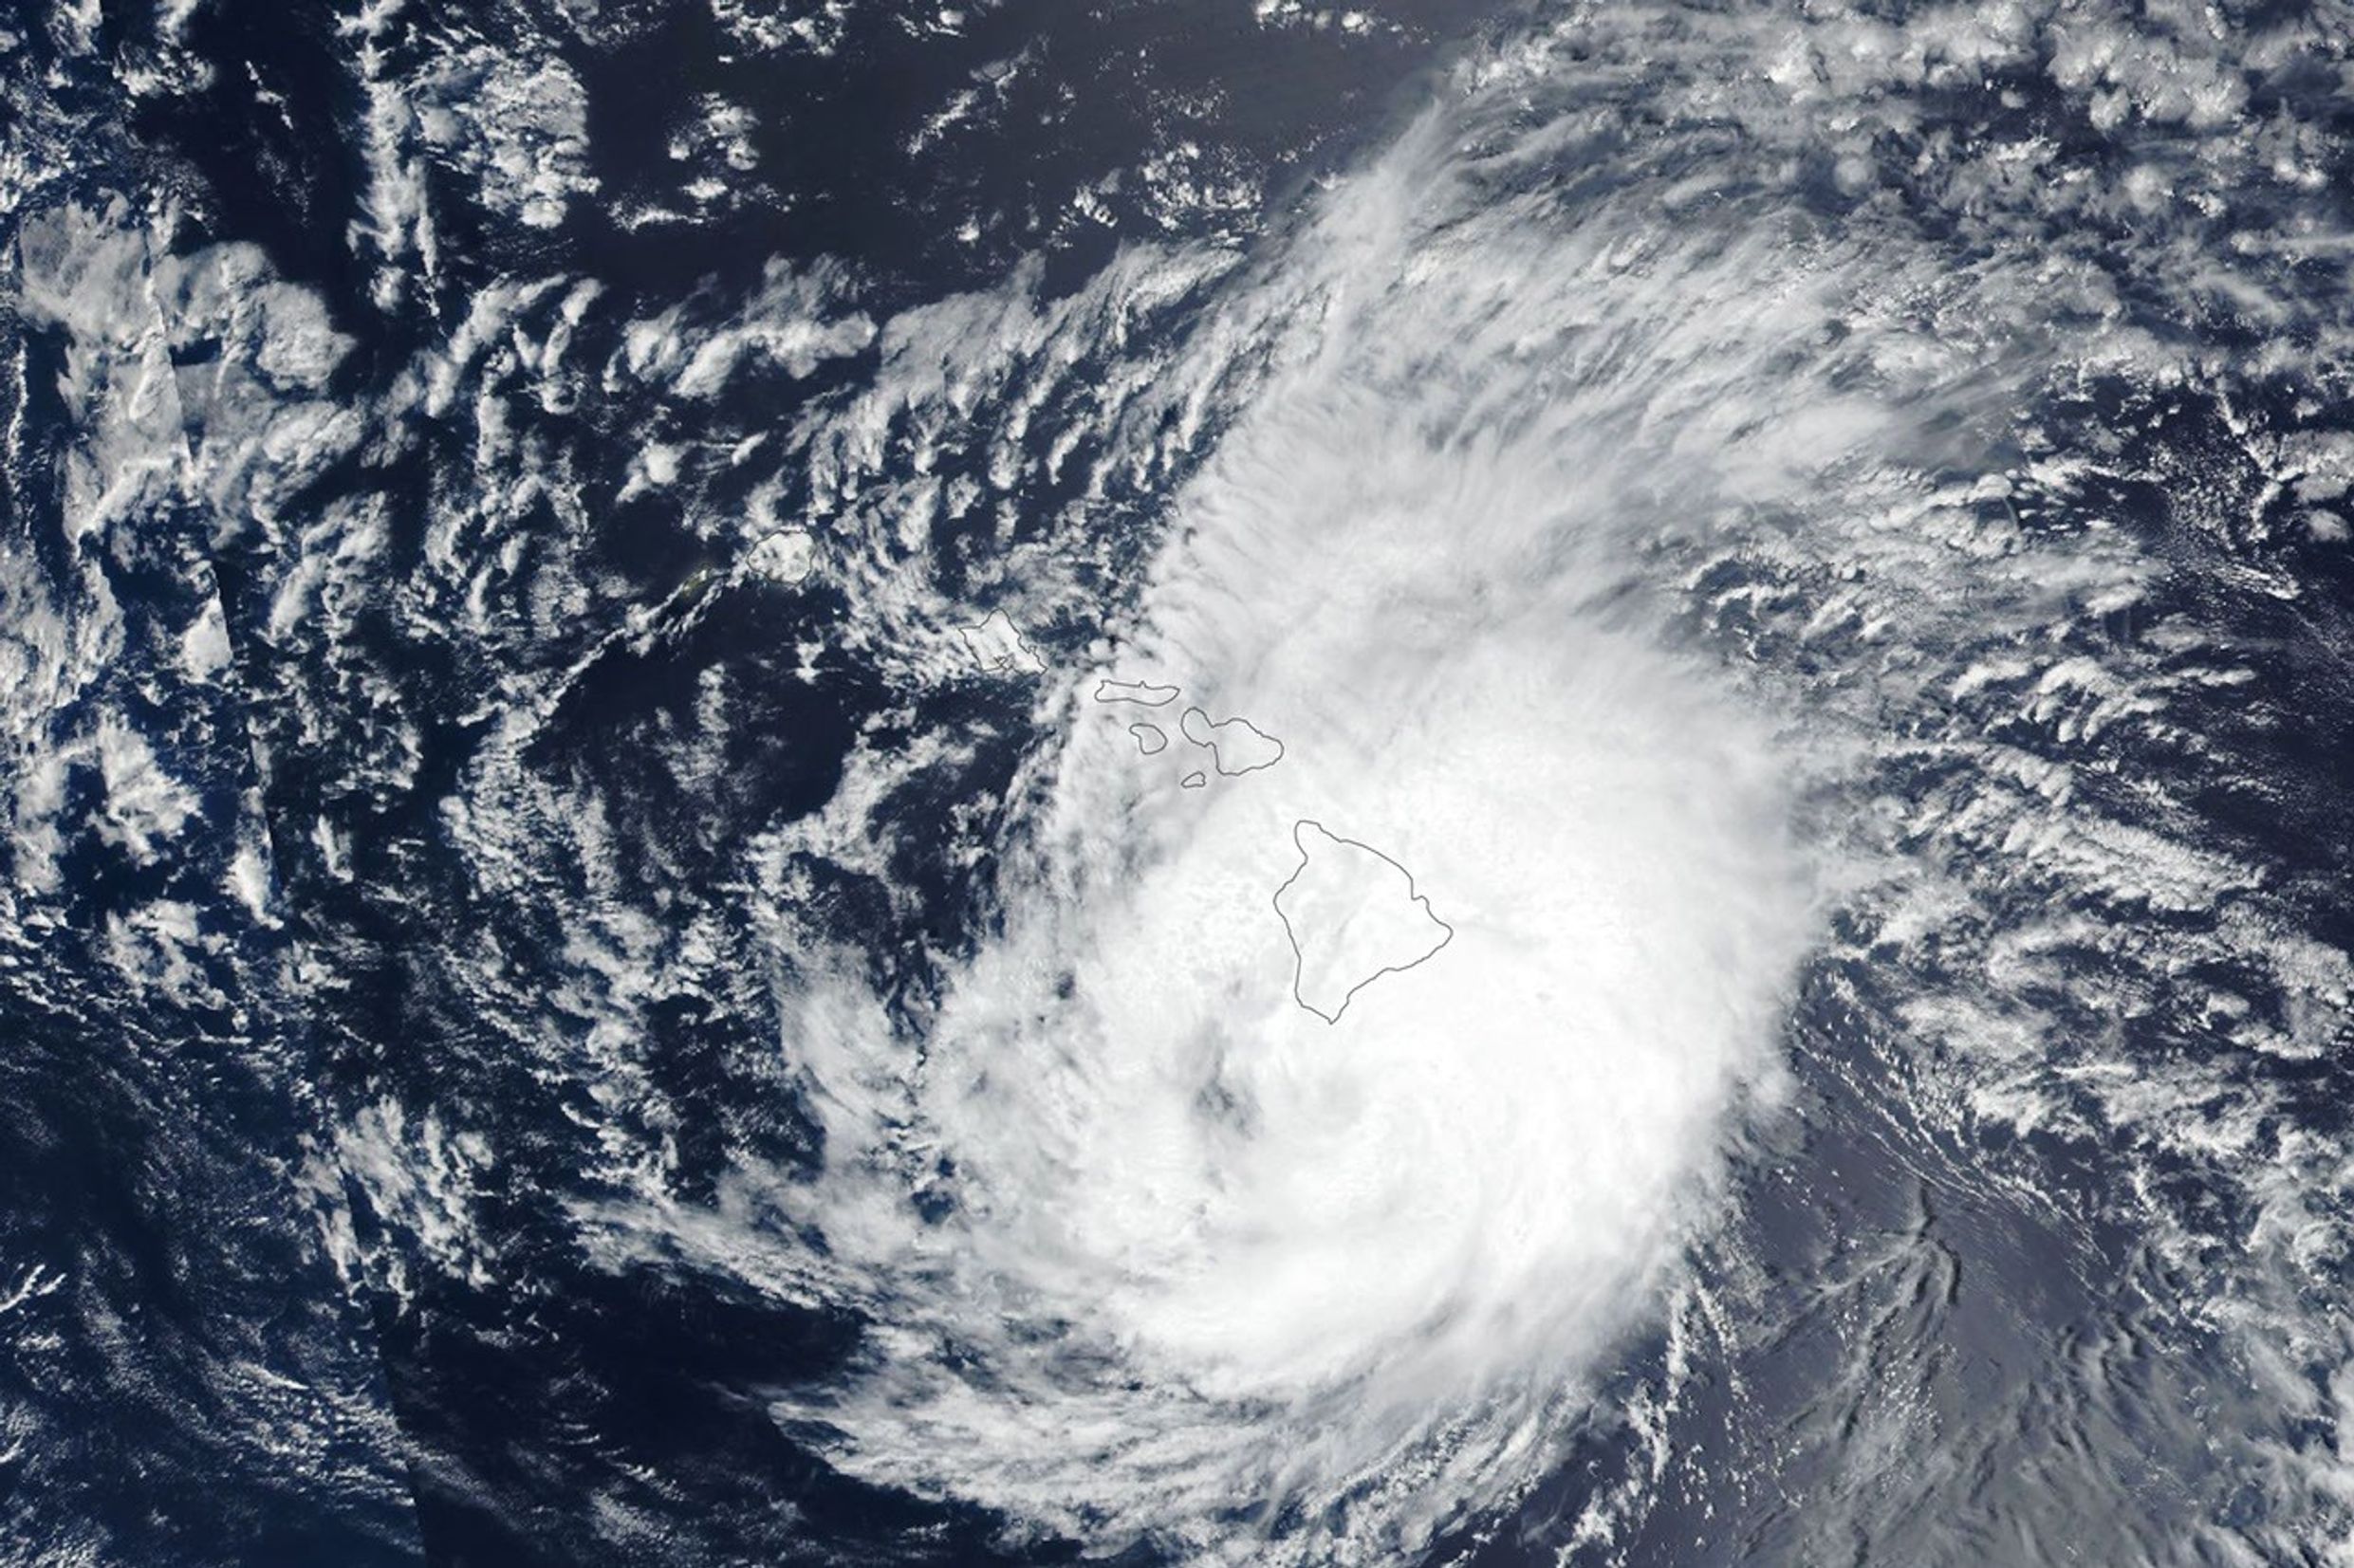
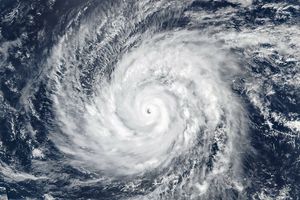
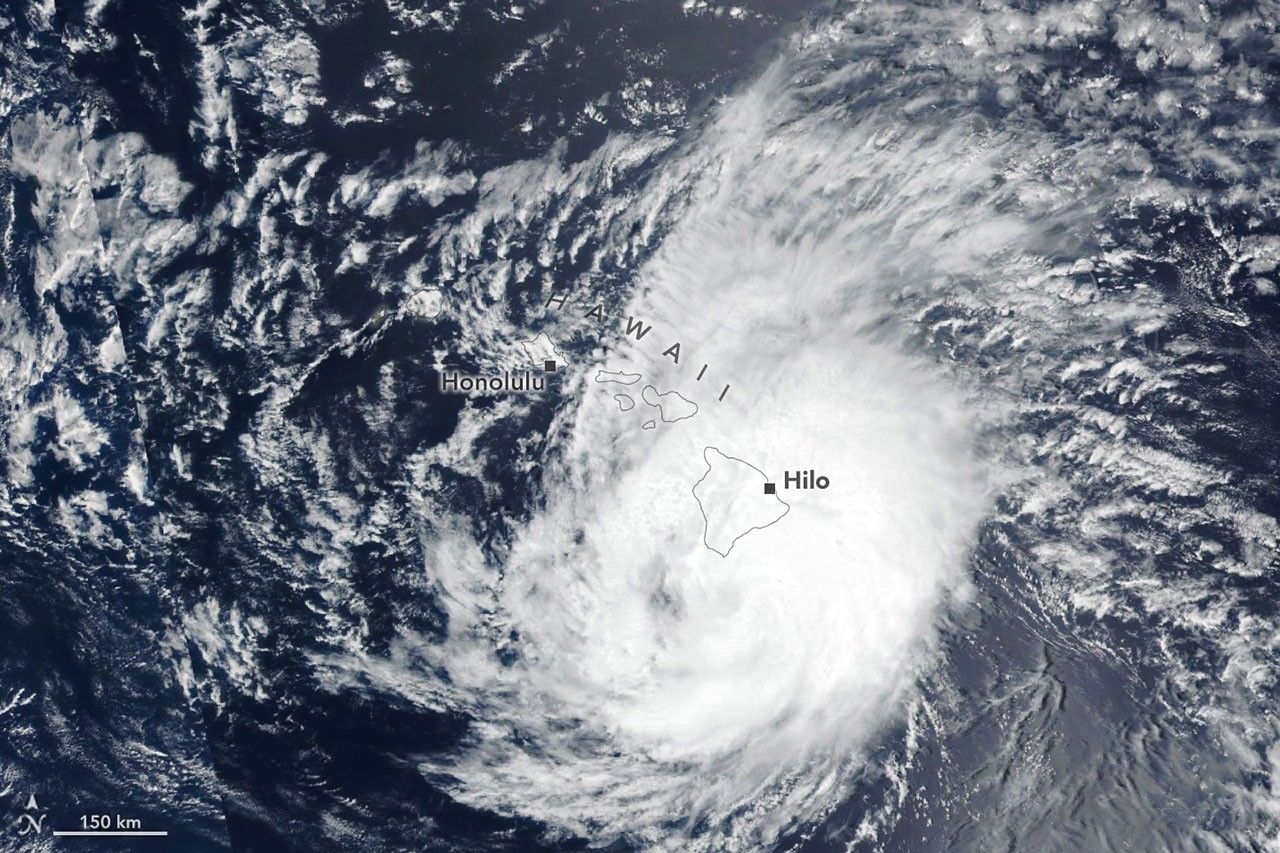
The spiraling clouds of a hurricane appear near the Hawaiian Islands. Its eye is just south of the Island of Hawaiʻi.
NASA Earth Observatory / Lauren Dauphin

The spiraling clouds of a tropical storm are centered near the Hawaiian island of Kauaʻi.
NASA Earth Observatory / Lauren Dauphin

The spiraling clouds of a hurricane appear near the Hawaiian Islands. Its eye is just south of the Island of Hawaiʻi.
NASA Earth Observatory / Lauren Dauphin


August 16, 2026

August 15, 2026


Lala skirts south of the Island of Hawaiʻi as a category 1 hurricane in the right image, acquired by the VIIRS (Visible Infrared Imaging Radiometer Suite) on the Suomi NPP satellite on August 15, 2026, at about 1:45 p.m. Hawaii Standard Time (23:45 Universal Time). The storm decreased in intensity while tracking northwest and was a tropical storm when the VIIRS on the NOAA-20 satellite captured the left image about 24 hours later. NASA Earth Observatory images by Lauren Dauphin.

The Island of Hawaiʻi narrowly avoided a direct landfall by Hurricane Lala in mid-August 2026. The storm nonetheless delivered serious damage as it passed just south of the island on August 15 (above, right) as a category 1 storm on the Saffir-Simpson wind scale.

Lala brought rainfall totals exceeding 20 inches (50 centimeters) to parts of the island, causing flash flooding and ongoing mudflow risks. The highest rainfall total for the storm—43.55 inches (110.6 centimeters) as of the morning of August 17—was recorded at Laupāhoehoe, on the coast northwest of Hilo. Lala downed trees, damaged bridges, and knocked homes off their foundations. Coastal areas were pummeled by large waves, while the summit of Mauna Kea, over 13,000 feet (4,000 meters) above sea level, experienced blizzard conditions.

By early afternoon on August 16, when the other image (left) was acquired, the storm had tracked northwest, roughly parallel to the island chain, and was southwest of Kauaʻi. Lala had decreased in intensity to a tropical storm, with sustained winds of 65 miles (105 kilometers) per hour, according to the National Hurricane Center.

While the Island of Hawaiʻi took the brunt of the storm, other islands also saw destructive effects. Strong winds caused widespread power outages, with more than 220,000 customers statewide without power as of the afternoon of August 16, according to news reports. Across the islands, wind and rain damaged infrastructure, and floodwaters and debris rendered roads impassable.

It has been an active tropical cyclone season in the Eastern Pacific so far in 2026, meteorologists note, consistent with what scientists expect during an El Niño, which has been underway as of mid-June. Warm water in the equatorial Pacific—the hallmark of El Niño—and the moisture and energy it transfers to the atmosphere help fuel nascent tropical storms. Lack of wind shear, another typical El Niño pattern in this region, also encourages tropical storms to develop and strengthen. The Atlantic hurricane season, in contrast, has been relatively calm, as greater wind shear over the Atlantic Ocean and Caribbean Sea during an El Niño inhibits hurricane formation by dissipating the upward motion of heat.

NASA Earth Observatory images by Lauren Dauphin, using VIIRS data from NASA EOSDIS LANCEGIBS/Worldview, and the Joint Polar Satellite System (JPSS). Story by Lindsey Doermann.

References & Resources

You may also be interested in:

Stay up-to-date with the latest content from NASA as we explore the universe and discover more about our home planet.

Tropical Storm Arthur

2 min read

The first named storm of the 2026 Atlantic hurricane season brought intense rainfall and the threat of flash flooding to…

Article

Typhoon Jangmi

2 min read

The sprawling storm promised to deliver torrential rain across a wide swath of southern Japan.

Article

Super Typhoon Sinlaku

3 min read

The violent storm aimed at the U.S. Northern Mariana Islands and Guam in mid-April 2026.

Article

Source: science.nasa.gov

Copernicus Trajectory Design and Optimization System

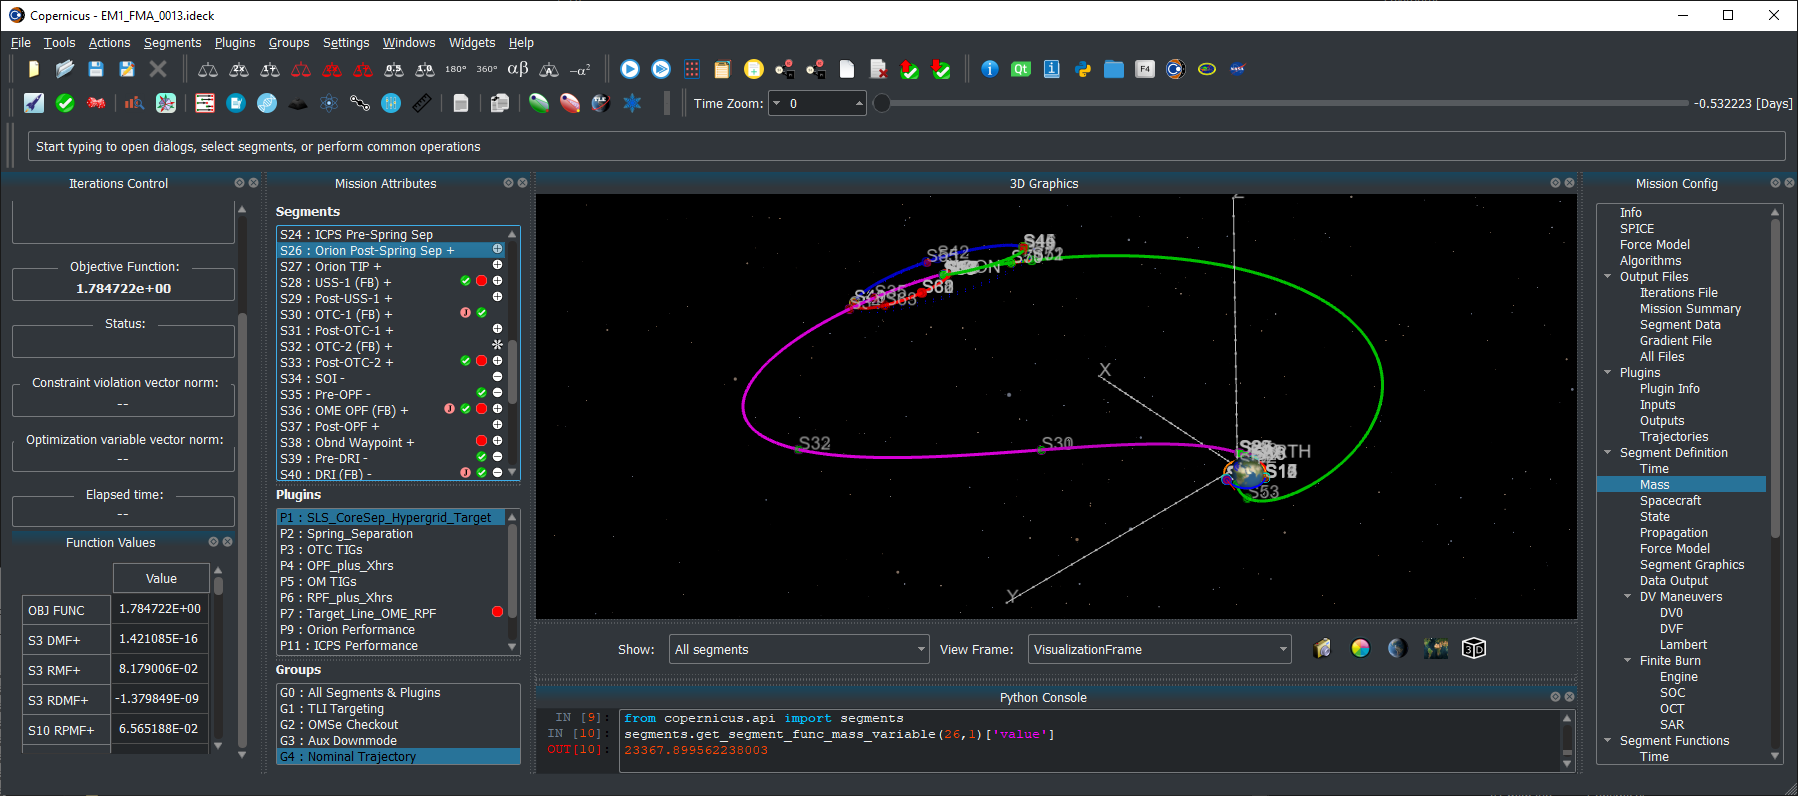
Screenshot of Copernicus with the Artemis I trajectory
NASA/JSC

Copernicus, a generalized spacecraft trajectory design and optimization system, is capable of solving a wide range of trajectory problems such as planet or moon centered trajectories, libration point trajectories, planet-moon transfers and tours, and all types of interplanetary and asteroid/comet missions.

Latest News

  • August 21, 2026: Copernicus Version 5.4.2 is now available. This is a bugfix release.
  • May 26, 2026: Copernicus Version 5.4.1 is now available. This is a bugfix release with a few new features.
  • March 23, 2026: Copernicus Version 5.4 is now available. This update includes numerous new features, enhancements, and bug fixes. This is also the first release with native support for Macs with Apple Silicon processors. Other updates include: New altitude and eclipse ramping/buffer engine model options; New propagation model to simulate a finite burn segment with a series of Kepler arcs & impulses; New circular restricted three-body problem (CR3BP) parameterization and propagation mode; New shadowing/eclipse model upgrades; New two-body rotating frame definition options; Many new GUI enhancements, usability upgrades, & improvements; Many enhancements and upgrades to the Copernicus Python API.
  • August 13, 2024: Copernicus Version 5.3.2 is now available.
  • December 18, 2023: Copernicus Version 5.3.1 is now available. This is a bugfix release.
  • November 15, 2023: Copernicus Version 5.3 is now available. This update includes many bug fixes and various new features and refinements. Including: a new Copernicus mission file format, updates to kernels, a significant expansion of the beta Python API, and various new integration methods. In addition, we have upgraded to Python 3.10, and all dependencies are now obtained via conda.
  • January 21, 2022: Copernicus Version 5.2 is now available. This update includes many bug fixes and various new features and refinements.
  • June 17, 2021: Copernicus was selected as winner of the 2021 NASA Software of the Year Award.
  • March 4, 2021: Copernicus Version 5.1 is now available. This update includes many bug fixes and various new features and refinements.
  • June 26, 2020: Copernicus Version 5.0 is now available. This is a significant update to Copernicus and includes: A new modern Python-based GUI that is now cross-platform and fully functional on Windows, Linux, and macOS, 3D graphics upgrades including antialiasing and celestial body shadowing, a new Python scripting interface, many other new features and options, and bug fixes.
  • May 1, 2018: Copernicus Version 4.6 is now available. The release includes the following changes: a new cross-platform JSON kernel file format, various new reference frame features, including new capabilities for user-defined reference frame plugins, and numerous bug fixes and other minor enhancements.
  • January 24, 2018: Copernicus Version 4.5 is now available. The new version includes a new experimental Mac version, faster exporting of segment data output files (including the addition of a new binary HDF5 format), some new GUI tools, new plugin capabilities, and numerous other new features and bug fixes.
  • October 1, 2016: Copernicus Version 4.4 is now available. The new version includes 3D graphics improvements and various other new features and bug fixes.
  • February 8, 2016: Copernicus Version 4.3 is now available. The new version includes updates to the plugin interface, a new differential corrector solution method, updated SPICE SPK files, updates to the Python interface, new training videos, as well as numerous other refinements and bug fixes.
  • July 21, 2015: Copernicus Version 4.2 is now available.  The update includes further refinements to the new plugin feature, as well as various other new features and some bug fixes.
  • April 13, 2015: Copernicus Version 4.1 is now available.  This update includes a new plugin architecture to enable extending Copernicus with user-created algorithms.  It also includes a new Python interface, as well as various other new features and bug fixes.
  • August 13, 2014: Copernicus Version 4.0 is now available.  This is an update to version 3.1, which was released in June 2012.  The new release includes many new features, bug fixes, performance and stability improvements, as well as a redesigned GUI, a new user guide, and full compatibility with Windows 7.  The update is recommended for all Copernicus users.

Development

The Copernicus Project started at the University of Texas at Austin in August 2001. In June 2002, a grant from the NASA Johnson Space Center (JSC) was used to develop the first prototype which was completed in August 2004. In the interim, support was also received from NASA’s In Space Propulsion Program and from the Flight Dynamics Vehicle Branch of Goddard Spaceflight Center. The first operational version was completed in March 2006 (v1.0). The initial development team consisted of Dr. Cesar Ocampo and graduate students at the University of Texas at Austin Department of Aerospace Engineering and Engineering Mechanics. Since March 2007, primary development of Copernicus has been at the Flight Mechanics and Trajectory Design Branch of JSC.

Request Copernicus

The National Aeronautics and Space Act of 1958 and a series of subsequent legislation recognized transfer of federally owned or originated technology to be a national priority and the mission of each Federal agency. The legislation specifically mandates that each Federal agency have a formal technology transfer program, and take an active role in transferring technology to the private sector and state and local governments for the purposes of commercial and other application of the technology for the national benefit. In accordance with NASA’s obligations under mandating legislation, JSC makes Copernicus available free of charge to other NASA centers, government contractors, and universities, under the terms of a US government purpose license.  Organizations interested in obtaining Copernicus should click here to request it.

Current Version

The current version of Copernicus is 5.4.1 (released May 26, 2026).

References

Publications about Copernicus

  • C. A. Ocampo, “An Architecture for a Generalized Trajectory Design and Optimization System”, Proceedings of the International Conference on Libration Points and Missions, June, 2002.
  • C. A. Ocampo, “Finite Burn Maneuver Modeling for a Generalized Spacecraft Trajectory Design and Optimization System”, Annals of the New York Academy of Science, May 2004.
  • C. A. Ocampo, J. Senent, “The Design and Development of Copernicus: A Comprehensive Trajectory Design and Optimization System”, Proceedings of the International Astronautical Congress, 2006. IAC-06-C1.4.04.
  • R. Mathur, C. A. Ocampo, “An Architecture for Incorporating Interactive Visualizations into Scientific Simulations”, Advances in the Astronautical Sciences, Feb. 2007.
  • C. A. Ocampo, J. S. Senent, J. Williams, “Theoretical Foundation of Copernicus: A Unified System for Trajectory Design and Optimization”, 4th International Conference on Astrodynamics Tools and Techniques, May 2010.
  • J. Williams, J. S. Senent, C. A. Ocampo, R. Mathur, “Overview and Software Architecture of the Copernicus Trajectory Design and Optimization System”, 4th International Conference on Astrodynamics Tools and Techniques, May 2010.
  • J. Williams, J. S. Senent, D. E. Lee, “Recent Improvements to the Copernicus Trajectory Design and Optimization System”, Advances in the Astronautical Sciences, 2012.
  • J. Williams, “A New Architecture for Extending the Capabilities of the Copernicus Trajectory Optimization Program”, Advances in the Astronautical Sciences, 2015, volume 156.
  • J. Williams, R. D. Falck, and I. B. Beekman. “Application of Modern Fortran to Spacecraft Trajectory Design and Optimization“, 2018 Space Flight Mechanics Meeting, AIAA SciTech Forum, (AIAA 2018-1451)
  • J. Williams, A. H. Kamath, R. A. Eckman, G. L. Condon, R. Mathur, and D. Davis, “Copernicus 5.0: Latest Advances in JSC’s Spacecraft Trajectory Optimization and Design System”, 2019 AAS/AIAA Astrodynamics Specialist Conference, Portland, ME, August 11-15, 2019, AAS 19-719
  • J. Williams, J. S. Senent, R. Mathur, and S. M. Stewart, “A History of Copernicus: The Origin, Development, and Evolution of JSC’s Spacecraft Trajectory Design and Optimization System”, AAS/AIAA Astrodynamics Specialist Conference, Boston, MA, August 2025, AAS 25-576.

Some studies that have used Copernicus

  • C. L. Ranieri, C. A. Ocampo, “Optimization of Roundtrip, Time-Constrained, Finite Burn Trajectories via an Indirect Method”, Journal of Guidance, Control, and Dynamics, Vol. 28, No. 2, March-April 2005.
  • T. Polsgrove, L. Kos, R. Hopkins, T. Crane, “Comparison of Performance Predictions for New Low-Thrust Trajectory Tools”, AIAA/AAS Astrodynamics Specialist Conference, August, 2006.
  • L. D. Kos, T. P. Polsgrove, R. C. Hopkins, D. Thomas and J. A. Sims, “Overview of the Development for a Suite of Low-Thrust Trajectory Analysis Tools”, AIAA/AAS Astrodynamics Specialist Conference, August, 2006.
  • M. Garn, M. Qu, J. Chrone, P. Su, C. Karlgaard, “NASA’s Planned Return to the Moon: Global Access and Anytime Return Requirement Implications on the Lunar Orbit Insertion Burns”, AIAA/AAS Astrodynamics Specialist Conference and Exhibit, August, 2008.
  • R. B. Adams, “Near Earth Object (NEO) Mitigation Options Using Exploration Technologies”, Asteroid Deflection Research Symposium, Oct. 2008.
  • J. Gaebler, R. Lugo, E. Axdahl, P. Chai, M. Grimes, M. Long, R. Rowland, A. Wilhite, “Reusable Lunar Transportation Architecture Utilizing Orbital Propellant Depots”, AIAA SPACE 2009 Conference and Exposition, September 2009.
  • J. Williams, E. C. Davis, D. E. Lee, G. L. Condon, T. F. Dawn, “Global Performance Characterization of the Three Burn Trans-Earth Injection Maneuver Sequence over the Lunar Nodal Cycle”, Advances in the Astronautical Sciences, Vol. 135, 2010. AAS 09-380
  • J. Williams, S. M. Stewart, D. E. Lee, E. C. Davis, G. L. Condon, T. F. Dawn, J. Senent, “The Mission Assessment Post Processor (MAPP): A New Tool for Performance Evaluation of Human Lunar Missions”, 20th AAS/AIAA Space Flight Mechanics Meeting, Feb. 2010.
  • J. W. Dankanich, L. M. Burke, J. A. Hemminger, “Mars sample return Orbiter/Earth Return Vehicle technology needs and mission risk assessment”, 2010 IEEE Aerospace Conference, March 2010.
  • A. V. Ilin, L. D. Cassady, T. W. Glover, M. D. Carter, F. R. Chang Diaz, “A Survey of Missions using VASIMR for Flexible Space Exploration”, Ad Astra Rocket Company, Document Number JSC-65825, April 2010.
  • J. W. Dankanich, B. Vondra, A. V. Ilin, “Fast Transits to Mars Using Electric Propulsion”, 46th AIAA/ASME/SAE/ASEE Joint Propulsion Conference & Exhibit, July 2010.
  • S. R. Oleson, M. L. McGuire, L. Burke, J. Fincannon, T. Colozza, J. Fittje, M. Martini, T. Packard, J. Hemminger, J. Gyekenyesi, “Mars Earth Return Vehicle (MERV) Propulsion Options”, 46th AIAA/ASME/SAE/ASEE Joint Propulsion Conference & Exhibit, July 2010, AIAA 2010-6795.
  • J. S. Senent, “Fast Calculation of Abort Return Trajectories for Manned Missions to the Moon”, AIAA/AAS Astrodynamics Specialist Conference, August 2010.
  • D. S. Cooley, K. F. Galal, K. Berry, L. Janes, G. Marr. J. Carrico. C. Ocampo, “Mission Design for the Lunar CRater Observation and Sensing Satellite (LCROSS)”, AIAA/AAS Astrodynamics Specialist Conference, August, 2010.
  • A. V. Ilin, L. D. Cassady, T. W. Glover, F. R. Chang Diaz, “VASIMR Human Mission to Mars”, Space, Propulsion & Energy Sciences International Forum, March 15-17, 2011.
  • J. Brophy, F. Culick, L. Friedman, et al., “Asteroid Retrieval Feasibility Study,” Technical Report, Keck Institute for Space Studies, California Institute of Technology, Jet Propulsion Laboratory, April 2012.
  • A. V. Ilin, “Low Thrust Trajectory Analysis (A Survey of Missions using VASIMR for Flexible Space Exploration – Part 2), Ad Astra Rocket Company, Document Number JSC-66428, June 2012.
  • P. R. Chai, A. W. Wilhite, “Station Keeping for Earth-Moon Lagrangian Point Exploration Architectural Assets”, AIAA SPACE 2012 Conference & Exposition, September, 2012, AIAA 2012-5112.
  • F. R. Chang Diaz, M. D. Carter, T. W. Glover, A. V. Ilin, C. S. Olsen, J. P. Squire, R. J. Litchford, N. Harada, S. L. Koontz, “Fast and Robust Human Missions to Mars with Advanced Nuclear Electric Power and VASIMR Propulsion”, Proceedings of Nuclear and Emerging Technologies for Space, Feb. 2013. Paper 6777.
  • J. Williams, “Trajectory Design for the Asteroid Redirect Crewed Mission”, JSC Engineering, Technology and Science (JETS) Contract Technical Brief JETS-JE23-13-AFGNC-DOC-0014, July, 2013.
  • J.P. Gutkowski, T.F. Dawn, R.M. Jedrey, “Trajectory Design Analysis over the Lunar Nodal Cycle for the Multi-Purpose Crew Vehicle (MPCV) Exploration Mission 2 (EM-2)”, Advances in the Astronautical Sciences Guidance, Navigation and Control, Vol. 151, 2014. AAS 14-096.
  • R. G. Merrill, M. Qu, M. A. Vavrina, C. A. Jones, J. Englander, “Interplanetary Trajectory Design for the Asteroid Robotic Redirect Mission Alternate Approach Trade Study”, AIAA/AAS Astrodynamics Specialist Conference, 2014. AIAA 2014-4457.
  • J. Williams, G. L. Condon. “Contingency Trajectory Planning for the Asteroid Redirect Crewed Mission”, SpaceOps 2014 Conference (AIAA 2014-1697).
  • J. Williams, D. E. Lee, R. J. Whitley, K. A. Bokelmann, D. C. Davis, and C. F. Berry. “Targeting cislunar near rectilinear halo orbits for human space exploration“, AAS 17-267
  • T. F. Dawn, J. Gutkowski, A. Batcha, J. Williams, and S. Pedrotty. “Trajectory Design Considerations for Exploration Mission 1“, 2018 Space Flight Mechanics Meeting, AIAA SciTech Forum, (AIAA 2018-0968)
  • A. L. Batcha, J. Williams, T. F. Dawn, J. P. Gutkowski, M. V. Widner, S. L. Smallwood, B. J. Killeen, E. C. Williams, and R. E. Harpold, “Artemis I Trajectory Design and Optimization”, AAS/AIAA Astrodynamics Specialist Conference, August 9-12, 2020, AAS 20-649

Source: www.nasa.gov
New Next-Gen Dish Adds Muscle to NASA’s Deep Space Network

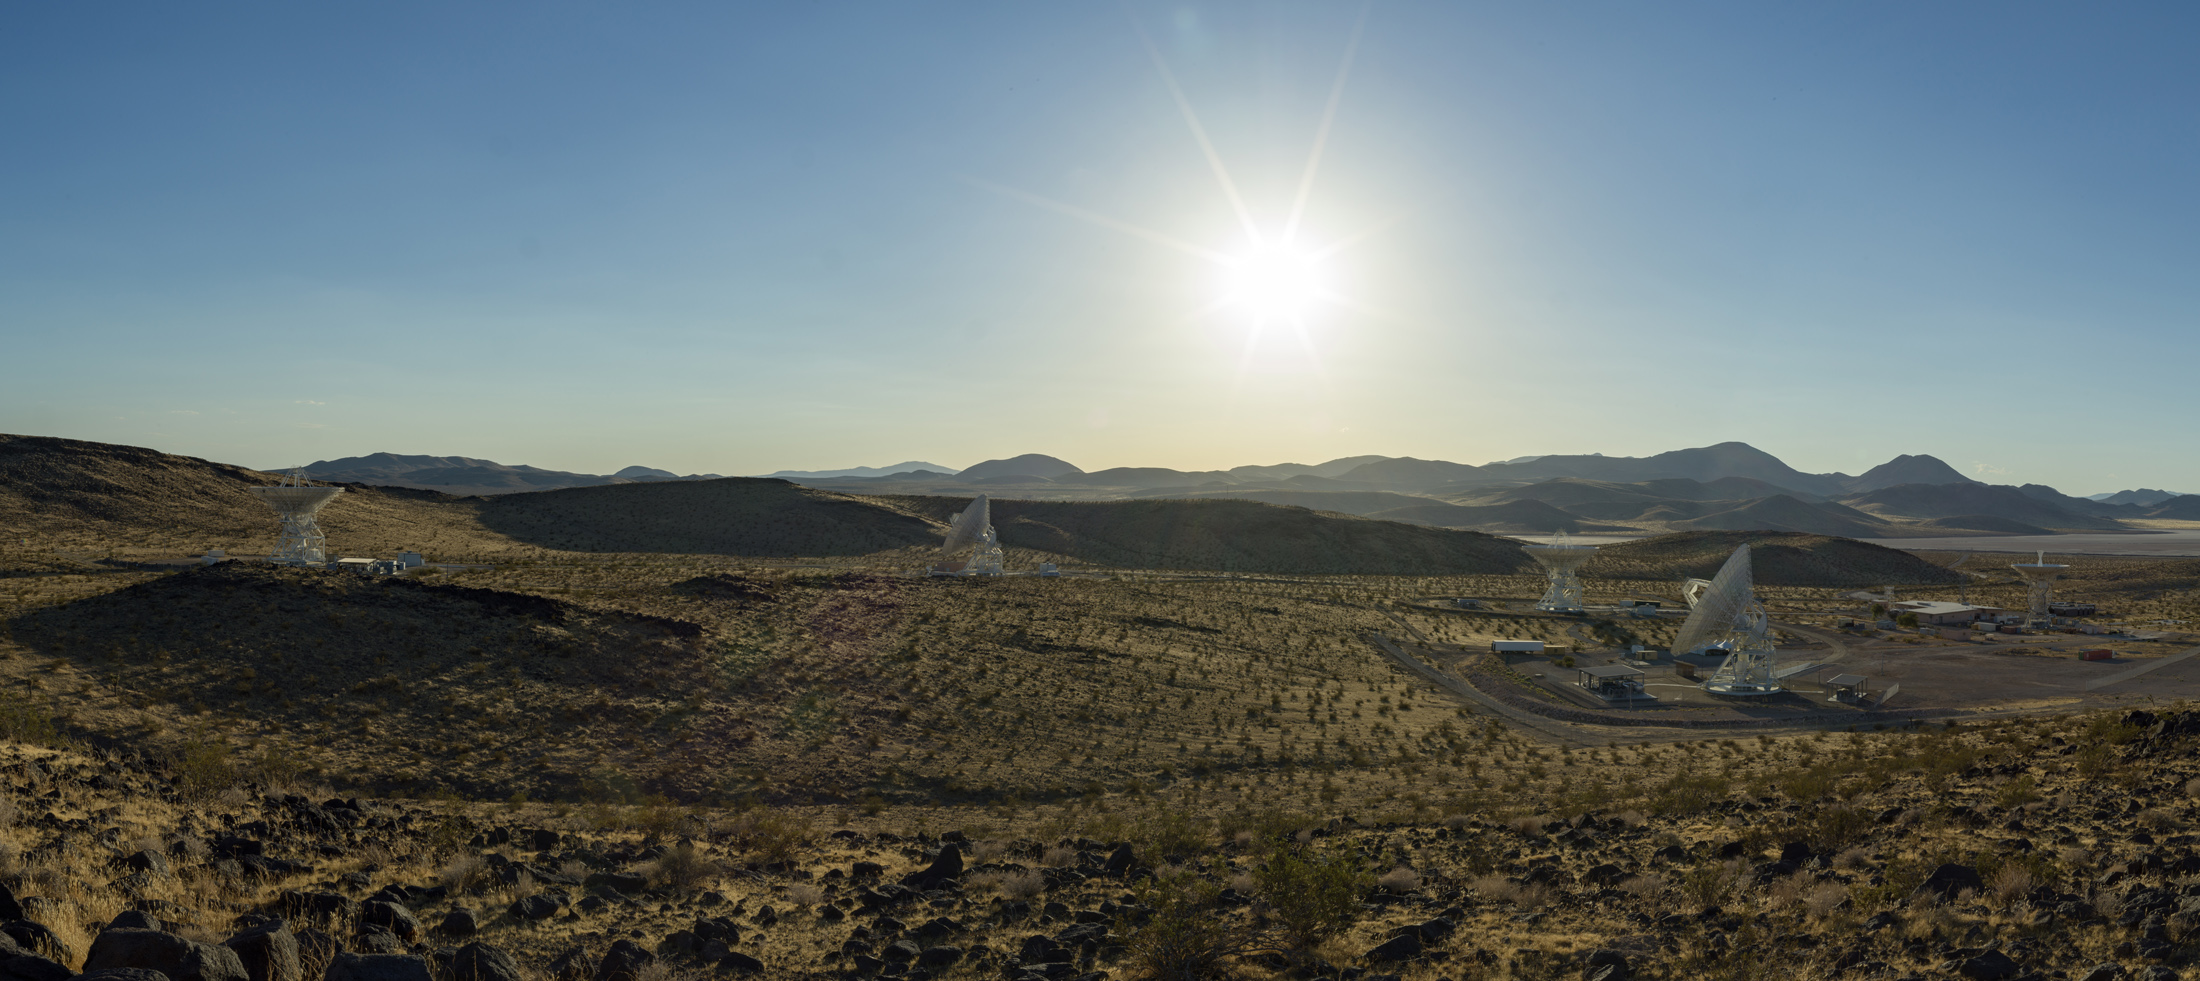
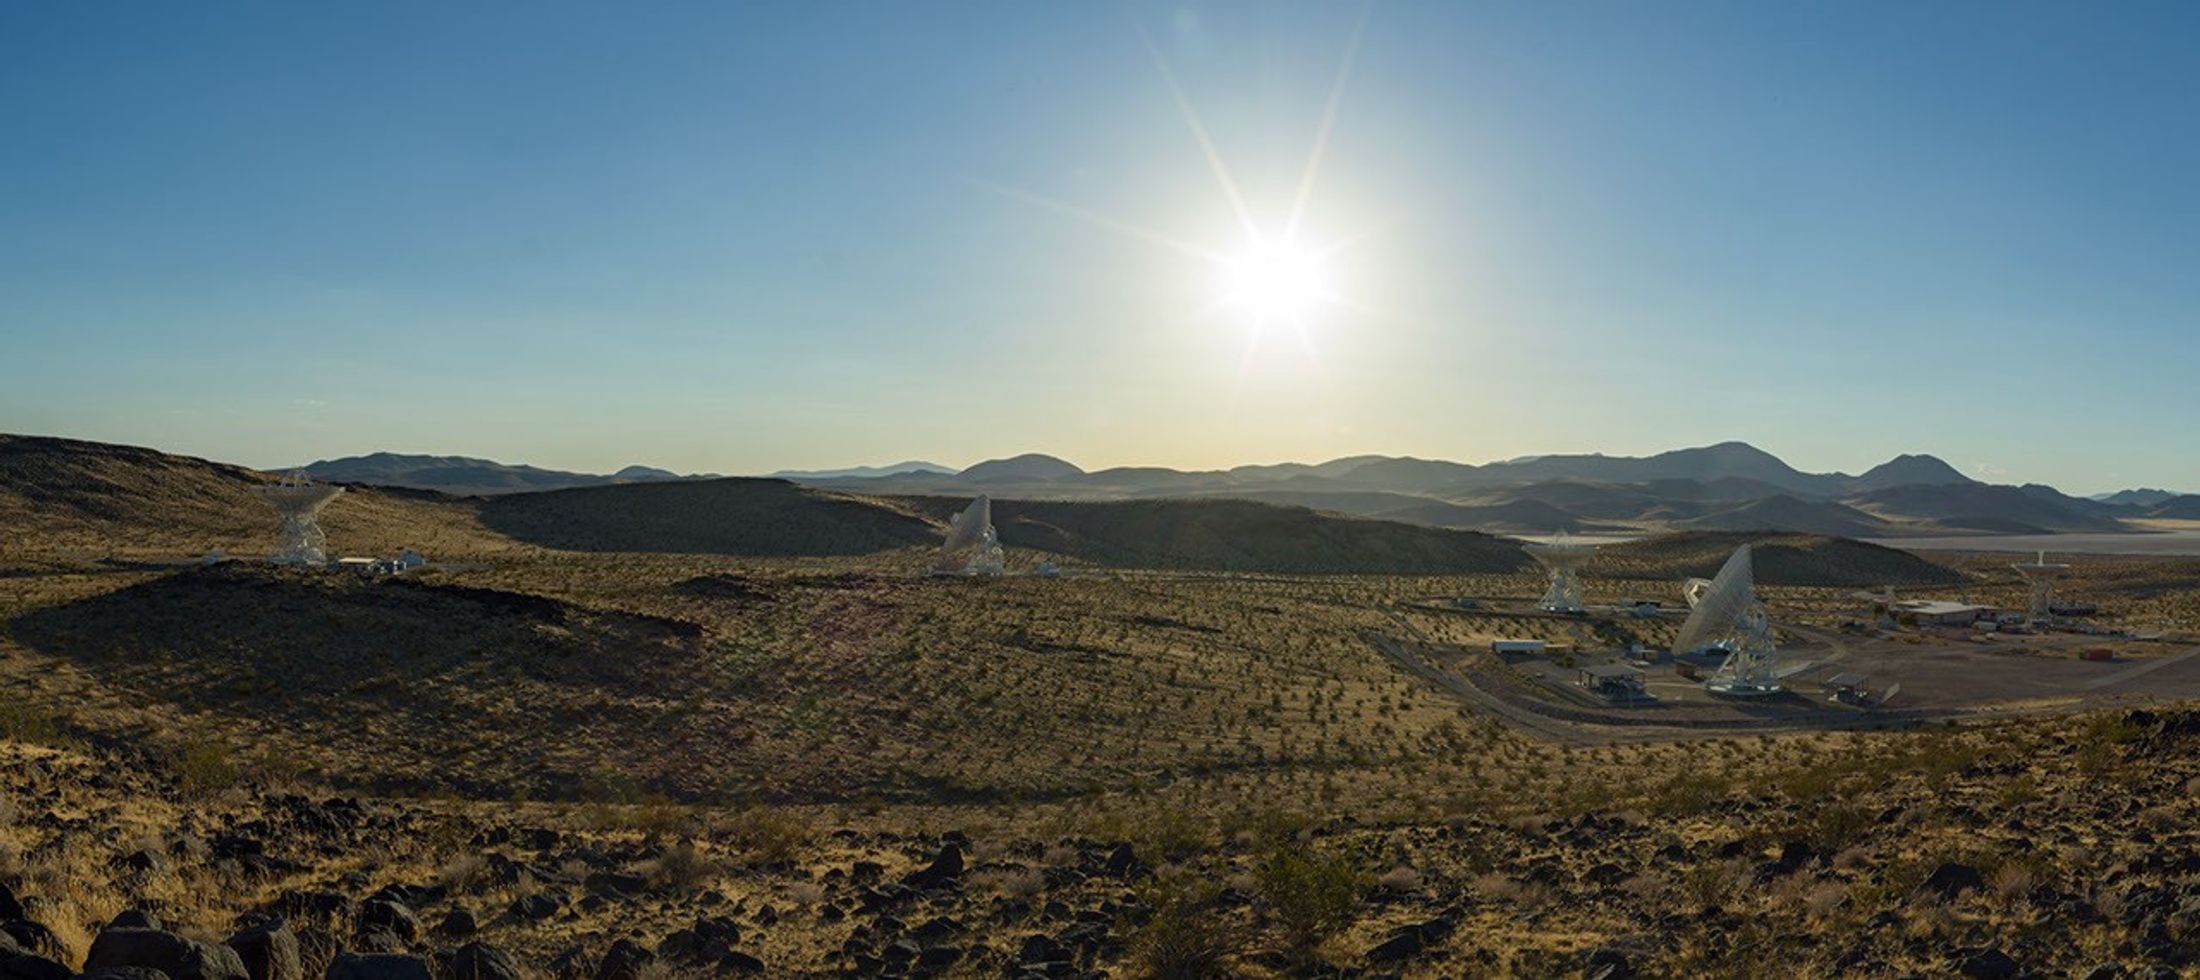
A wide desert landscape featuring several large white satellite dishes pointing toward a bright sun shining in a clear blue sky above distant mountain ranges.
Antennas soak in the summer Sun in August 2026 at the Deep Space Network’s Goldstone complex near Barstow, California, including the recently completed Deep Space Station 23 (shown in the foreground, to the right).
NASA/JPL-Caltech

NASA’s Deep Space Network facility in California is marking the addition of a brand new 34-meter-wide (114-foot-wide) radio frequency antenna to the agency’s deep space communications and navigation system. The network uses giant dish antennas located at three global facilities to support more than 40 spacecraft exploring the solar system and interstellar space.

The new Deep Space Station 23 (DSS-23) is located at the Goldstone Deep Space Communications Complex, near Barstow, and is managed by NASA’s Jet Propulsion Laboratory in Southern California.

NASA leadership and personnel as well as dignitaries gathered at the complete DSS-23 antenna for a ceremonial ribbon cutting. It’s the latest to be added as part of the Deep Space Network’s Aperture Enhancement Project, which began in 2009 to upgrade and expand the network by adding six new 34-meter multifrequency beam-waveguide antennas. These versatile dishes can enhance many missions operating over different radio frequencies.

“By expanding the Deep Space Network, we are strengthening the communications foundation NASA needs for the bold missions ahead — from exploring more of the Moon than ever before to peering deeper into the solar system,” said James Kenyon, associate administrator of the Research and Technology Mission Directorate at NASA Headquarters in Washington. “This new antenna will help us deliver on our national goals for space exploration and push beyond the limits of what once seemed impossible.”

After completing a testing campaign from May through July to demonstrate its capabilities, the new DSS-23 began operations on Aug. 3, tracking NASA’s Chandra X-ray Observatory. Since then, it has been communicating with dozens of missions such as NASA’s Mars Reconnaissance Orbiter, Psyche, Juno, Voyager 1, and other robotic spacecraft in deep space.

“The addition of this next-generation antenna brings us closer to a completely modernized network that embraces advanced technology to ensure NASA’s leadership in deep space communications,” said Dave Gallagher, director of JPL. “After over 60 years of continuous operations supporting consequential missions, these upgrades prime the network for a new era of exploration. The teams that designed, planned, and built DSS-23 should be proud.”

Enhanced capabilities

Construction of DSS-23 began in February 2020. After the 133-ton metal reflector framework was placed and bolted atop the antenna’s pedestal in December 2024, engineers installed the panels to the framework that reflect radio frequency signals transmitted to and received from spacecraft. Then came the careful process of calibrating the antenna so it can work in concert with the rest of the network.

It is the fifth antenna at Goldstone (joining three 34-meter antennas and one 70-meter, or 230-foot, antenna) and the fifth enhancement project antenna to join the network, which includes antennas at the DSN’s Goldstone, Madrid, and Canberra, Australia, complexes. Multifrequency beam waveguide antennas direct signals down to a stable, climate-controlled underground room, rather than housing heavy, sensitive electronic equipment on the moving antenna dish. In addition to offering versatility, this design allows easy access for maintenance and upgrades to the system.

“The biggest challenge wasn’t actually constructing the antenna. It was transforming a complex collection of mechanical, electrical, software, radio frequency, and infrastructure systems into a single, mission-ready asset,” said Germaine Aziz, manager of the Deep Space Network Aperture Enhancement Project at JPL. “Every subsystem must be integrated, calibrated, and verified to operate with extraordinary precision and reliability before it can support NASA’s deep space missions.”

The enhancement project will be complete when a sixth enhancement-project antenna, Deep Space Station 33, comes online at the Canberra facility in 2029, bringing the total number of 34-meter antennas across the network to 13. The 34-meter antennas can be arrayed (combined and operated together) to provide an equivalent communications backup for each facility’s single 70-meter antenna, which, after more than 50 years of near-continuous operation, are getting increasingly costly to maintain and repair.

Managed by Caltech for NASA, JPL manages the agency’s Deep Space Network with the oversight of NASA’s SCaN (Space Communications and Navigation) Program within NASA’s Research and Technology Mission Directorate. More than 100 NASA and non-NASA missions rely on the Deep Space Network and Near Space Network. They include missions that support astronauts aboard the International Space Station and future Artemis missions, monitoring Earth, exploring the Moon, and exploring the solar system and beyond. 

For more information about the Deep Space Network, visit:

https://www.nasa.gov/communicating-with-missions/dsn

Source: www.nasa.gov
Panorama Showcasing the 34-Meter Antennas of the DSN’s Goldstone Complex

2 Min Read

Panorama Showcasing the 34-Meter Antennas of the DSN’s Goldstone Complex

A wide desert landscape featuring several large white satellite dishes pointing toward a bright sun shining in a clear blue sky above distant mountain ranges.

PIA26777

Credits:
NASA/JPL-Caltech

Description

Five antennas soak in the summer sun at the Deep Space Network’s Goldstone complex near Barstow, California, in August 2026. The recently completed Deep Space Station 23, a 34-meter (114-foot) beam-waveguide antenna, can be seen to the right of the frame in the foreground. The other three 34-meter antennas are, from left, DSS-26, DSS-25, and DSS-24. At farthest right is a smaller 26-meter (85-foot) antenna, the retired “Apollo Antenna” that was built in 1967 as part of the Manned Space Flight Network and earned its nickname for providing tracking for the Apollo Program.

NASA leadership and personnel as well as dignitaries gathered at the complete DSS-23 antenna for a ceremonial ribbon-cutting on Aug. 25, 2026. It’s the latest antenna to be added as part of the Deep Space Network’s Aperture Enhancement Project, which began in 2009 to upgrade and expand the network by adding six new 34-meter multifrequency beam-waveguide antennas. These versatile Deep Space Network (DSN) dishes can enhance many missions operating over different radio frequencies. 

The DSN allows missions to track, send commands to, and receive scientific data from faraway spacecraft. It is managed by NASA’s Jet Propulsion Laboratory in Southern California, a division of Caltech, for the agency’s Space Communications and Navigation (SCaN) Program, which is located at NASA Headquarters within the Research and Technology Mission Directorate.

For more information about the DSN, visit:

https://www.nasa.gov/communicating-with-missions/dsn/

Source: science.nasa.gov
NASA Deep Space Network’s New Goldstone Antenna Goes Online

1 Min Read

NASA Deep Space Network’s New Goldstone Antenna Goes Online

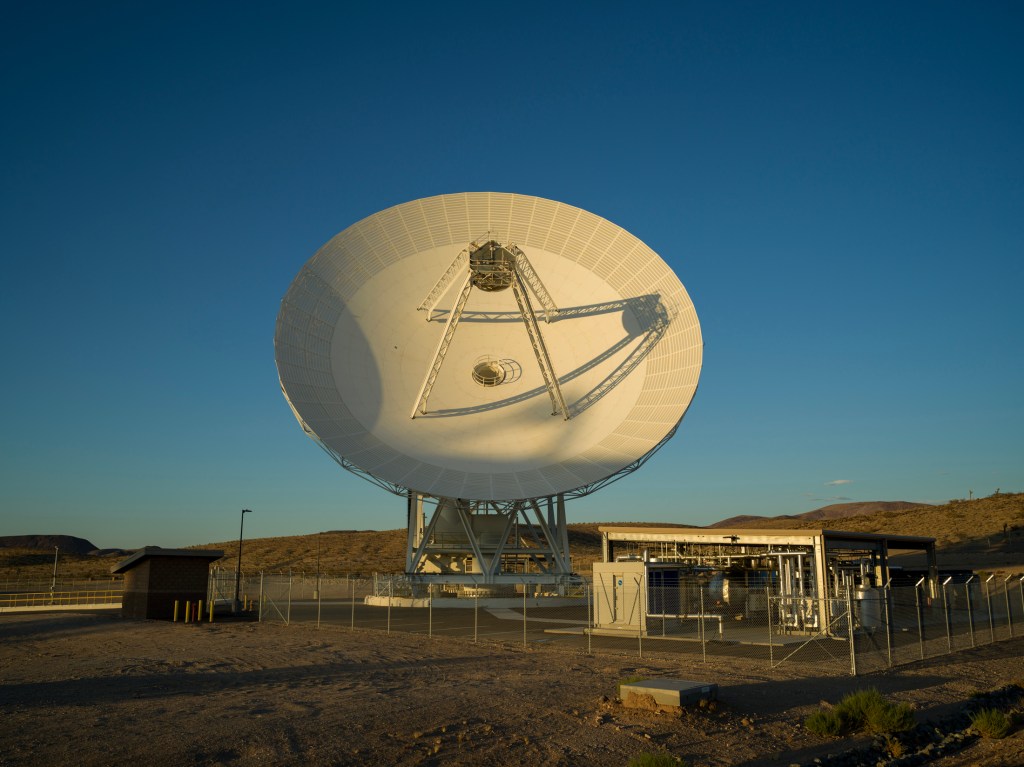
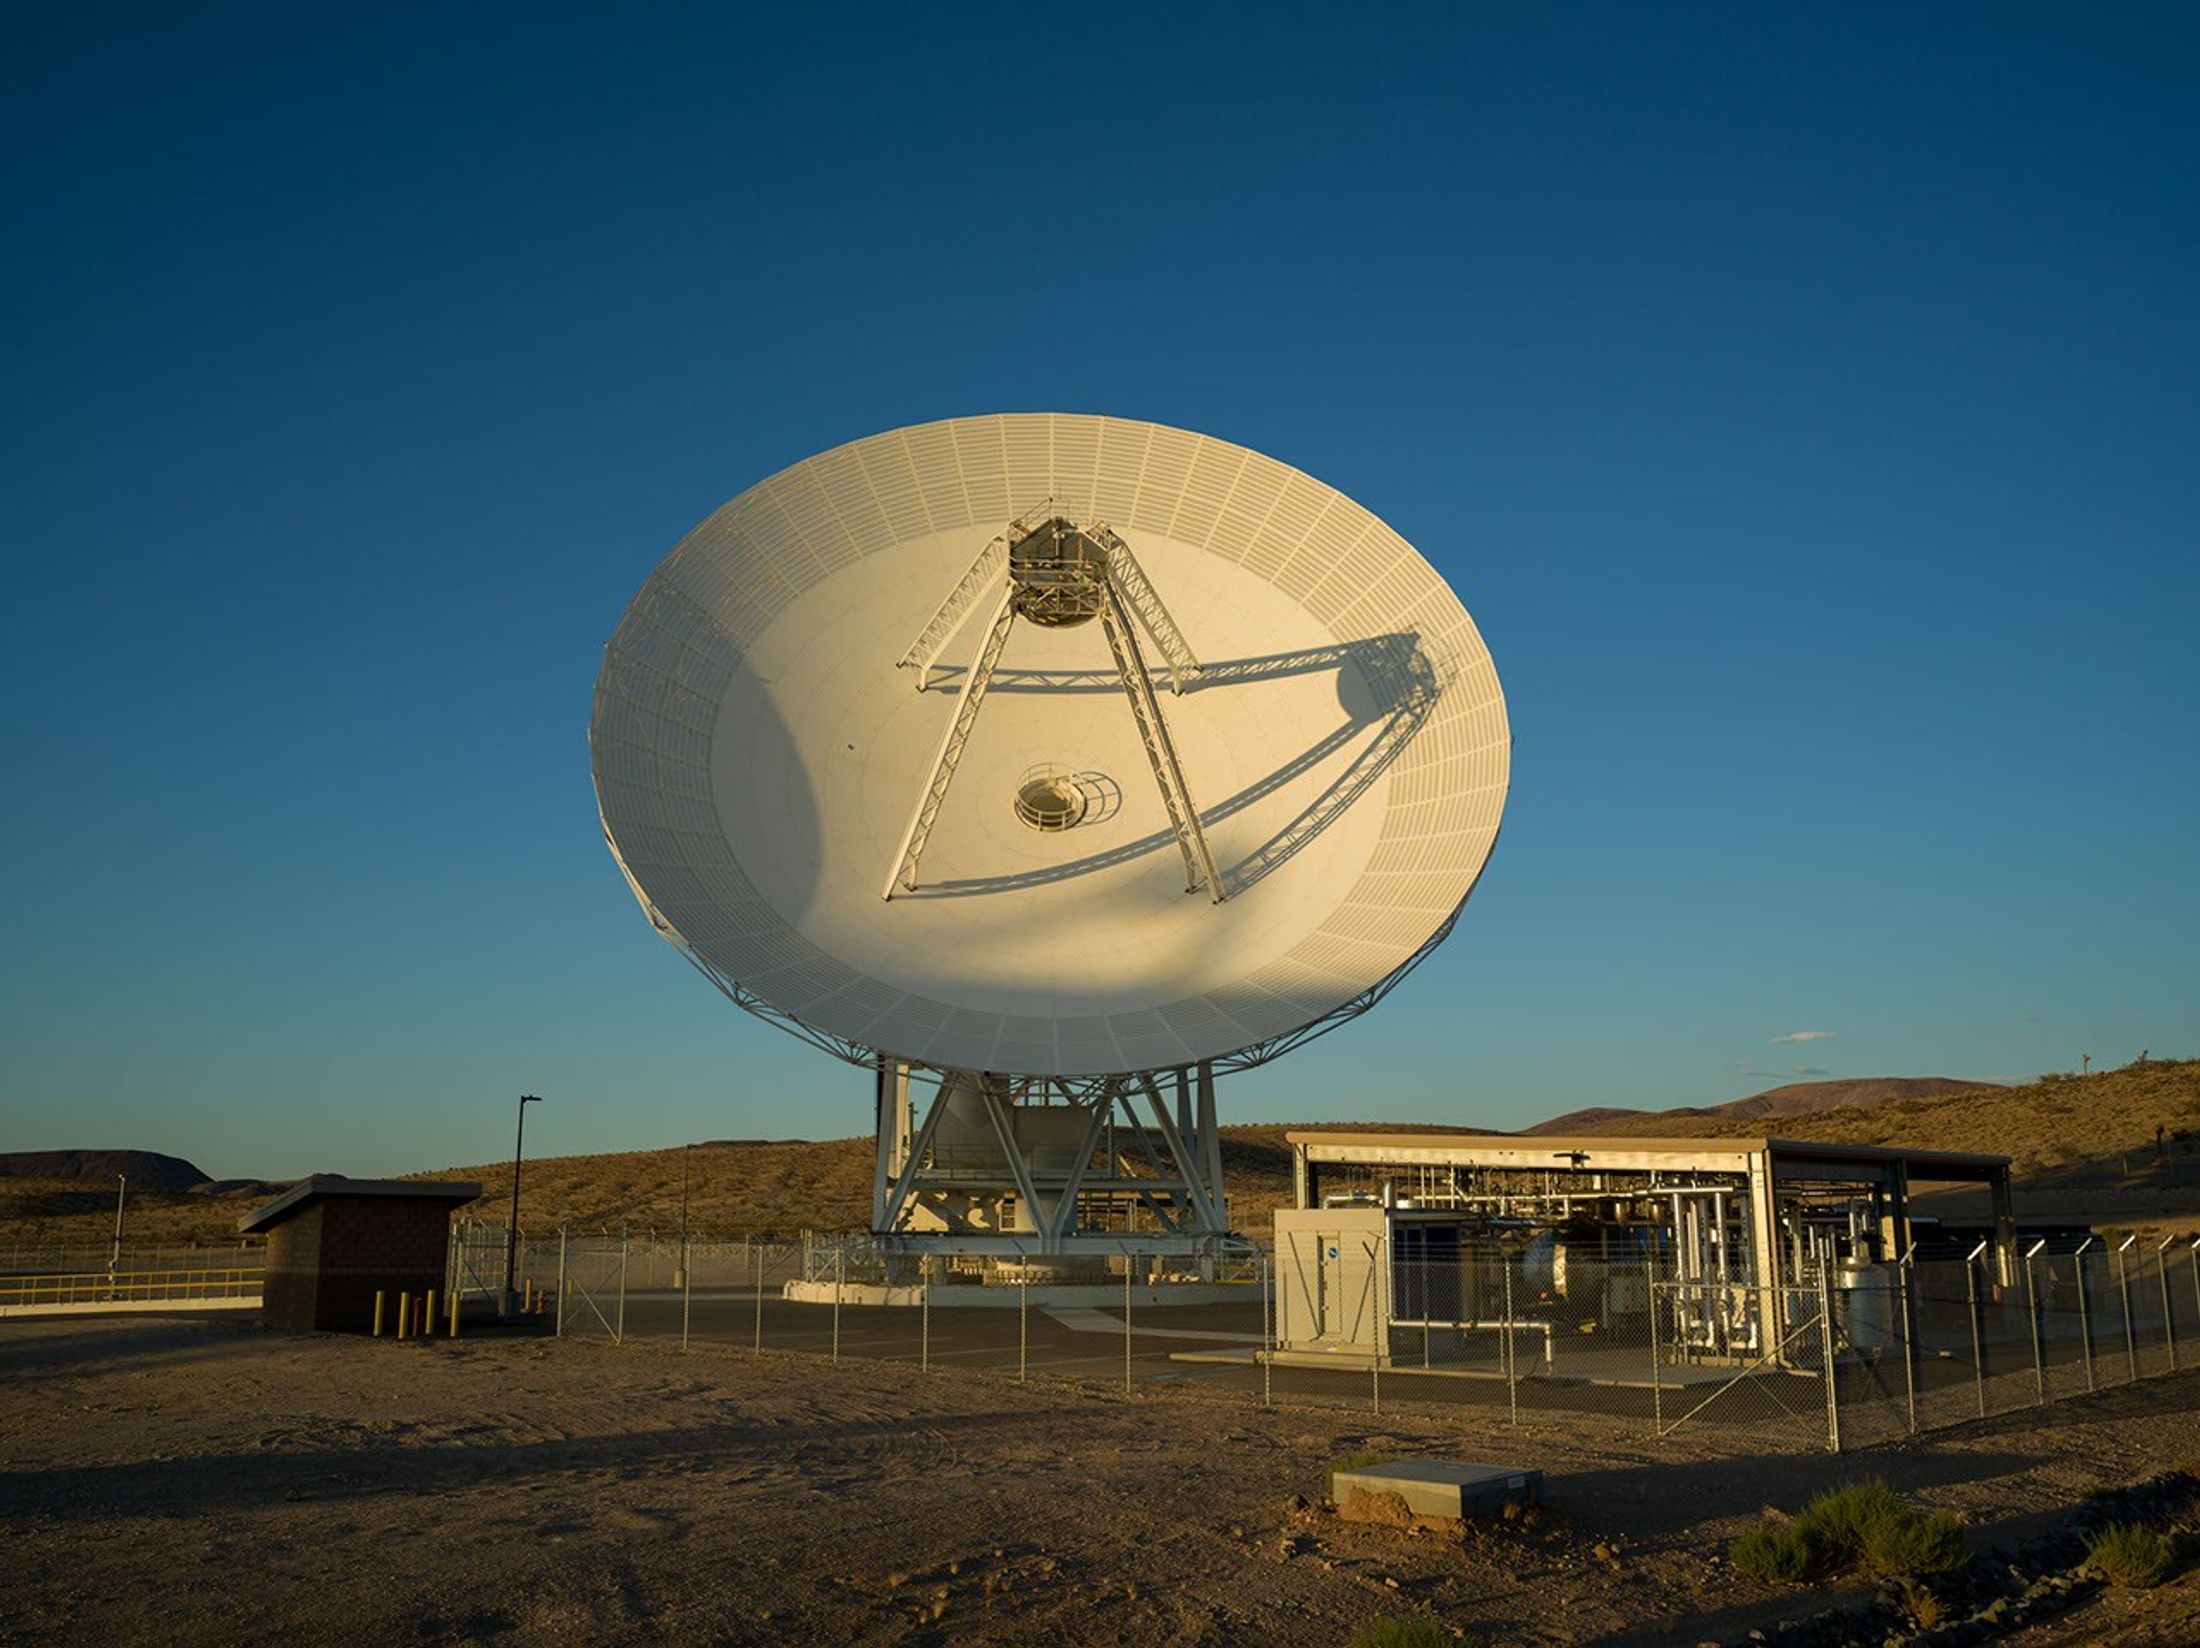
A massive white satellite dish antenna stands on a desert plain under a clear blue sky, bathed in warm sunlight alongside small facility structures.

PIA26778

Credits:
NASA/JPL-Caltech

Description

Long shadows are cast by the recently completed Deep Space Station 23 at the Deep Space Network’s Goldstone complex near Barstow, California, in August 2026. A 34-meter (114-foot) multifrequency beam-waveguide antenna, DSS-23 will boost the DSN’s capacity and enhance NASA’s deep space communications capabilities for decades to come.

NASA leadership and personnel as well as dignitaries gathered at the complete DSS-23 antenna for a ceremonial ribbon cutting on Aug. 25, 2026. It’s the latest antenna to be added as part of the Deep Space Network’s Aperture Enhancement Project, which began in 2009 to upgrade and expand the network by adding six new 34-meter multifrequency beam-waveguide antennas. These versatile Deep Space Network dishes can enhance many missions operating over different radio frequencies. 

The DSN allows missions to track, send commands to, and receive scientific data from faraway spacecraft. It is managed by NASA’s Jet Propulsion Laboratory, a division of Caltech, in Southern California for the agency’s Space Communications and Navigation (SCaN) Program, which is located at NASA Headquarters within the Research and Technology Mission Directorate.

For more information about the DSN, visit:

https://www.nasa.gov/communicating-with-missions/dsn/

Source: science.nasa.gov
Ribbon-Cutting Event for NASA Deep Space Network’s Deep Space Station 23

2 Min Read

Ribbon-Cutting Event for NASA Deep Space Network’s Deep Space Station 23

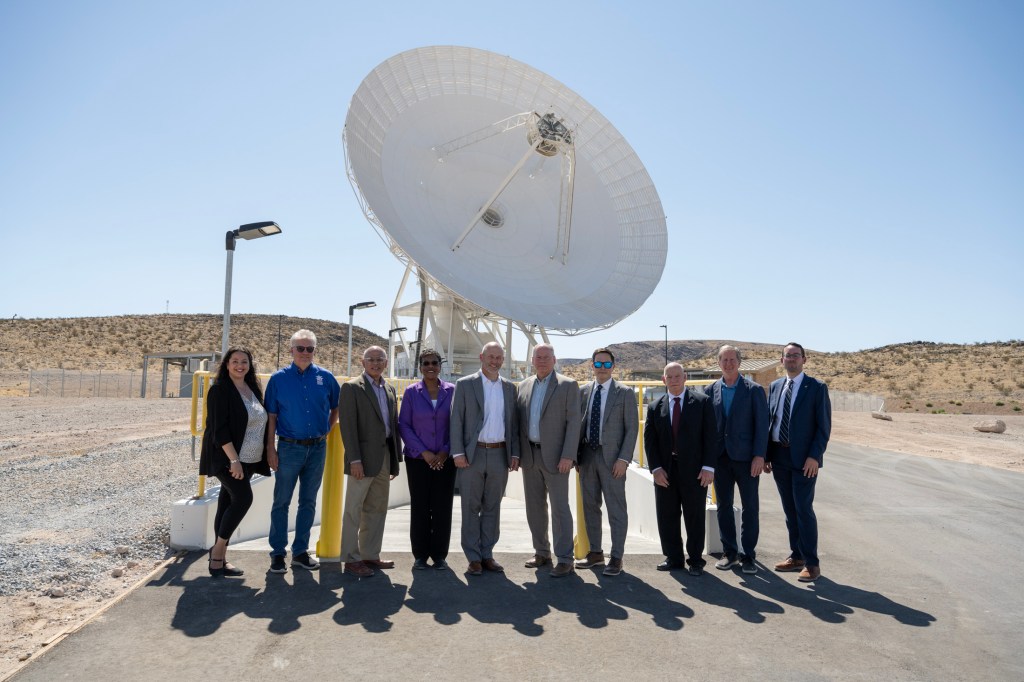
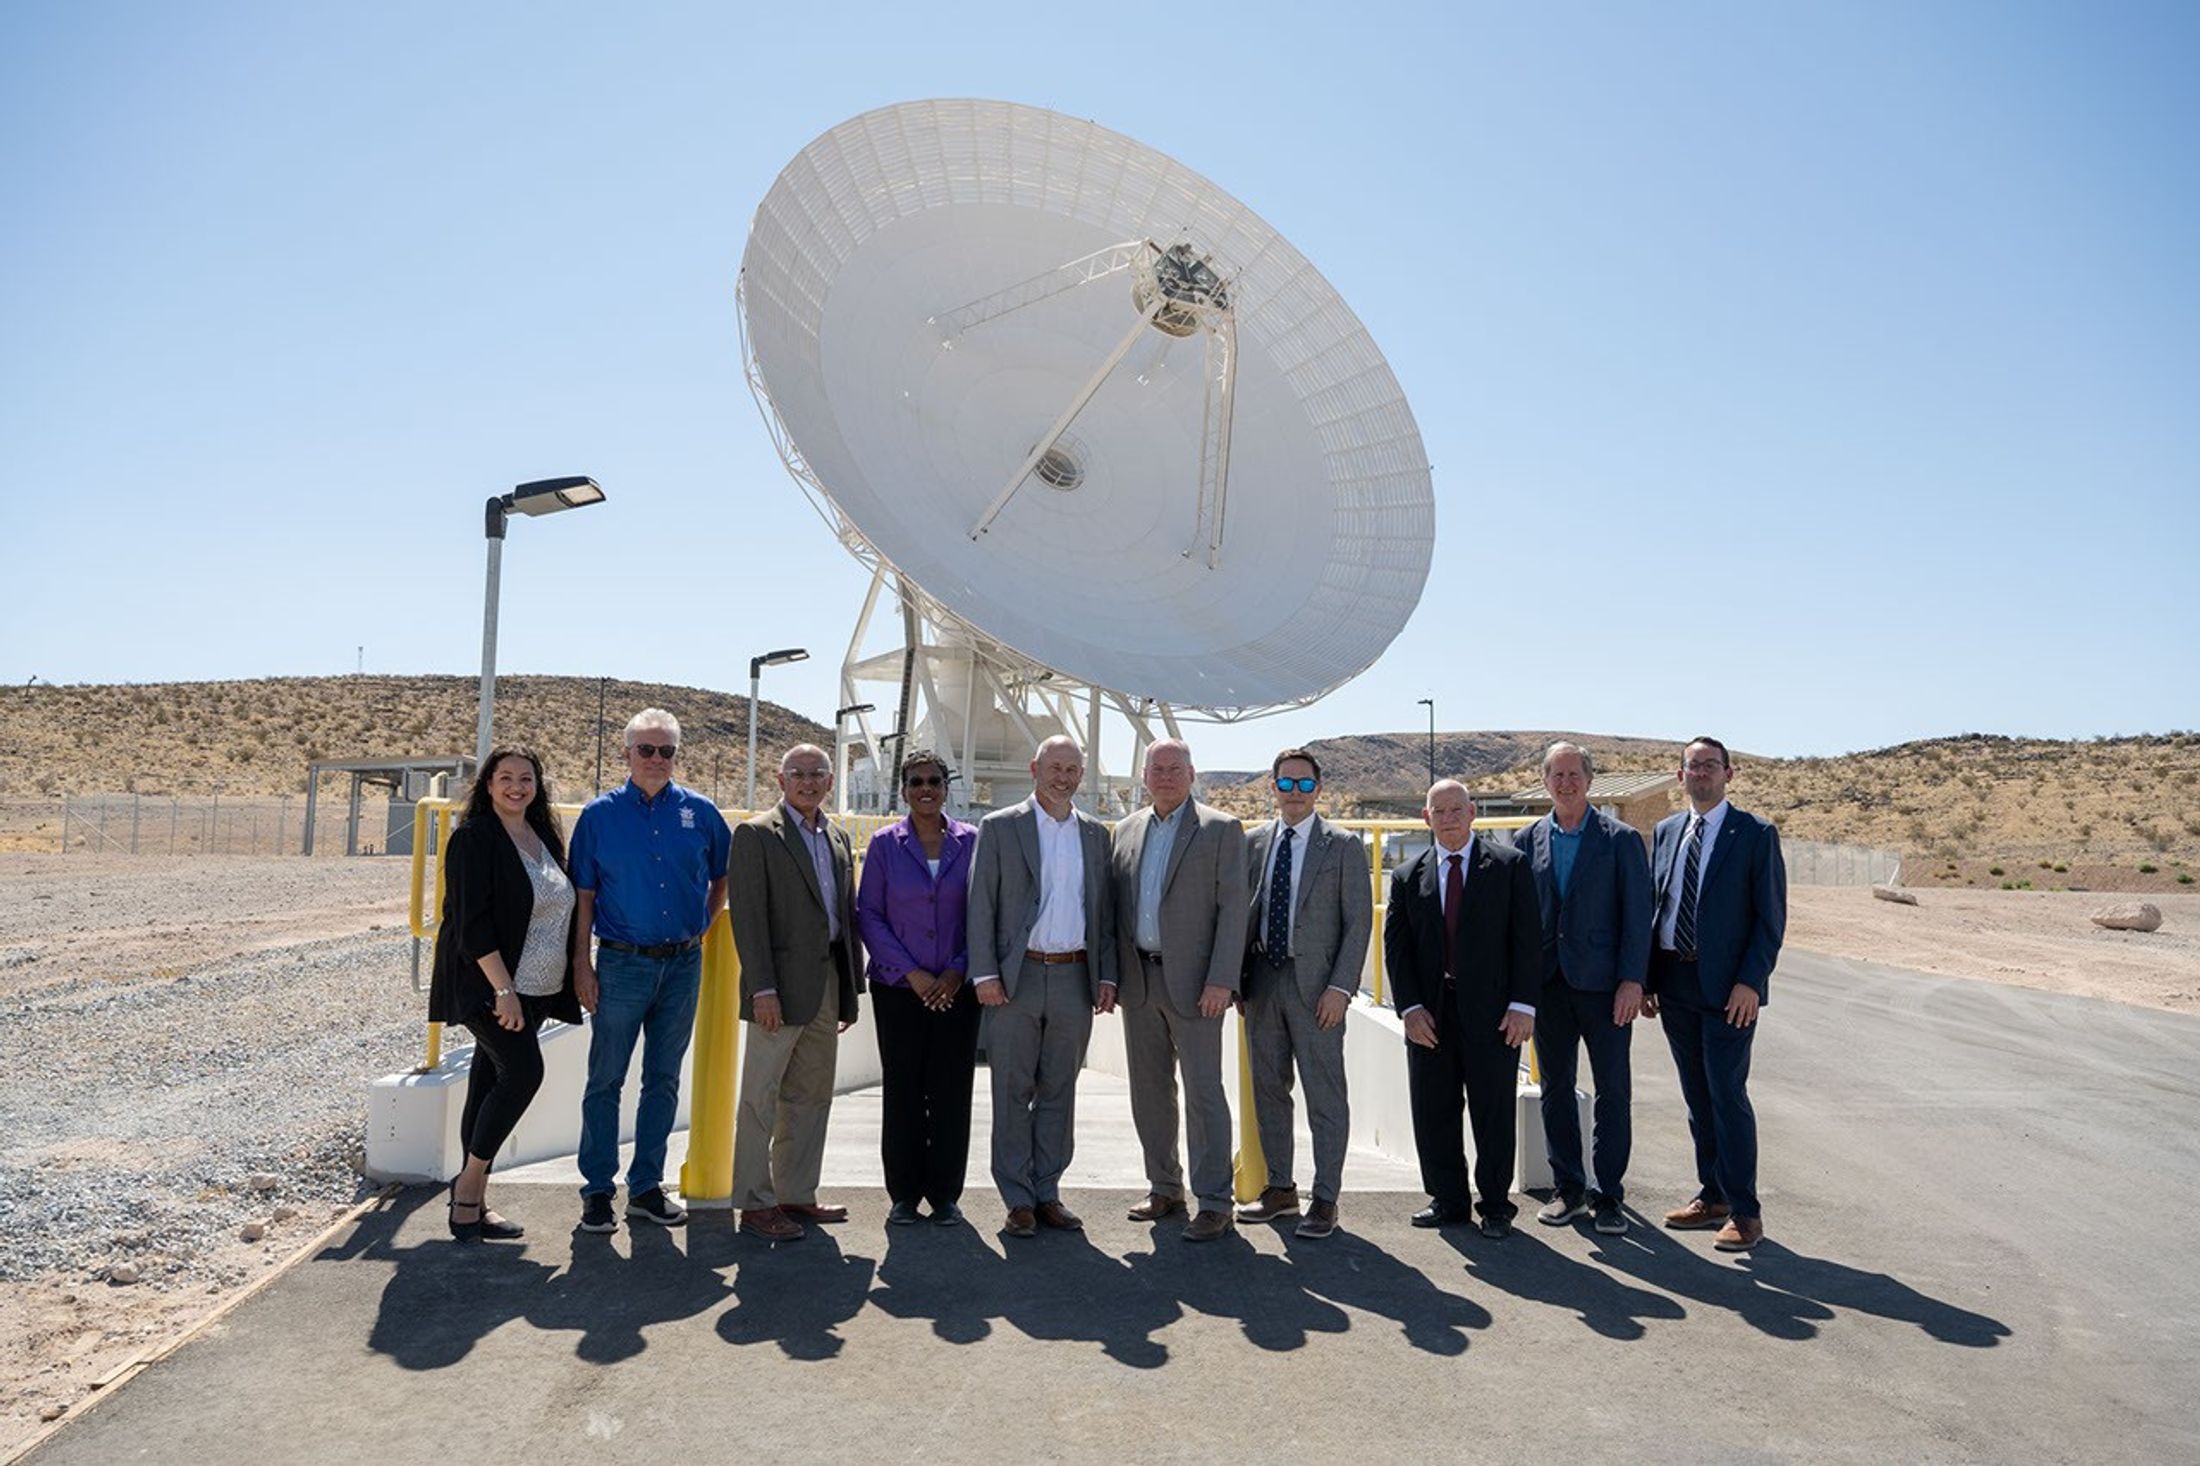
Ten people in professional attire pose together outside under a clear blue sky, with a massive white satellite dish standing directly behind them.

PIA26779

Credits:
NASA/JPL-Caltech

Description

Leadership from NASA Headquarters, the Jet Propulsion Laboratory, and the Deep Space Network (DSN) stand in front of the recently completed Deep Space Station 23 antenna at the Deep Space Network’s Goldstone complex near Barstow, California, on Aug. 25, 2026. 

From left: Germaine Aziz (project manager, DSN Aperture Enhancement Project, JPL); Bradford Arnold (manager, Telecom Programs & Oversight, JPL); Keyur Patel (associate lab director for Flight Projects & Mission Success, JPL); Wanda Peters (deputy associate administrator, Research and Technology Mission Directorate, NASA Headquarters); Jimmy Kenyon (associate administrator, RTMD, NASA Headquarters); John McCullough (acting director, Space Communications and Navigation Program, NASA Headquarters); Gregory Heckler (deputy program manager for capability development, SCaN, NASA Headquarters); William Marinelli (development manager, SCaN, NASA Headquarters), Michael Levesque (project manager, DSN, JPL); and Frank Kaufholod (project manager, NASA Glenn Research Center).

They gathered at the recently completed DSS-23 antenna for a ceremonial ribbon cutting on Aug. 25, 2026. It’s the latest antenna to be added as part of the DSN’s Aperture Enhancement Project, which began in 2009 to upgrade and expand the network by adding six new 34-meter (114-foot) multifrequency beam-waveguide antennas. These versatile Deep Space Network dishes can enhance many missions operating over different radio frequencies. 

The DSN allows missions to track, send commands to, and receive scientific data from faraway spacecraft. It is managed by JPL, a division of Caltech, in Southern California for SCaN, which is located at NASA Headquarters within RTMD.

For more information about the DSN, visit:

https://www.nasa.gov/communicating-with-missions/dsn/

Source: science.nasa.gov