APOD: 2026 September 10 – LDN 1295: The Giraffe Nebula

APOD

Astronomy Picture of the Day

Discover the cosmos! Each day a different image or photograph of our fascinating universe is featured, along with a brief explanation written by a professional astronomer.

LDN 1295: The Giraffe Nebula

Explanation: What does this image look like to you? Many see a giraffe facing right, with neck stretched high and long legs mid-stride (but some may see a squirrel instead). The featured image shows LDN 1295, also called the Giraffe Nebula, in the constellation of the mythical queen of Aethiopia (Cassiopeia). It is an object in the Lynds Catalogue of Dark Nebulas, compiled in 1962 by American astronomer Beverly Lynds, a pioneer for women in astronomy and astrophysics. Dark nebulas are interstellar clouds of dust and gas that block the visible light of the stars behind them. These nebulas are often faint and challenging targets for astrophotographers. Why do we see animal shapes and faces in nebulas, clouds, and pretty much everywhere? It is due to pareidolia, our tendency to look for familiar patterns. Pareidolia may provide animals with an evolutionary advantage, for example in identifying (and avoiding) predators.

APOD’s main NASA site is moving : From apod.nasa.gov to science.nasa.gov/apod
Tomorrow’s picture: freewheeling

Date September 10, 2026
Credit & Copyright Alessandro Merga
Authors & editors: Cecilia Chirenti, Robert Nemiroff, Jerry Bonnell, Keighley Rockcliffe
A service of: ASD at NASA / GSFC,
NASA Science Activation & Michigan Tech. U.

Source: science.nasa.gov

Peatland Fires Darken Skies in Indonesia


No Fire Detections
Fire Detections

Thick gray plumes of smoke stream from large numbers of fires scattered across the island of Borneo.
NASA Earth Observatory / Lauren Dauphin

The locations of MODIS fire detections are depicted with small red circles. Most are visible on the southern side of the island.

Thick gray plumes of smoke stream from large numbers of fires scattered across the island of Borneo.
NASA Earth Observatory / Lauren Dauphin

The locations of MODIS fire detections are depicted with small red circles. Most are visible on the southern side of the island.


No Fire Detections

Fire Detections


If there were an apex predator among fires, tropical peatland fires would be a top contender. These fires, which burn in dried wetland soils, are slow-burning, highly polluting, and notoriously difficult to extinguish because they smolder at low temperatures and often burn underground through expansive deposits of peat. By one estimate, peat fires generate three times more fine particulate matter than other tropical forest fires, five times more sulfur dioxide, three times more organic carbon, and two times more methane and carbon monoxide.

Fire season was underway in Indonesia when the MODIS (Moderate Resolution Imaging Spectroradiometer) on NASA’s Aqua satellite captured this image on September 1, 2026. In the map on the right, each red dot depicts one “fire detection.” A fire detection is a pixel in which the sensor and an algorithm determined there were thermal anomalies indicative of fire. Multiple detections can be generated by a single fire.

Peat fires are a recurring challenge in Indonesia, which is home to about 36 percent of the world’s tropical peatlands. When parched by drought, the archipelago’s peat landscapes have become unrelenting infernos on several occasions over the past three decades, with fires producing blankets of smoke for weeks on end and upending daily life for millions of people.

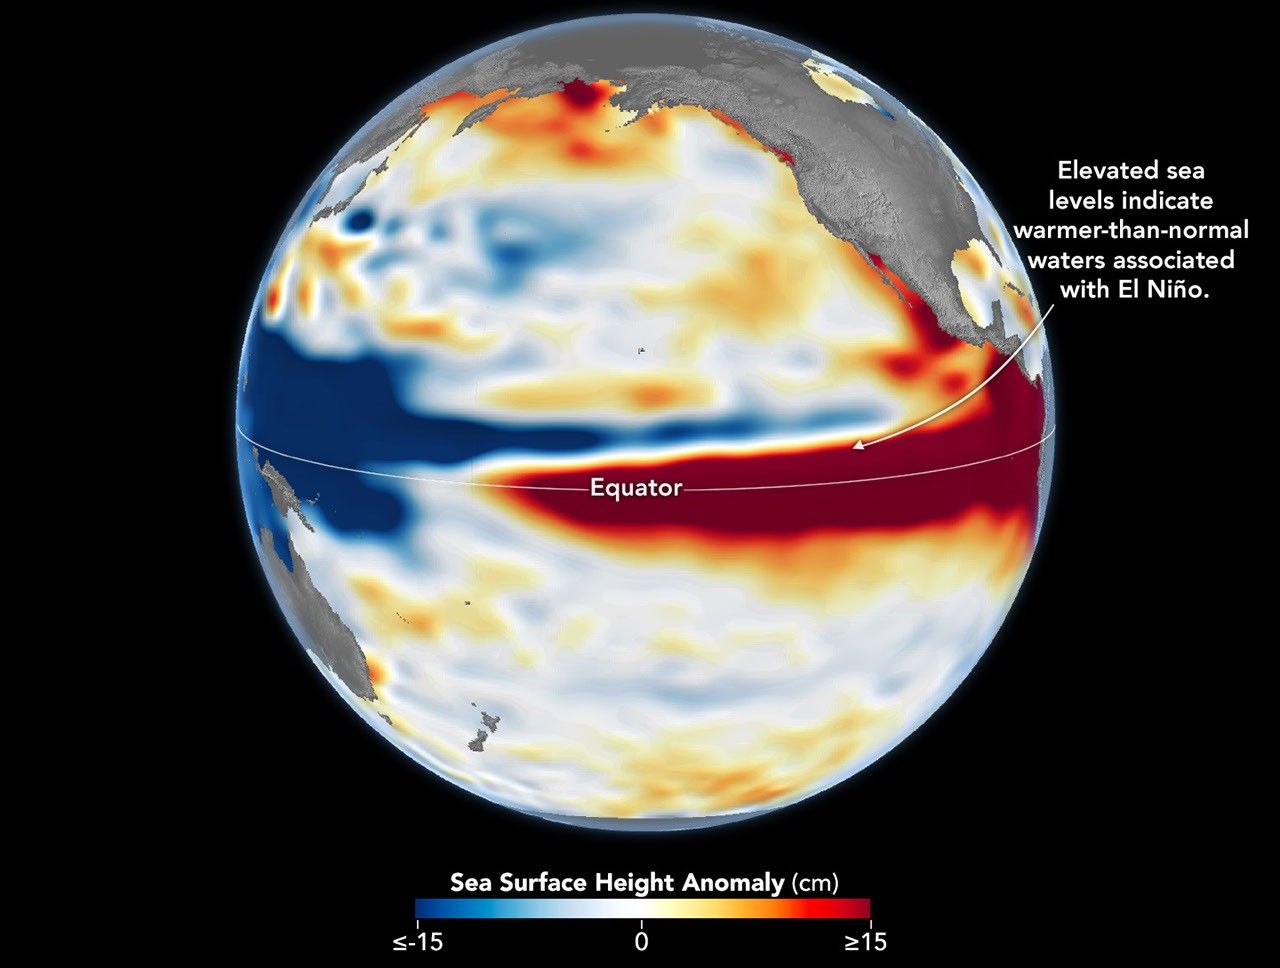
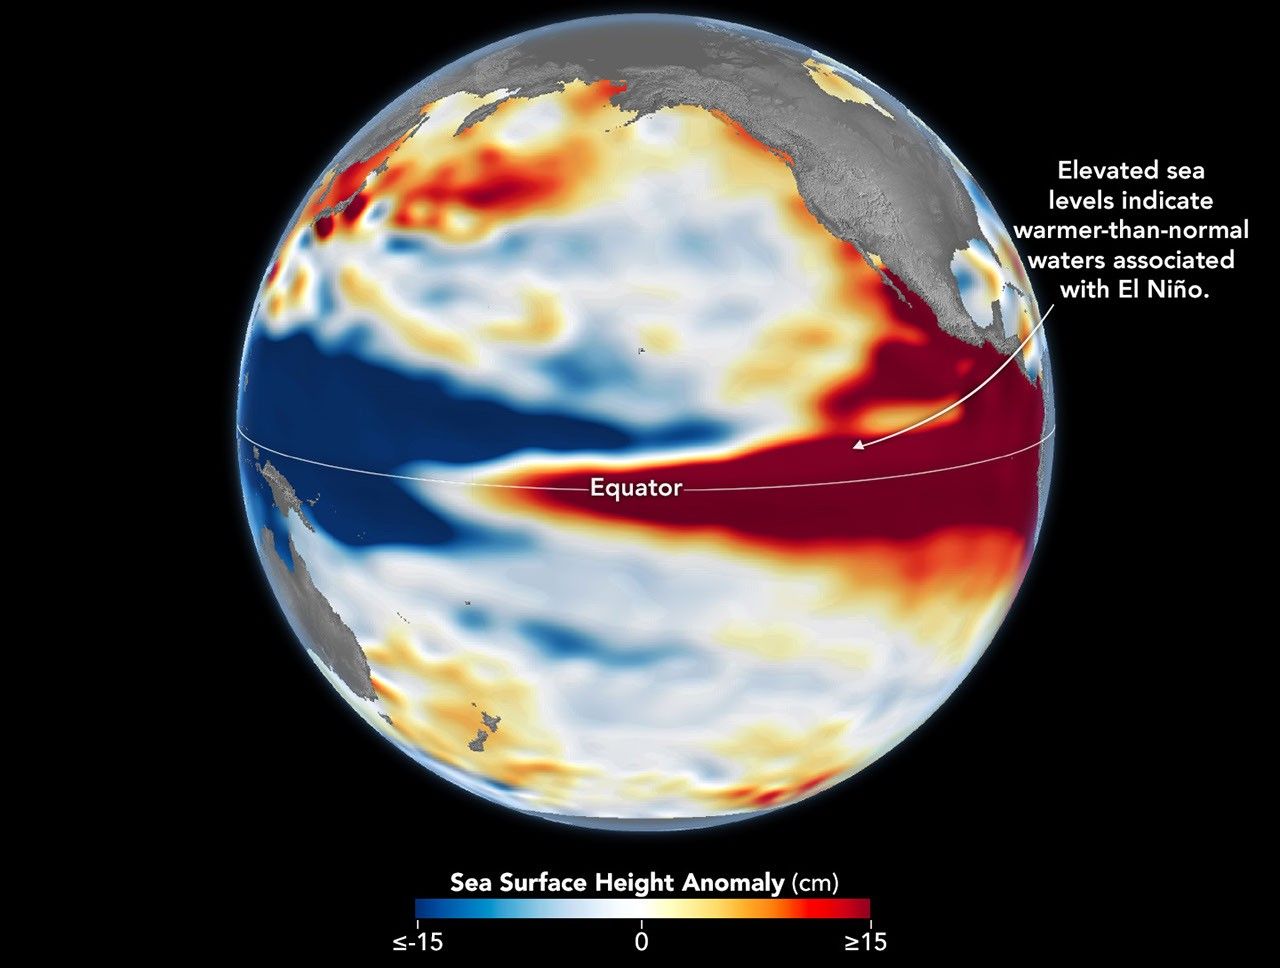
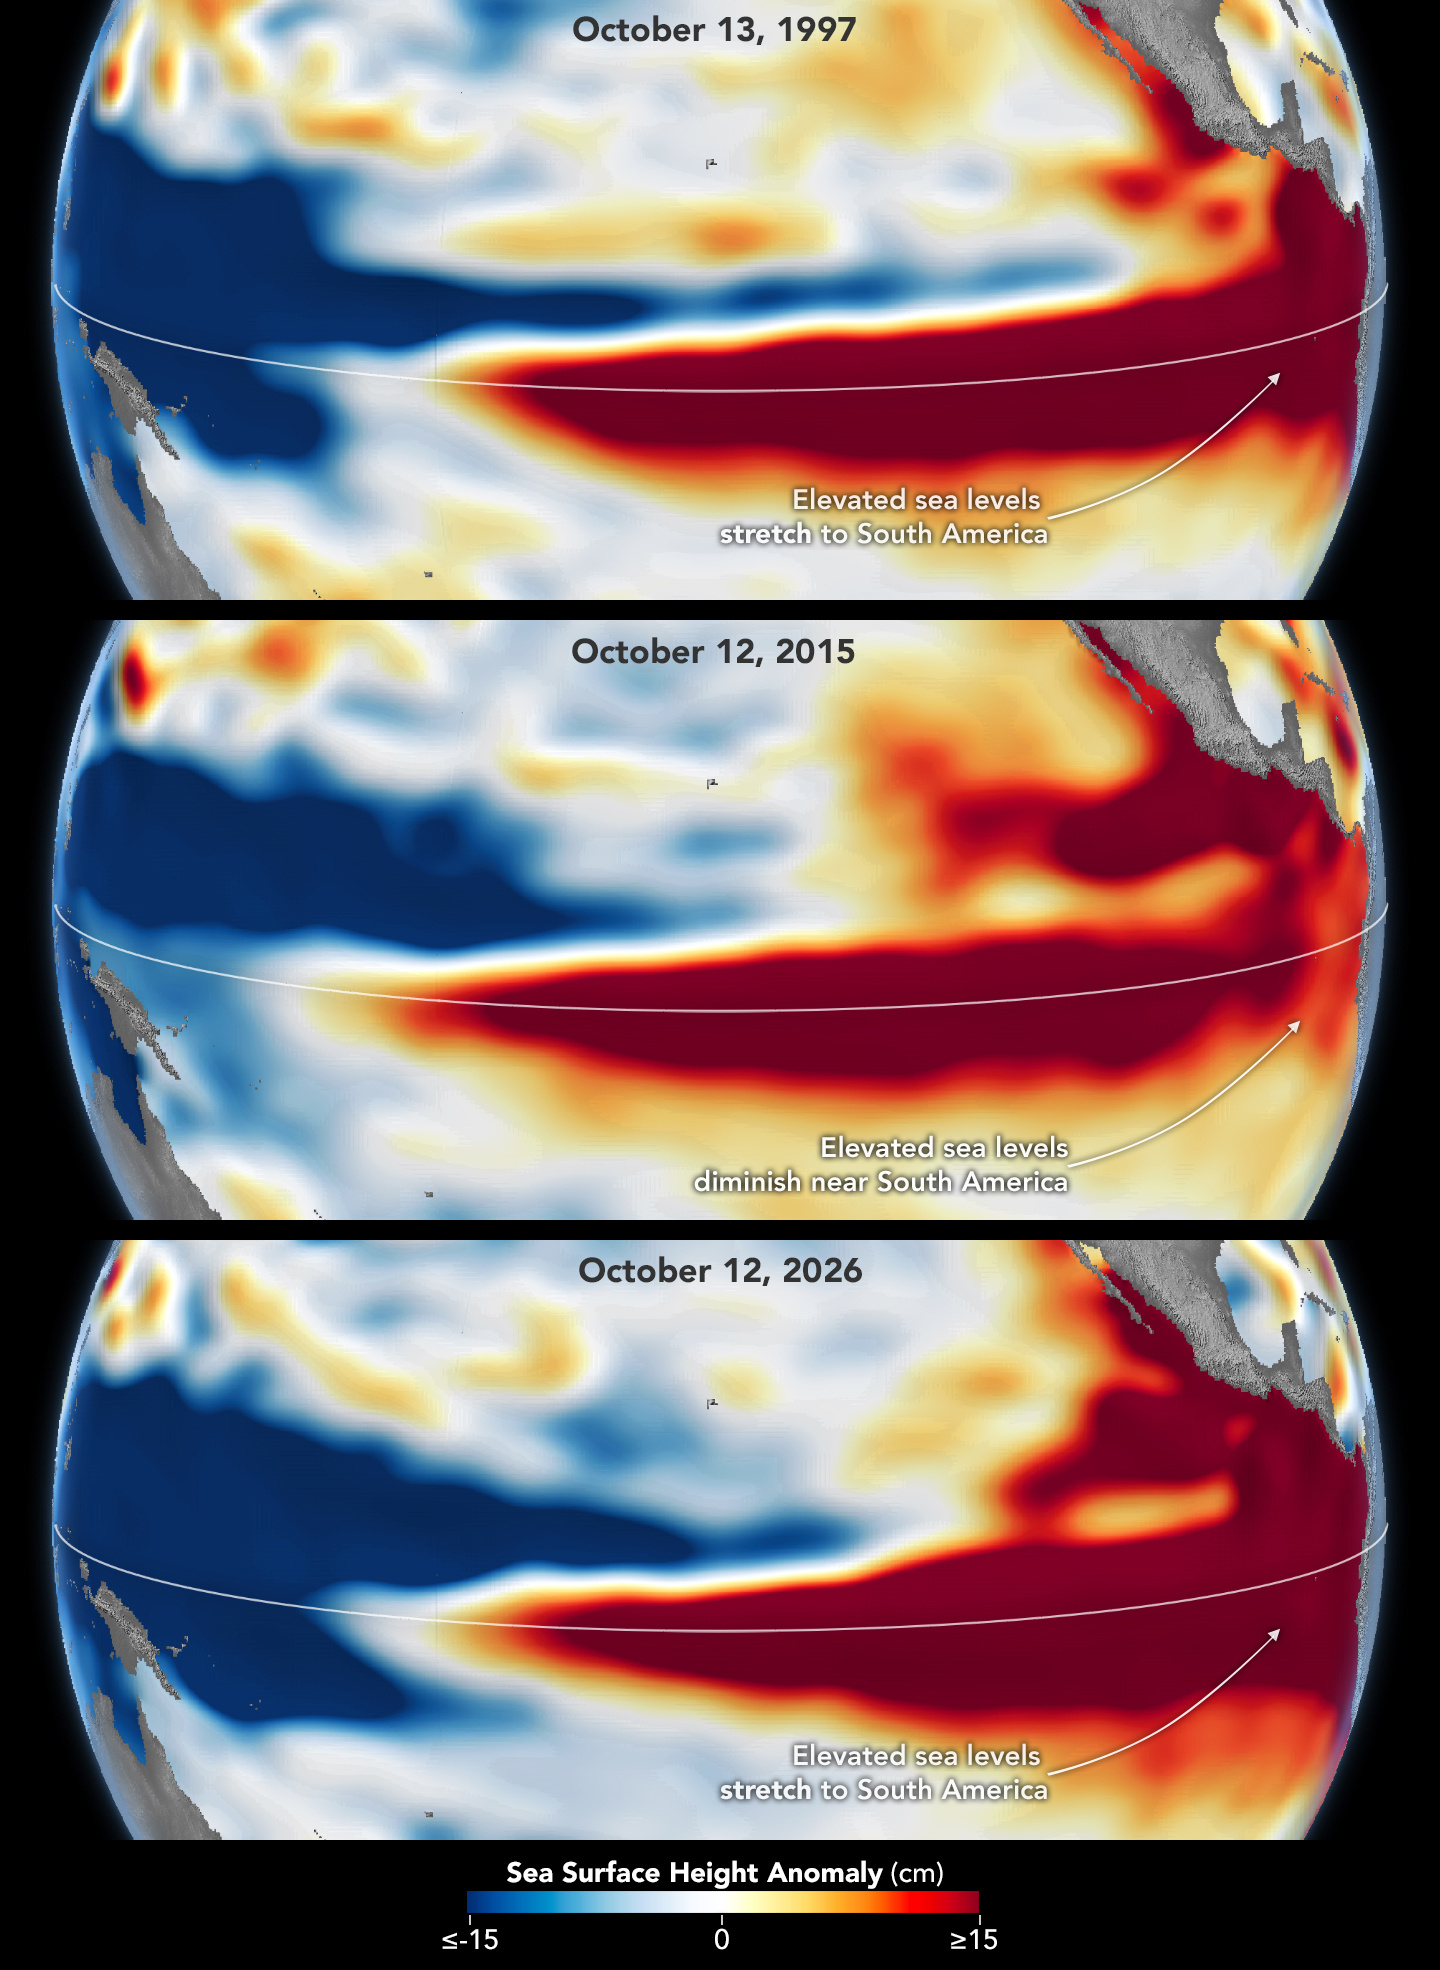
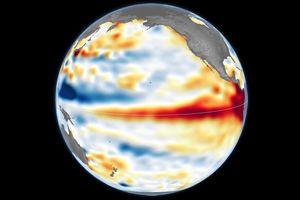
While fires occur in Indonesia every year, previous El Niño years—1997 and 2015 especially—produced the most extreme burning in recent decades. The climate pattern, assessed by NOAA as present and strengthening in August, typically leads to sharp reductions in rainfall in Indonesia, particularly when combined with a positive phase of the Indian Ocean Dipole, which was also present.

“Indonesia is only about three weeks into its fire season, but we’re seeing fire activity track sharply upward, similar to 2015,” said Robert Field, a Columbia University researcher who developed a tool called the Global Fire Weather Database that produces experimental, real-time fire weather forecasts. “The strong El Niño is making the dry season drier over the fire-prone parts of the country and exacerbating burning—just as we anticipated it would,” he said. In 2015, after burning for more than three months, Indonesia’s fires had released 1.75 billion tons of greenhouse gas equivalents—more than Japan emits in a year. As of September 2, Indonesia’s 2026 fires, having burned for about a month, have released roughly 10 percent as much as the 2015 fires.          

As in 2015, Indonesia was in the midst of a severe and widespread drought in summer 2026. About 90 percent of the country received little to no rainfall in early August, according to data from the Indonesian meteorological agency. Normally, it’s too wet for fires to spread through underground peat deposits in Kalimantan, Sumatra, and Papua, but they can in dry conditions. “Surface fires are less of a concern, but when fires get underground, they just won’t stop,” Field said. “They’ll keep burning until the rains come in October or November.” 

The Indonesian government uses NASA and NOAA observations from the MODIS and VIIRS sensors to track active fires in near-real-time. Indonesia’s Ministry of Forestry MODIS- and VIIRS-based fire-monitoring platform SiPongi, for instance, tallied 946 hotspots on August 31, 2026.

However, it’s difficult for MODIS and VIIRS to detect fires through thick smoke or clouds, within the forest understory, or underground in peat deposits. When Indonesian fires become the most intense, the number of fires recorded by VIIRS or MODIS can actually decrease. “The worst smoke events, paradoxically, can be the hardest to observe from space with MODIS and VIIRS,” said Mark Cochrane, an ecologist at the University of Maryland Center for Environmental Science who has conducted field research on peat fires in Indonesia for nearly a decade.

The large-scale construction of irrigation canals and drainage of peat swamps in the 1990s, part of an effort to establish massive rice farms, contributed to the flammability of the region today by significantly lowering the water table in wetland areas, Cochrane said. He also noted that oil palm and other plantation forestry is common in this region. Yet after an unusually grim fire season in 2015, governments and other organizations have worked to dam up some irrigation canals and restore wetlands. There have also been renewed efforts to improve firefighting capacity and reduce the number of fires that people accidentally ignite.

“This year will be a real stress test of the measures that were put in place after 2015,” said Shi Jun Wee, a University of Maryland graduate student. Wee is working on a team partnering with NASA and MapBiomas to develop new algorithms and techniques to detect more understory fires than MODIS and VIIRS can by tapping into shortwave infrared observations from Landsat and Sentinel-2 satellites. As the fires progress, he plans to track developments using NASA’s Worldview data browser, FIRMS (Fire Information for Resource Management System), HLS (Harmonized Landsat and Sentinel-2) observations, and GFED (Global Fire Emissions Database).

On the ground in Indonesia and neighboring countries, the smoke is already causing widespread disruptions. Indonesian officials have warned that large swaths of the population have been exposed to hazardous smoke. Some schools started shifting to remote learning, nine national parks have closed, and several flights have been delayed due to heavy smoke, according to news reports.

“People tend to focus on these fires during an El Niño and then forget about them,” Cochrane said. “We need sustained focus, even during the years when they aren’t as bad, to solve this,” he said. “These fires create a tremendous amount of emissions.”

NASA Earth Observatory image by Lauren Dauphin, using MODIS data from NASA EOSDIS LANCE and GIBS/Worldview. Story by Adam Voiland.

References & Resources

You may also be interested in:

Stay up-to-date with the latest content from NASA as we explore the universe and discover more about our home planet.

Fighting Fire With Fire

3 min read

In fire-prone ecosystems in Australia’s Northern Territory, prescribed burns are lit to minimize the severity of fires later in the…

Article

Smoke Streams Across Eastern Washington

3 min read

Wildland fires in early August 2026 pushed air quality to unhealthy levels, destroyed hundreds of structures, and triggered mandatory evacuations…

Article

Cottonwood Fire Chars Utah

5 min read

The blaze burned more than 150 square miles and swept through parts of a ski resort.

Article

Source: science.nasa.gov

NASA, NFL Team Up to Showcase Space, Aeronautics Innovation

Football
A football floats in microgravity aboard the International Space Station, high above the Earth.
Credit: NASA

Through a new collaboration between NASA and the National Football League (NFL), the agency will soon bring America’s strengths in space exploration and aeronautics innovation to the football field.

NASA will conduct flyovers, astronaut appearances, and fan engagement at NFL games across the United States as part of its new Inspiration Tour.

“This is the first season NASA is taking part in flyovers at NFL games, bringing the excitement of America’s space program directly to fans across the country,” said NASA Administrator Jared Isaacman. “We’re returning to the Moon, building a Moon Base, advancing fission-powered spacecraft, and pushing the boundaries in aeronautics, science, and discovery. Achieving those ambitions will take the very best of America, and partnering with the NFL gives us an incredible platform to inspire the next generation to look up and imagine the possibilities.”

NASA participation is targeted for the following games. Additional details will be released prior to each game, and more dates may be added:

  • 1 p.m., Sunday, Sept. 13: Pittsburgh Steelers vs. Atlanta Falcons in Pittsburgh
  • 1 p.m., Sunday, Sept. 20: Baltimore Ravens vs. New Orleans Saints in Baltimore
  • 1 p.m., Sunday, Oct. 4: Philadelphia Eagles vs. Los Angeles Rams in Philadelphia
  • 1 p.m., Sunday, Oct. 11: New York Jets vs. Cleveland Browns in East Rutherford, New Jersey

Flyovers scheduled at some of the games will showcase NASA’s fleet of aircraft, which are used for high-speed testing, high-altitude research, astronaut training, and more. Regularly flying the aircraft maintains the health of the fleet and publicly demonstrates new technologies that may be applied to future commercial air travel.  

With stops across the nation and led by Isaacman, NASA’s Inspiration Tour convenes academic, industry, and public sector stakeholders to connect the agency with the people, technologies, and organizations that drive American leadership in space.

The tour will culminate in MAX POWER, a public exposition of American air and space innovation, Nov. 7 and Nov. 8, on and near the agency’s Kennedy Space Center in Florida. Held in honor of America’s historic 250th anniversary, the multi-day, family-friendly event will showcase the next-generation aircraft, spacecraft, autonomous vehicles, and technologies that will help define the future of transportation in air and space.

For more information about MAX POWER and the agency’s missions, visit:

https://www.nasa.gov/maxpower

-end-

Camille Gallo / Jessica Taveau
Headquarters, Washington
202-358-1600
[email protected] / [email protected]

Details

Last Updated

Sep 10, 2026

Editor
Jessica Taveau

Related Terms

Source: www.nasa.gov
The Otherworldly Geology of Vasquez Rocks


false color
natural color

In this false-color image, areas with more extensive vegetation on the Sierra Pelona retain more moisture than the hills surrounding Agua Dulce, making the Sierra Pelona appear dark green in comparison to the rusty brown coloration of the lower hills. Vasquez Rocks appears as a patch of curved gray stripes near the center of the image.
NASA Earth Observatory/Michala Garrison

This natural-color image shows the same area, but there is less difference in colors between higher-elevation and lower-elevation vegetation. Most features in the image are shades of brown.
NASA Earth Observatory/Michala Garrison

In this false-color image, areas with more extensive vegetation on the Sierra Pelona retain more moisture than the hills surrounding Agua Dulce, making the Sierra Pelona appear dark green in comparison to the rusty brown coloration of the lower hills. Vasquez Rocks appears as a patch of curved gray stripes near the center of the image.
NASA Earth Observatory/Michala Garrison

This natural-color image shows the same area, but there is less difference in colors between higher-elevation and lower-elevation vegetation. Most features in the image are shades of brown.
NASA Earth Observatory/Michala Garrison


false color

natural color


A patchwork of chaparral and sage scrub vegetation shades the hills and mountain ranges surrounding Agua Dulce and Vasquez Rocks in this pair of images captured by the OLI (Operational Land Imager) aboard Landsat 9 on July 28, 2026. The false-color image (bands 6-5-4) on the left incorporates shortwave-infrared and near-infrared observations that accentuate differences in vegetation and soil moisture in comparison to the natural-color image on the right. NASA Earth Observatory images by Michala Garrison.

Editor’s Note: Today’s story is the answer to the September Puzzler.

Several of the outcrops at Vasquez Rocks Natural Area in Southern California jut from the arid landscape of the Soledad Basin at remarkable angles. Geologists estimate that the tilt of sedimentary rock strata found in the area averages 50 degrees, steep enough that many of the otherworldly formations appear to point toward the stars.  

That’s fitting, in some ways, because the rocks have served as one of the Star Trek franchise’s favorite backdrops ever since the show’s inaugural season, when Captain James T. Kirk scrambled up the jagged terrain during an iconic battle with a member of a reptilian alien species.

Viewed from space, the Vasquez Rocks are considerably less dramatic, but they show up clearly as bands of gray nestled between mountain ranges in these false-color (left) and natural-color (right) images captured by the OLI (Operational Land Imager) on Landsat 9. The false-color view (bands 6-5-4) incorporates shortwave-infrared and near-infrared observations that accentuate differences in the landscape’s vegetation in comparison to the natural-color image on the right.

A zoomed-in view of the Vasquez Rocks part of the image highlights a sandy parking lot where Star Trek scenes were filmed, the Antelope Valley Freeway, and the nearby community of Agua Dulce.
Proximity to Los Angeles and the freeway is among the reasons the tilted strata at Vasquez Rocks have long been a popular filming location for television producers. This false-color image (bands 6-5-4) was captured by the OLI (Operational Land Imager) aboard Landsat 9 on July 28, 2026.
NASA Earth Observatory/Michala Garrison

The Vasquez Rocks didn’t start out pointing skyward. When they were forming 25 million years ago, sediment was spread across alluvial fans—cone-shaped deposits that develop as fast-moving streams empty onto relatively flat plains. The sediment likely hadn’t traveled far, much of it eroding from nearby uplands. Over time, the alluvial fan deposits were buried and cemented into thick layers of sandstone and conglomerate rock.

Over millions of years, the region was then reshaped by the interaction of tectonic plates just to the east. Two plates grind past each other along a boundary that includes the San Andreas Fault, a strike-slip fault where the North American plate moves southeast and the Pacific plate northwest, contributing to the powerful tectonic forces that ripple throughout the region.

Eventually this tectonic activity led to the uplift and deformation of the Soledad Basin, with sedimentary layers gradually tilting, folding, and rotating. Once they were exposed at the surface, millions more years of weathering and erosion sculpted the formations further, removing softer material and leaving the more resistant sandstone and conglomerate fins and ridges that wow visitors today.

The rock formations represent far-flung moons and planets in several other Star Trek episodes and Vulcan, Spock’s home planet, in two Star Trek movies. Other productions have highlighted the Vasquez Rocks as well. They make appearances in dozens of other television shows and movies, including the science fiction series Westworld, For All Mankind, and Battlestar Galactica.

NASA Earth Observatory images by Michala Garrison, using Landsat data from the U.S. Geological Survey. Story by Adam Voiland.

References & Resources

You may also be interested in:

Stay up-to-date with the latest content from NASA as we explore the universe and discover more about our home planet.

Digging Back in Time in the UAE

5 min read

Once below a shallow sea, Jabal al Fāyah now stands above the desert in the United Arab Emirates as a…

Article

What Lake Bonneville Left Behind

5 min read

The drying of the massive lake exposed playas that became the setting for feats of engineering and technological ingenuity, as…

Article

Pumice Rafts Encroach on Admiralty Islands

4 min read

Buoyant volcanic rock fragments from an underwater eruption drifted across the Bismarck Sea and choked island coasts.

Article

Source: science.nasa.gov

NASA Adds Relativity Space’s Terran R to Launch Services Contract

NASA insignia.
Credit: NASA

A NASA Launch Services (NLS) II contract has been awarded by the agency to Relativity Space Inc., and its Terran R launch service in accordance with the contract’s on-ramp provision. The Terran R launch service will be available to NASA’s launch services to use for future missions.

The NLS II contracts are multiple-award, indefinite-delivery/indefinite-quantity contracts with an ordering period through June 2030 and an overall period of performance through December 2032. The NLS II contracts include an on-ramp provision that provides an opportunity annually for new launch service providers to compete for future missions and allows existing contractors to introduce launch vehicles not currently on their NLS II contracts.

The NLS II contracts support the goals and objectives of the agency’s Human Spaceflight Mission Directorate, Science Mission Directorate, and the Research and Technology Mission Directorate. Under the contract, NASA also can provide launch services to other government agencies, such as the National Oceanic and Atmospheric Administration.

NASA’s Launch Services Program Office at the agency’s Kennedy Space Center in Florida manages the NLS II contracts. For more information about NASA, visit:

https://www.nasa.gov

-end-

Joshua Finch / Jimi Russell
Headquarters, Washington
202-358-1100
[email protected] / [email protected]

Amanda Griffin
Kennedy Space Center, Fla.
321-593-6244
[email protected]

Details

Last Updated

Sep 09, 2026

Editor
Jessica Taveau

Source: www.nasa.gov

The Forested Floodplains of Congaree National Park

A brown, meandering river cuts through a band of dark green forest in Congaree National Park. Labels point out an oxbow lake and meander in the river. Former river channels called paleochannels appear lighter green than other forested areas.
The OLI on Landsat 9 captured this image of the Congaree River winding through floodplain forests in Congaree National Park on August 18, 2025.
NASA Earth Observatory/Michala Garrison

Among the 63 U.S. national parks, few are as defined by a single river’s floodplain as Congaree National Park in South Carolina. While the features are also prominent in other parks, a full 80 percent of Congaree National Park lies within the Congaree River floodplain.

It’s a place home to one of the largest intact tracts of old-growth bottomland hardwood forests in the United States. In this image captured by the OLI (Operational Land Imager) on Landsat 9, the river winds through the forested plain, along with curving bands of green that trace old channels, ridges, and swales left behind as the river gradually migrated across it. Slight differences in elevation in these paleochannels and other landforms affect how frequently they flood, producing distinct ecosystems that appear in contrasting shades of green.

The river flows through flat, soft terrain, which encourages the formation of bends and meanders. Water typically flows faster on the outside of bends, leading to more rapid erosion as the channel carves into the outer riverbank. It moves more slowly on the inside of bends, resulting in the deposition of sediment and the growth of sandy features called point bars. Over time, this process can cut off a bend from the main river channel, forming U-shaped oxbow lakes.

The National Park Service lists Weston Lake, 1.2 miles (1.9 kilometers) from the visitor center, as one of the park’s most permanent oxbow lakes, noting that it is relatively deep and lacks the shallow clay and silt layer found in most of the park’s other oxbow lakes, such as Devil’s Elbow. On the right side of the image is Bates Old River, a roughly 4-mile-long abandoned channel of the Congaree River and one of the longest oxbow lakes in South Carolina. Over time, abandoned channels and oxbow lakes can fill with sediment and become shallow wetlands. Some of these low-lying, water-filled features are known as sloughs, where flood-tolerant cypress-tupelo forests tend to grow.

While loggers targeted forests along the Congaree in the 1880s, challenges such as frequent flooding, interminably muddy roads, and mosquito-plagued conditions meant that most of the floodplain forests escaped the widespread logging that transformed other parts of the Southeast. By the 1950s, conservationists had begun to recognize how rare old-growth forests of this type had become in the region. Congress designated the area a national monument in 1976, and it became a national park in 2003.

As the river snakes its way through the park’s mostly flat terrain, it overflows its banks several times per year, usually in the winter and early spring but also in the summer and fall after hurricanes and major rainstorms. These floods distribute broad layers of nutrient-rich silt throughout the floodplain, nourishing the forests and contributing to the high concentration of unusually large trees in the park.

Over the decades, Congaree National Park has harbored a remarkable array of giant “champion” trees that have held national and state size records for their species. Though individual trees have gained and lost champion status as they have been damaged, have died, or been surpassed by newly measured trees elsewhere, Congaree trees such as the possumhaw (Ilex decidua), water hickory (Carya aquatica), loblolly pine (Pinus taeda), laurel oak (Quercus laurifolia), swamp tupelo (Nyssa biflora), and sweetgum (Liquidambar styraciflua) have held records at times.

During this National Park Week, celebrate by exploring Earth Observatory’s U.S. National Parks from Space collection. You can also check out the offerings of Earth to Sky, a collaborative program that connects NASA science with park service rangers across the nation.   

NASA Earth Observatory image by Michala Garrison, using Landsat data from the U.S. Geological Survey. Story by Adam Voiland.

References & Resources

You may also be interested in:

Stay up-to-date with the latest content from NASA as we explore the universe and discover more about our home planet.

Minute Man National Historical Park

3 min read

Sites relevant to the start of the American Revolutionary War are interspersed throughout the modern-day Boston metropolitan region.

Article

Colonial National Historical Park

2 min read

The colonial communities of “America’s historic triangle” played defining roles in the road to American independence.

Article

Belts of Green in the Washington Suburbs

3 min read

Along the northeast side of the Capital Beltway in Maryland, green spaces weave through the developed landscape.

Article

Source: science.nasa.gov

Dust and Water in Sagittarius A*

A dense star field fills the entire image, with countless stars scattered across a backdrop of glowing clouds in shades of red, orange, pink, white, and blue. At the center, a brilliant concentration of stars creates a bright, almost white core surrounded by intricate filaments and wisps of illuminated gas and dust that radiate outward. Dark, irregular patches of opaque dust interrupt the glowing clouds, particularly toward the left side of the image, where they appear as silhouetted shapes against the brighter background. The surrounding stellar population varies in brightness and color, with cool blue stars and warmer orange and red stars distributed throughout the scene.
ESA/Webb, NASA & CSA, F. Peißker, J. Lu, F. Yusef-Zadeh, N. B. Sabha, C. Chan

A brilliant concentration of stars takes center stage in this Aug. 11, 2026, image taken by NASA’s James Webb Space Telescope. Webb observed IRS 3, a star near the end of its life cycle, located within this starfield. Webb’s mid-infrared data revealed the clear signature of oxygen-rich silicate dust, as well as, for the first time, water, in its surrounding dust envelope.

Read more about this discovery.

Image Credit: ESA/Webb, NASA & CSA, F. Peißker, J. Lu, F. Yusef-Zadeh, N. B. Sabha, C. Chan

Source: www.nasa.gov

Dust Storm Sweeps Over Mali

A light brown dust plume, dense at its center and more diffuse toward its edges, extends horizontally across an orange-brown and green landscape. Scattered white clouds cover some of the scene.
A dust storm obscures the ground in Mali in this image, acquired with the MODIS (Moderate Resolution Imaging Spectroradiometer) on NASA’s Terra satellite on September 5, 2026.
NASA Earth Observatory/Lauren Dauphin

As summer winds down in West Africa, so does much of the region’s dust activity. Dust storms can still occur, though, as one did in early September 2026, when a plume covered parts of Mali and neighboring countries.

The MODIS (Moderate Resolution Imaging Spectroradiometer) on NASA’s Terra satellite captured this image on September 5, 2026. According to Tianle Yuan, an atmospheric scientist at NASA’s Goddard Space Flight Center, storms like this one are often associated with haboobs—powerful dust storms driven by strong convective winds.

In the days after this image was acquired, a wider satellite view showed aerosols from the region moving westward and spilling over the Atlantic Ocean. However, a full transatlantic crossing is unlikely. Such crossings are more common from late spring through summer, when the Saharan Air Layer—a dry, dusty mass of air—can carry dust thousands of miles westward from Africa, riding high in the atmosphere.

Looking ahead, the developing El Niño could reshape these patterns. For instance, Yuan noted that the phenomenon can affect dust over the Sahel and Mali by shifting the Intertropical Convergence Zone and altering convection patterns, though the influence cuts both ways. Drier conditions can leave more loose sediment available for winds to lift, but less convective activity also means fewer intense storms (haboobs) to kick up large dust plumes in the first place. “The connection can be real,” Yuan said, “but hard to pin down for individual events.”

NASA Earth Observatory image by Lauren Dauphin, using MODIS data from NASA EOSDIS LANCE and GIBS/Worldview. Story by Kathryn Hansen.

References & Resources

You may also be interested in:

Stay up-to-date with the latest content from NASA as we explore the universe and discover more about our home planet.

A Moonlit Earth as Seen From Artemis II

4 min read

An astronaut’s photo, taken en route to the Moon, reveals our planet and its place in space in a novel…

Article

June 2026 Satellite Puzzler

2 min read

Your challenge is to tell us the location of the satellite image and why it is interesting.

Article

A Trio of Tropical Cyclones in the Pacific

4 min read

The Pacific was buzzing with storms while the Atlantic was notably quiet.

Article

Source: science.nasa.gov