Discover the cosmos! Each day a different image or photograph of our fascinating universe is featured, along with a brief explanation written by a professional astronomer.
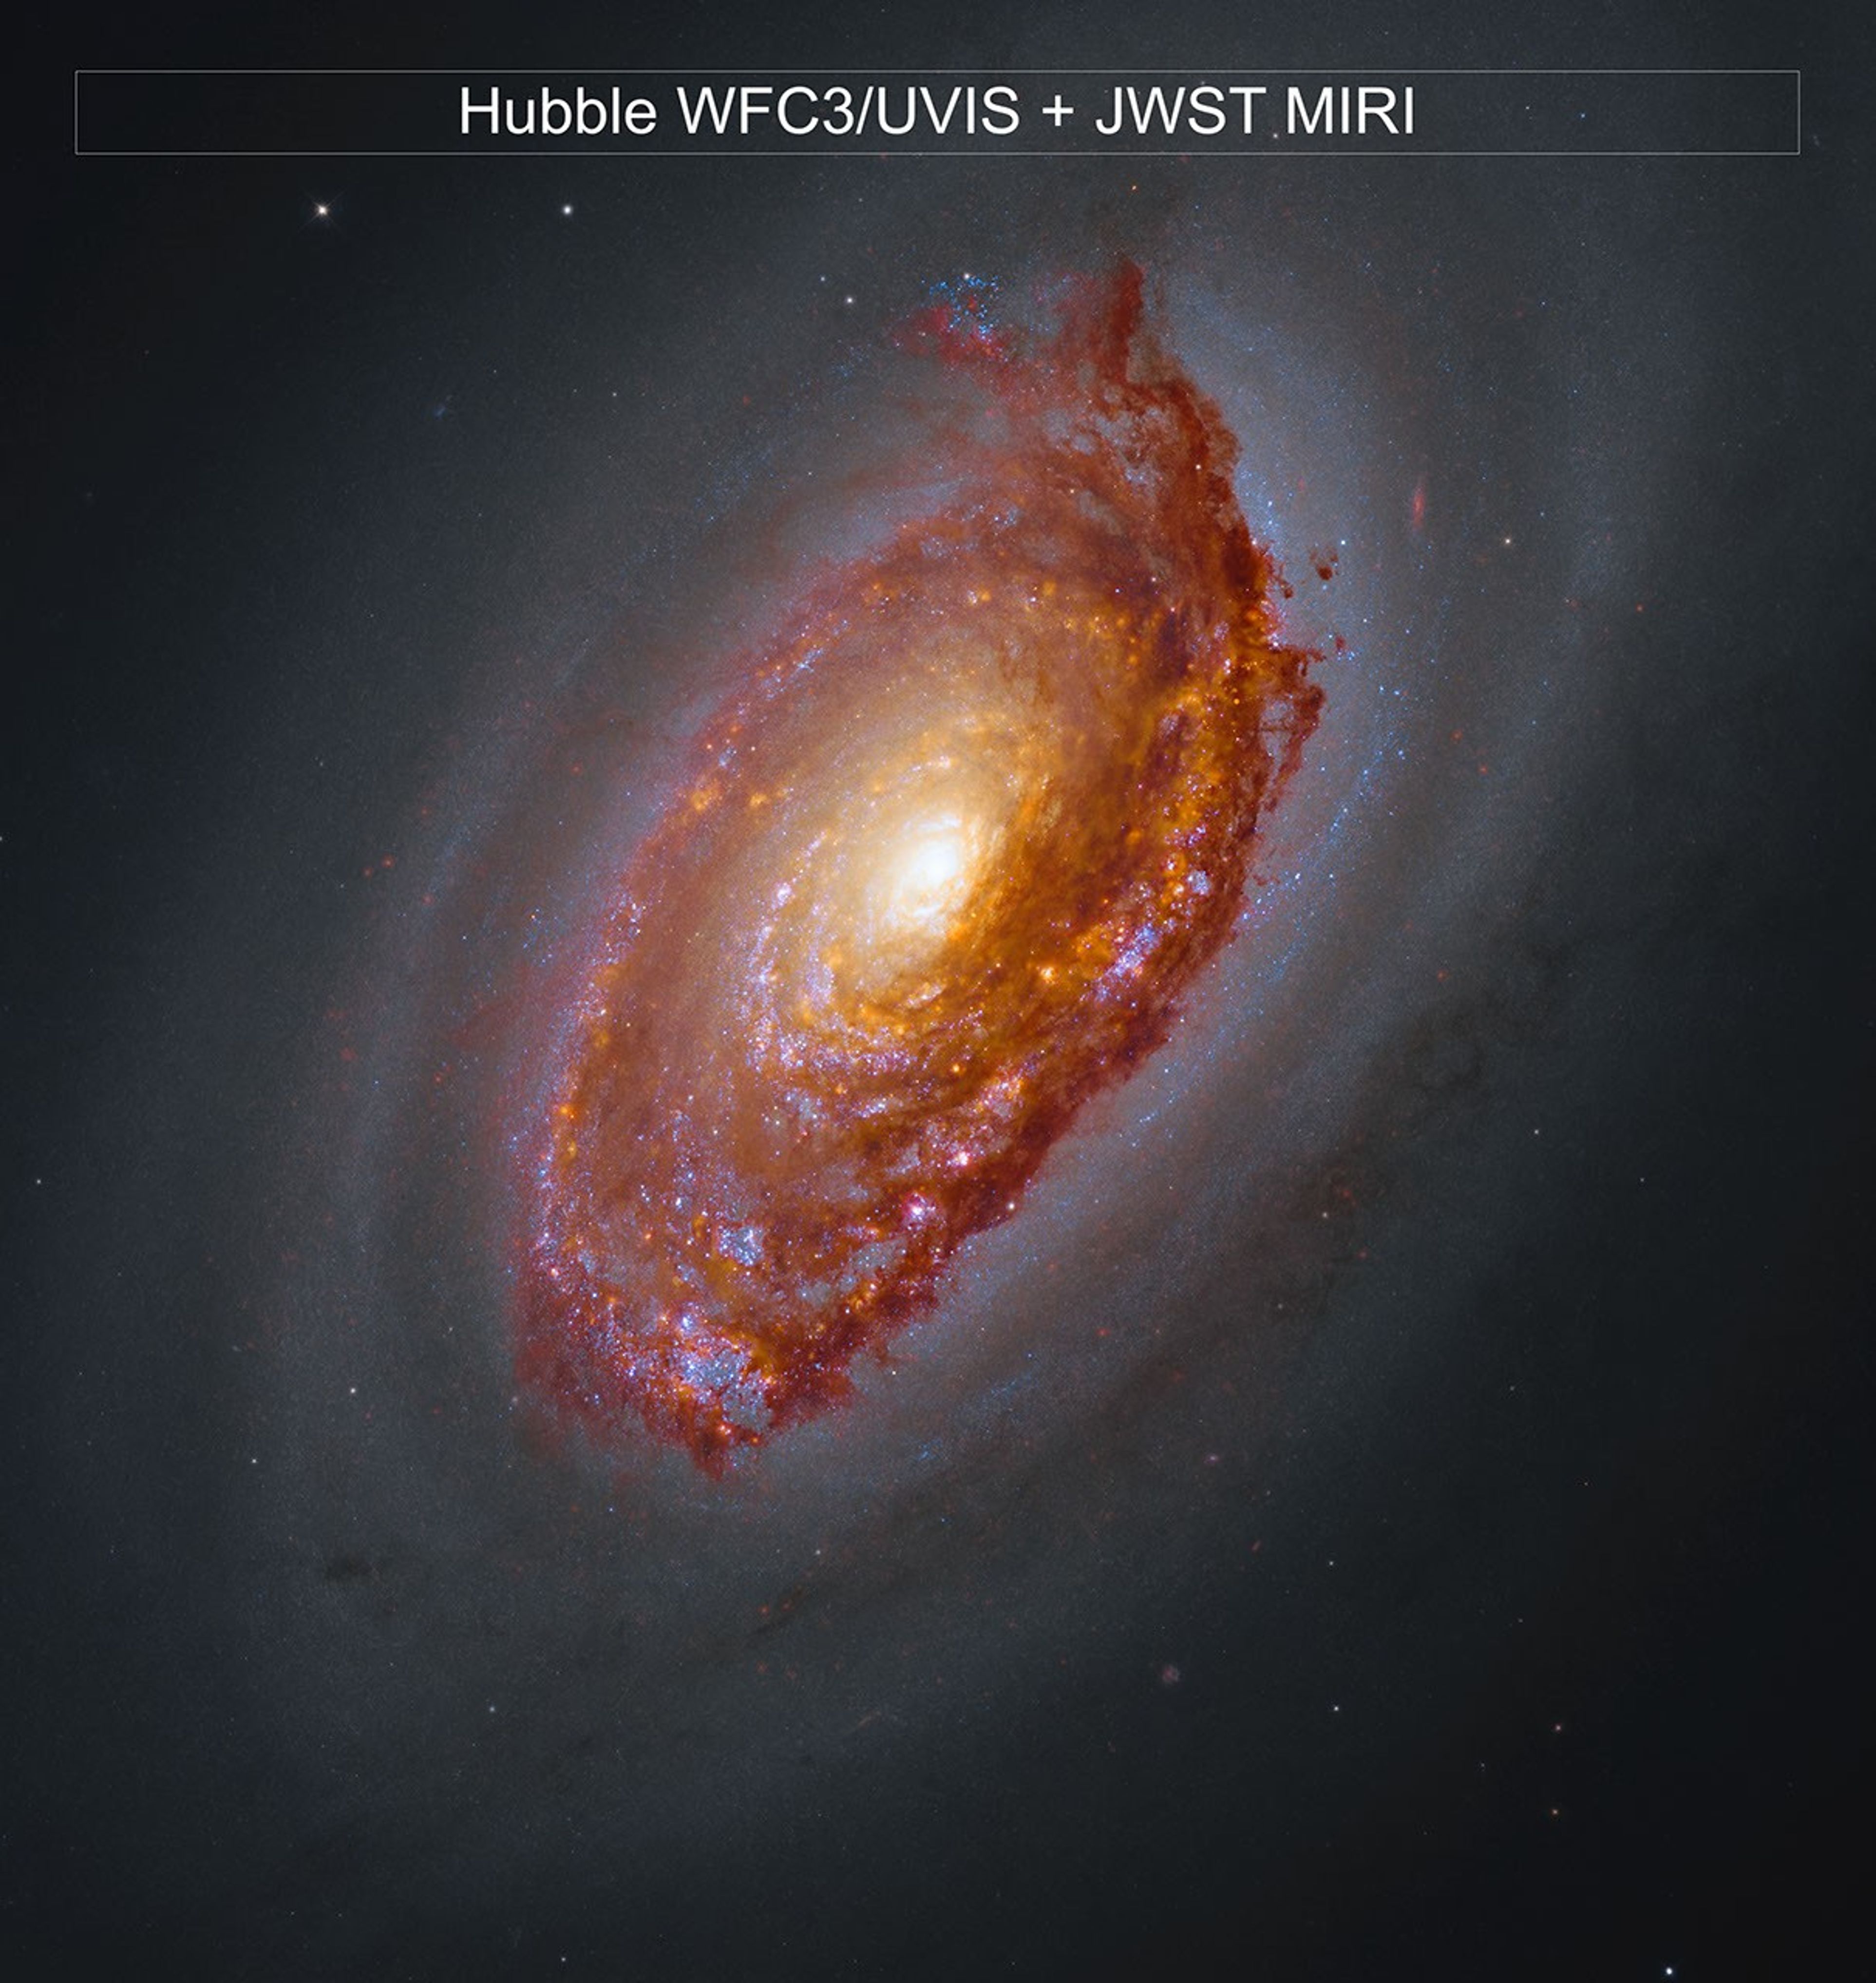
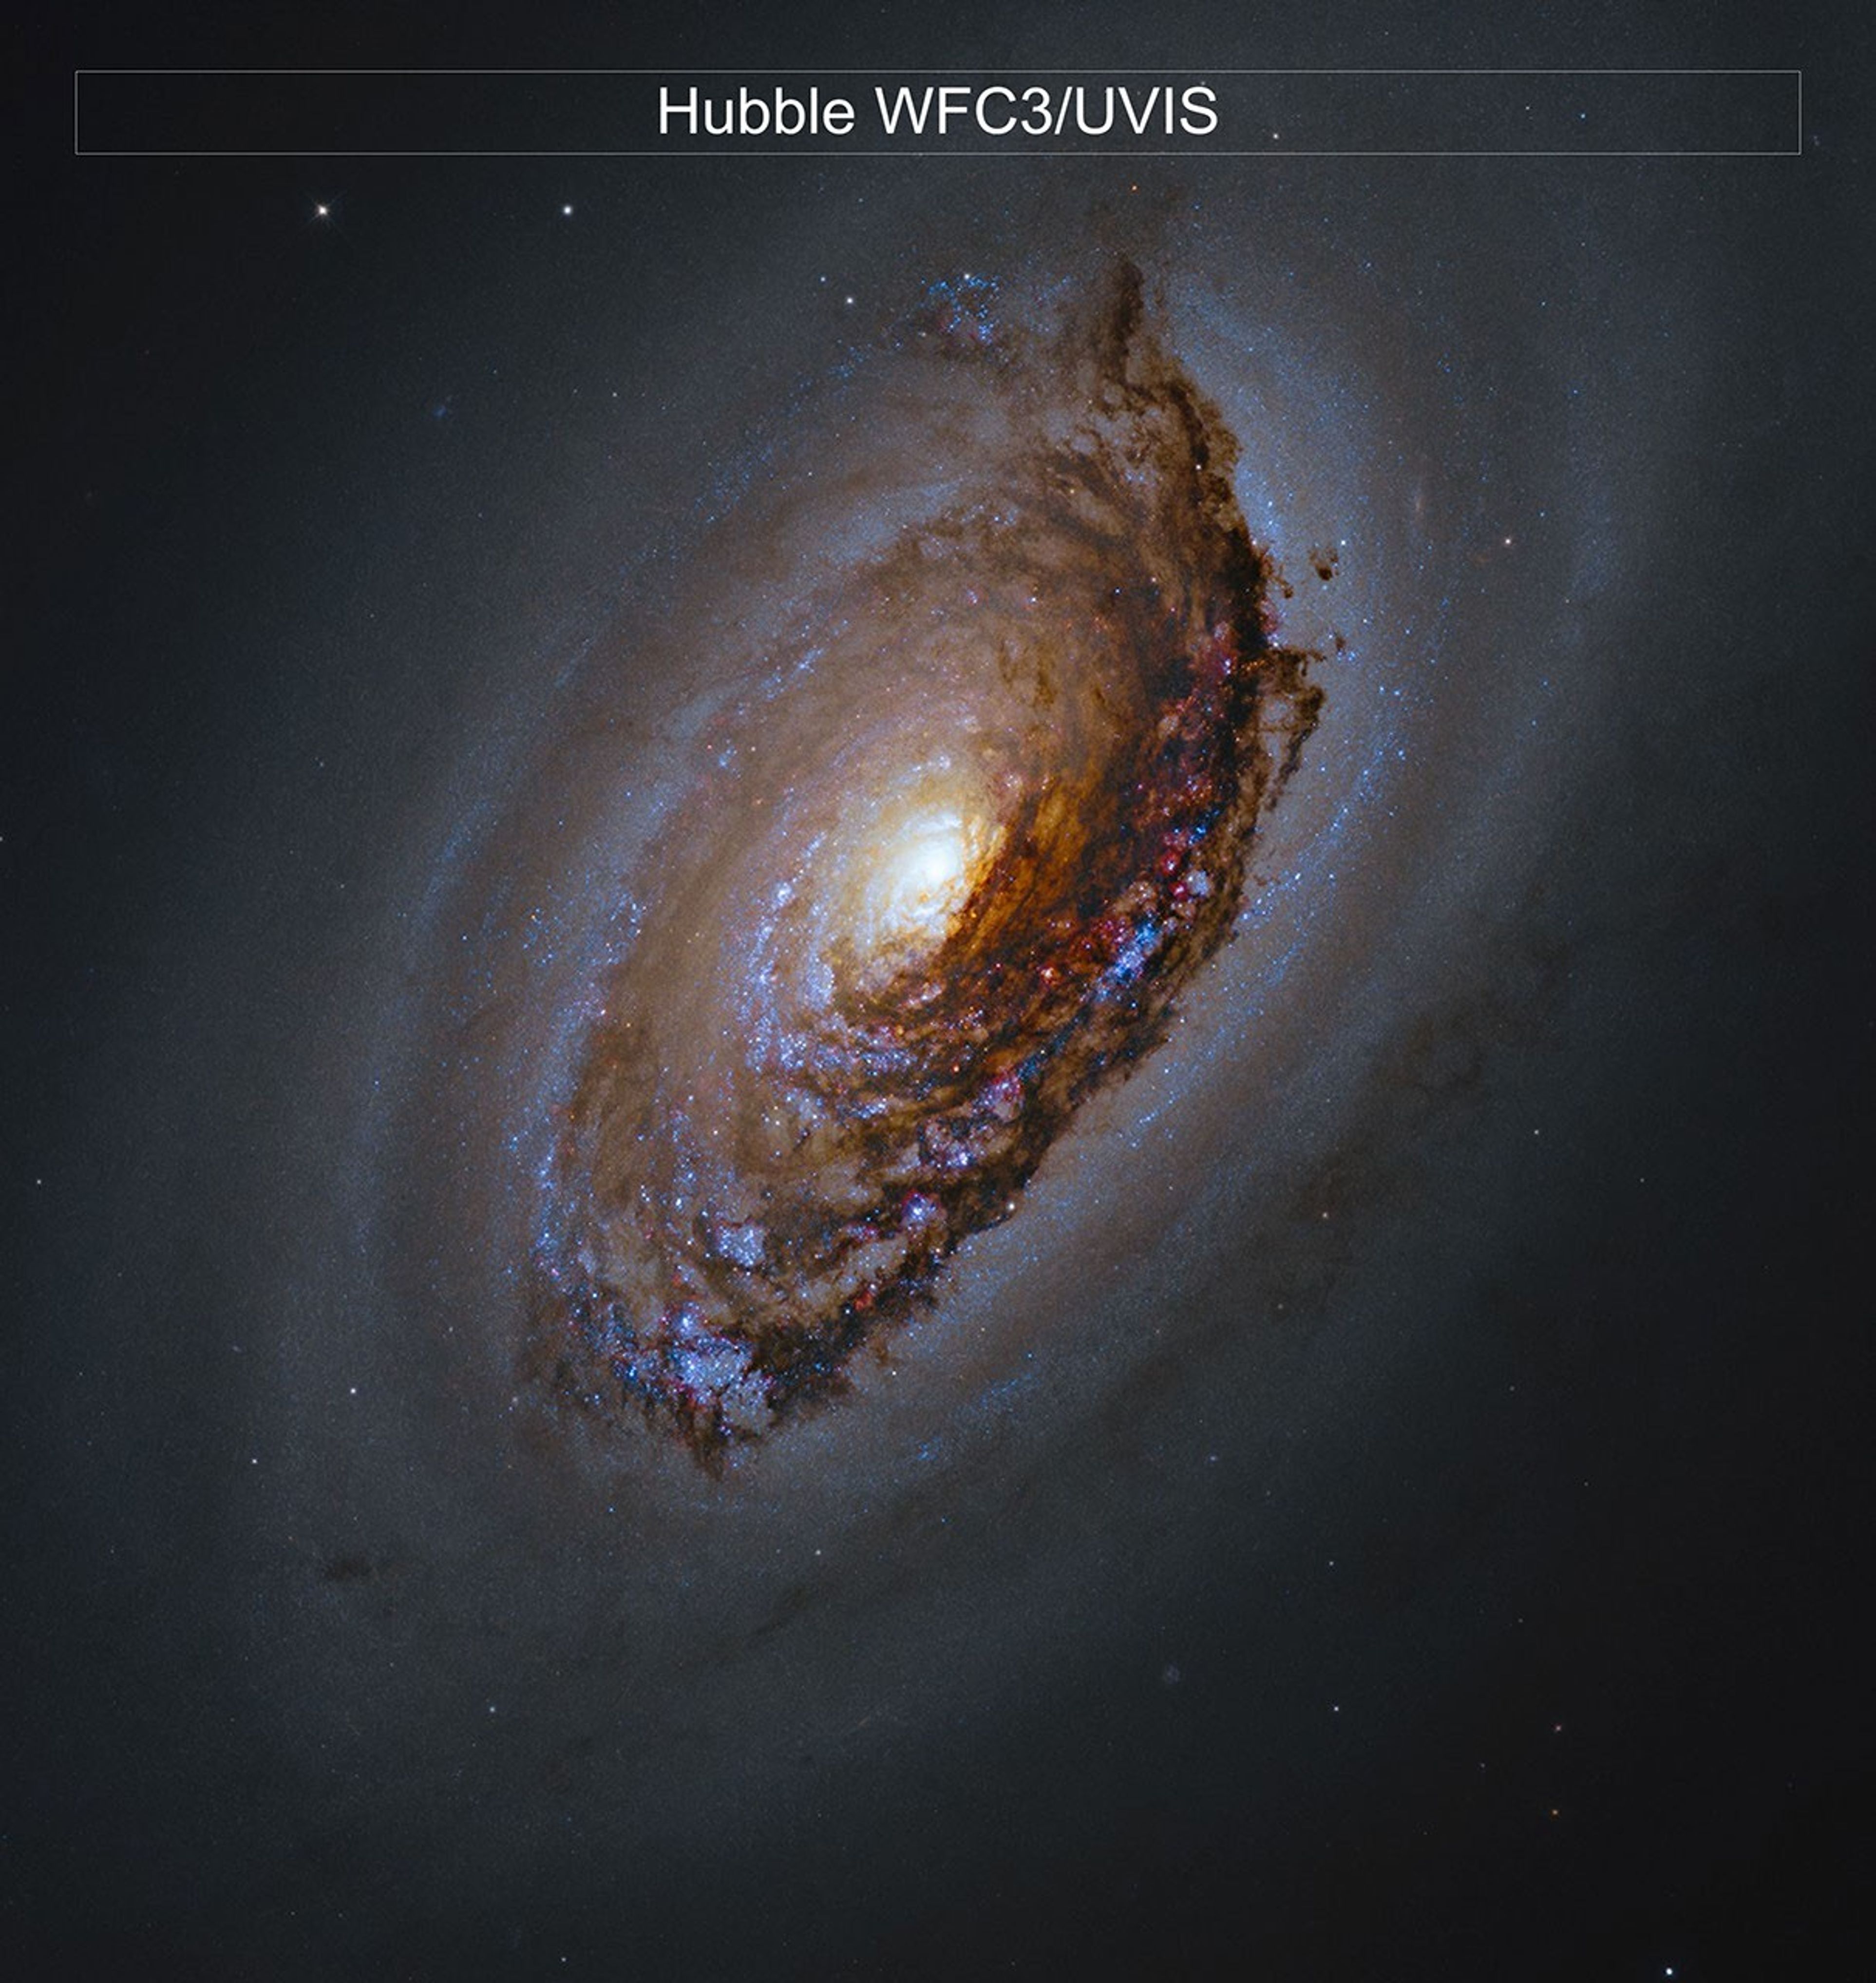
Webb’s View of M64
Explanation: Sometimes where Hubble finds darkness, Webb sees light. An example is today’s composite images of Messier 64 (M64), a nearby spiral galaxyof many names. The dark band of dust partially blocking its bright core earned it the moniker “the Black Eye Galaxy.” Webb’s Mid-InfraRed Instrument (MIRI) sees that dust, shown in red, as it absorbs and re-emits light from surrounding newborn stars. These young stars are embedded in pink star-forming regions in the Hubble-only image. M64’s inner and outer gas regions counter-rotate, creating regions of increased star formation where the two gas “currents” meet and compress. A merger between M64 and a smaller galaxy was likely the cause of the opposing motion of the outer gas. Spiral galaxies were once thought to have peaceful histories. M64 was key evidence that spiral galaxies, including the Milky Way, can and do experience mergers. Webb’s view of M64 will tell astronomers about the structure, motion, and composition of the galaxy’s dust and add context to the galaxy’s merger history and evolution.
Preparations for Next Moonwalk Simulations Underway (and Underwater)
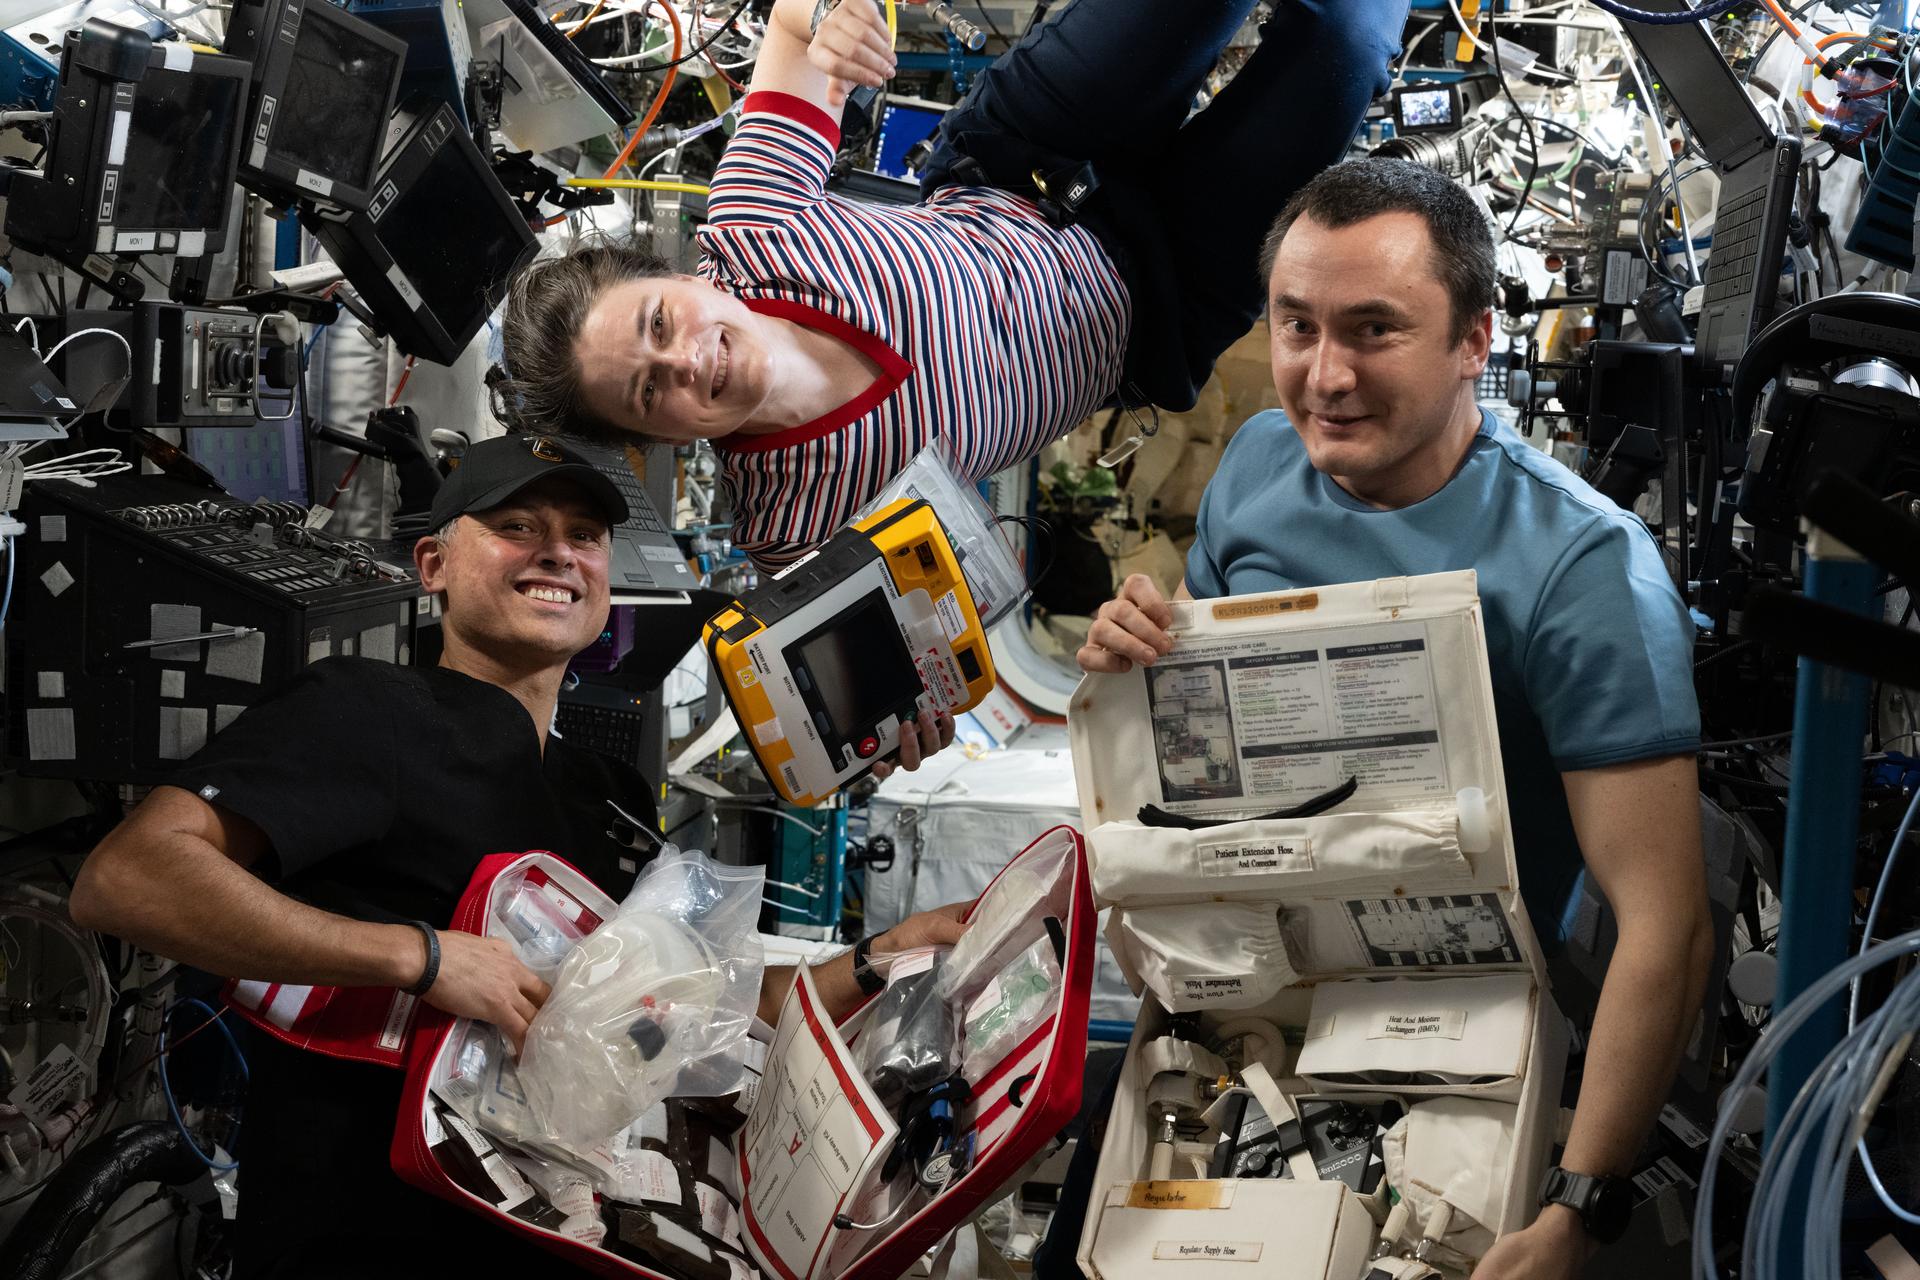
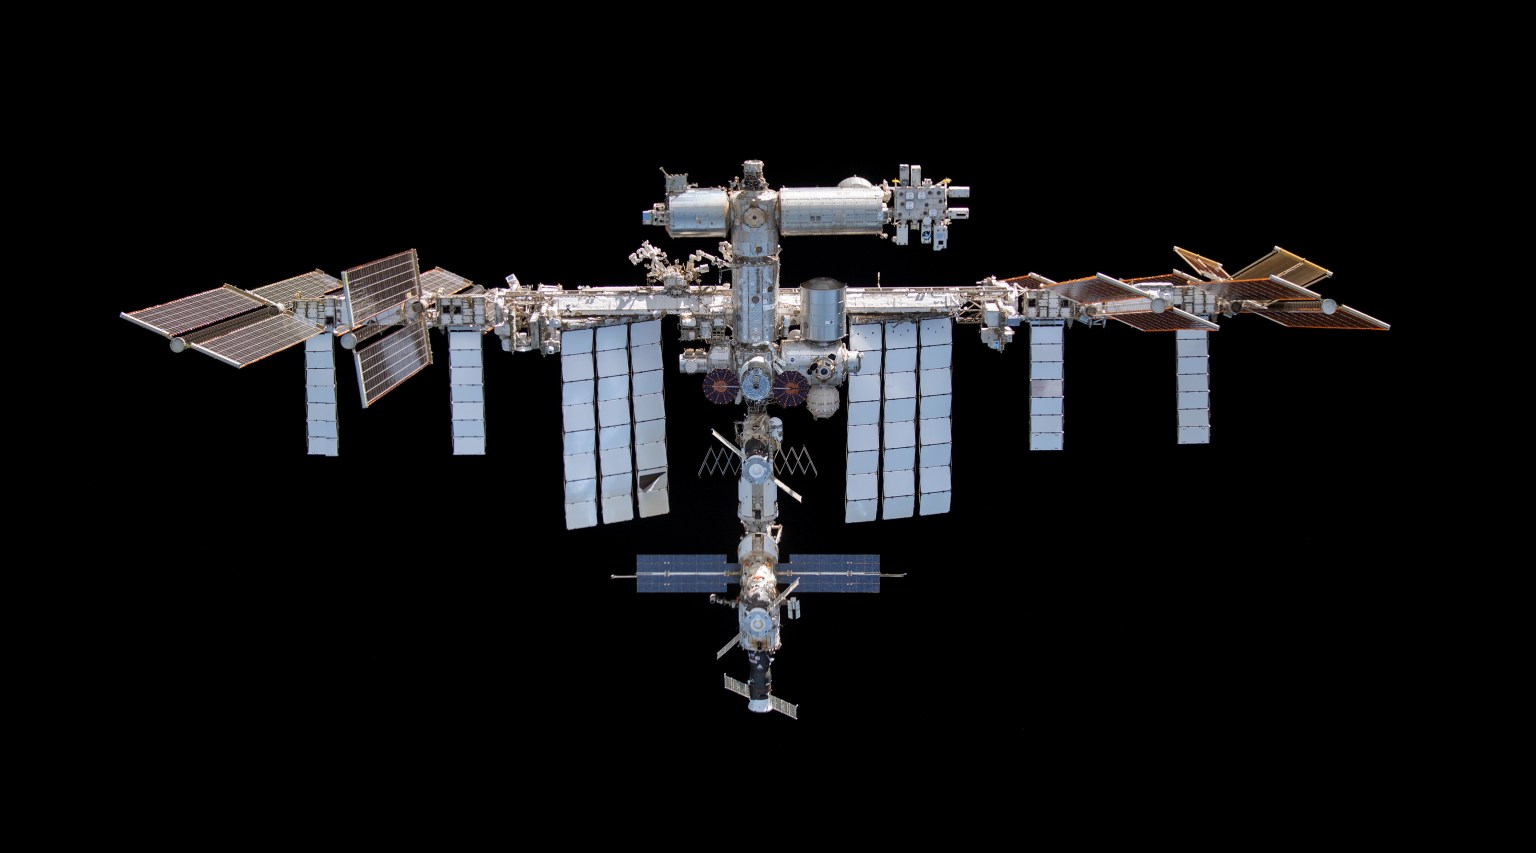
iss075e0088825 (Sept. 4, 2026) — Expedition 75 flight engineers Anil Menon of NASA and Anna Kikina and Pyotr Dubrov of Roscosmos smile for a portrait as they check out emergency medical equipment inside the International Space Station’s Destiny laboratory module.
Planning crewed missions to the Moon and Mars involves preparing for the medical realities of long-duration space travel. Factors like cosmic radiation, microgravity, and distance from Earth create unique health considerations for astronauts. To anticipate these needs ahead of time, NASA developed the Integrated Medical Model (IMM).
The IMM is a decision-support tool that uses medical evidence and computational modeling to forecast health risks before a mission launches.
How the Model Works
The IMM pulls from decades of flight records and clinical research compiled in NASA’s Integrated Medical Evidence Database (iMED).
Using Monte Carlo simulations, the tool models thousands of potential mission paths. Each run accounts for specific mission parameters, such as crew size, flight duration, planned spacewalks, and the spacecraft environment. This approach allows planners to evaluate risks for new mission profiles that lack historical precedents.
The model evaluates more than 100 medical conditions, ranging from common health concerns to hazards specific to spaceflight, like:
Decompression sickness
Radiation sickness
Space motion sickness
Smoke inhalation and barotrauma
Routine conditions like infections and kidney stones
Practical Applications for Mission Planning
The model generates several quantitative metrics to help teams prepare:
Total Medical Events (TME): The projected number of illnesses or injuries during the mission.
Crew Health Index (CHI): An indicator of the crew’s overall functional capacity.
Quality-Adjusted Time Lost (QTL): The estimated time spent diagnosing conditions, treating patients, and recovering.
Probability of Evacuation and Loss of Crew Life (EVAC / LOCL): The likelihood of a medical emergency requiring a mission abort or resulting in a fatality.
Resource Utilization: Projections of which medical consumables, medications, and tools the crew will need.
Because spacecraft carry strict mass and volume constraints, these outputs guide the composition of onboard medical kits (MedCap). Mission planners can balance necessary medical coverage against available cargo space with clear data in hand.
Planning for Greater Distances
On the International Space Station, emergency medical evacuation back to Earth can happen within hours. Deep-space exploration changes that timeline significantly, introducing communication delays and eliminating the option for a rapid return.
The IMM provides the data flight surgeons and engineers need to build resilient, self-sufficient medical systems for long journeys ahead.
Explore More
To dig deeper into how NASA prepares for the medical realities of space travel, explore the full IMM overview and supporting documentation:
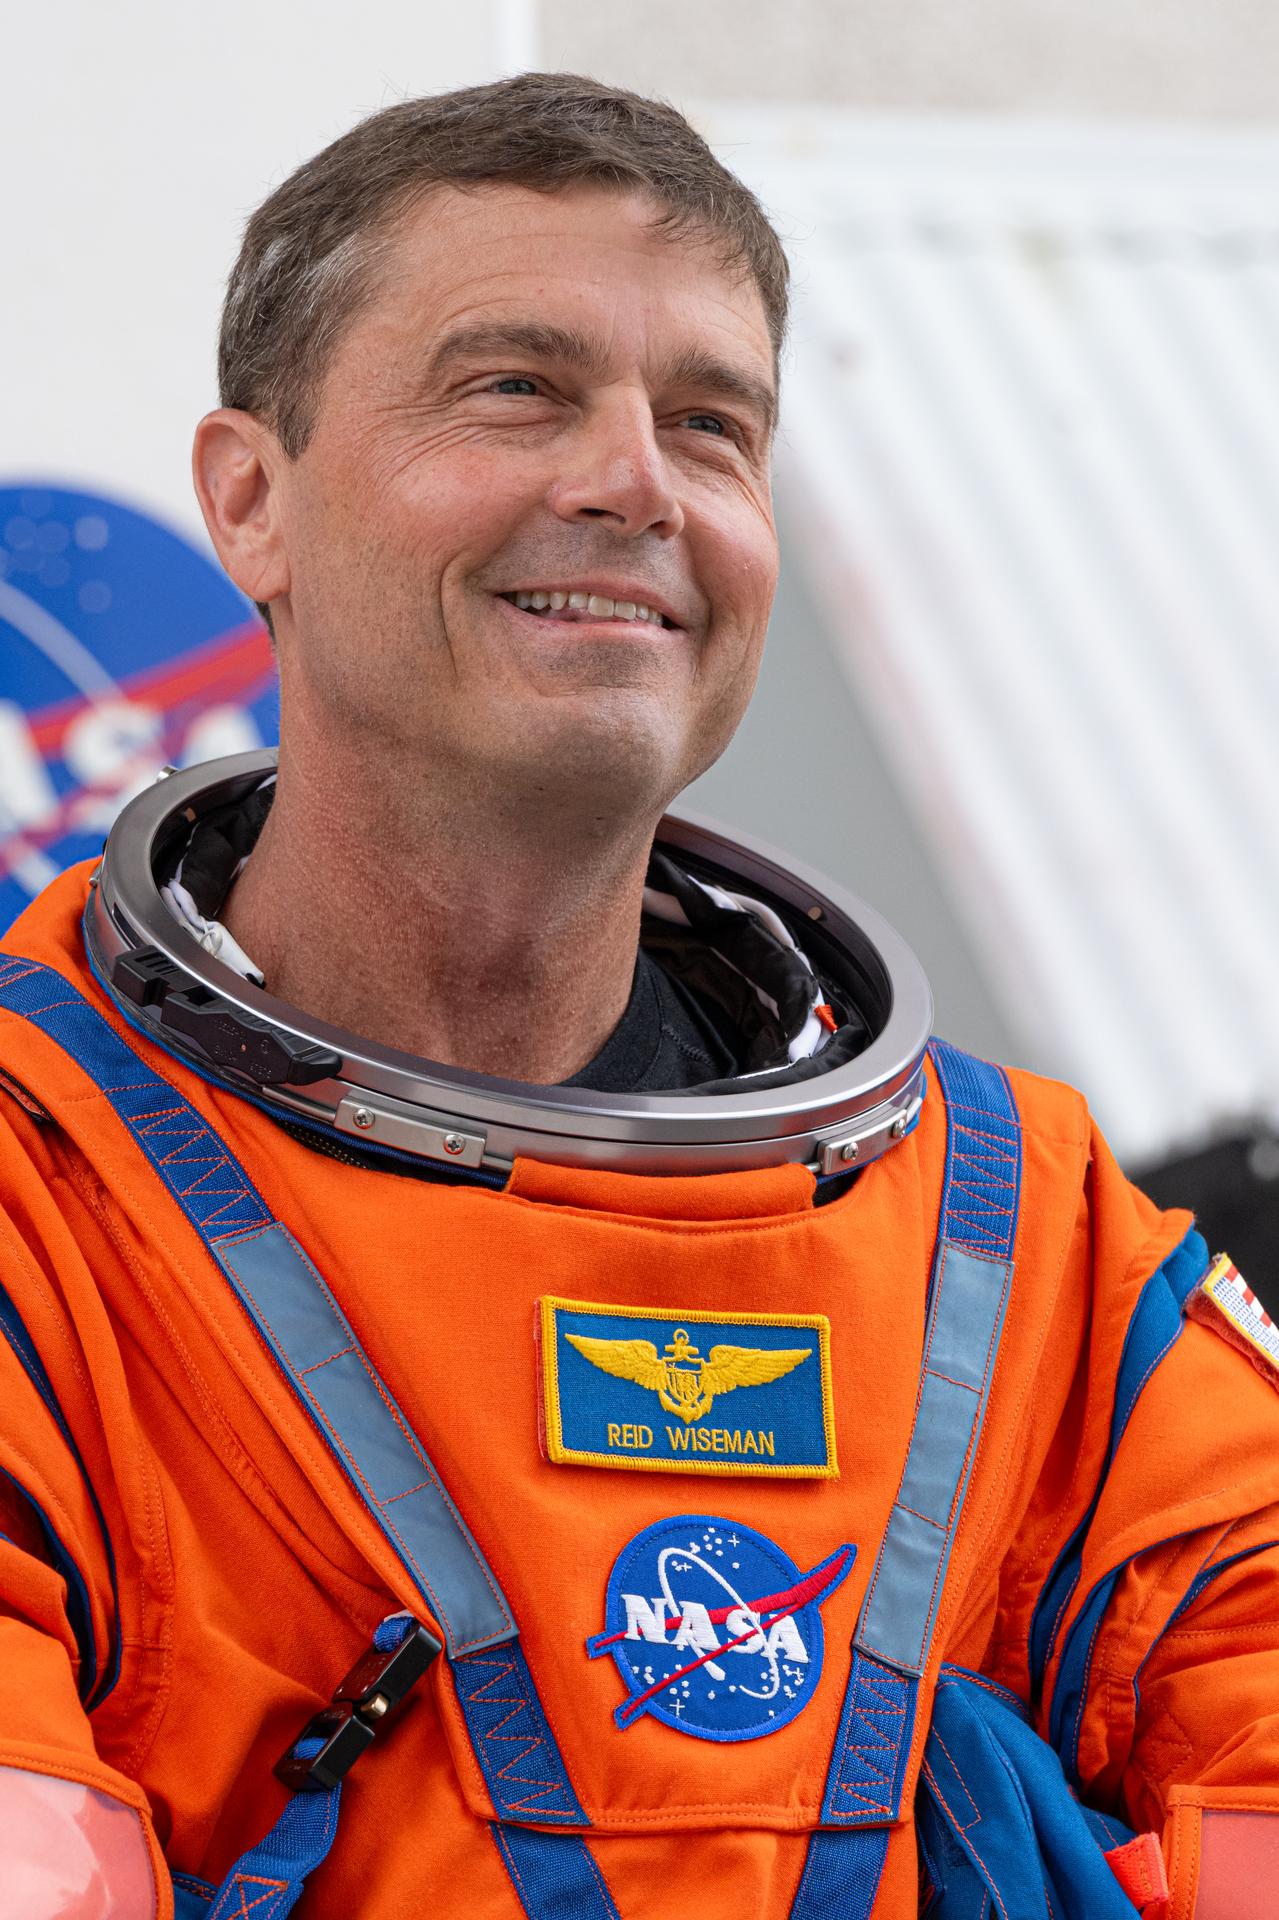
NASA astronaut Reid Wiseman prepares to depart the Neil A. Armstrong Operations and Checkout Building for Launch Complex 39B at the agency’s Kennedy Space Center in Florida to board NASA’s Artemis II SLS (Space Launch System) rocket and Orion spacecraft for the agency’s Artemis II launch on April 1, 2026.
Credit: NASA/John Kraus
As part of NASA’s new Inspiration Tour, Reid Wiseman, NASA astronaut and commander of the agency’s Artemis II mission, will highlight America’s strengths in space exploration and aeronautics innovation at the Baltimore Ravens vs. New Orleans Saints game in Baltimore on Sunday, Sept. 20.
A Baltimore native, Wiseman is a 27-year Navy veteran and NASA astronaut who spent 175 days in space over two missions. On April 1, Wiseman launched from NASA’s Kennedy Space Center in Florida on a SLS (Space Launch System) rocket as part of the Artemis II mission. Wiseman and his fellow Artemis II crew members completed a historic lunar flyby, marking humanity’s return to the vicinity of the Moon for the first time in more than 50 years.
Wiseman also will be available for media interviews inside the stadium at 12:20 p.m. To RSVP for the media availability, please contact Shaneequa Vereen at: [email protected].
NASA team members will engage with fans at the agency’s Experience Zone, located outside the stadium from 10 a.m. to 1 p.m. before the game. Fans can learn more about NASA’s return to the Moon through the agency’s Artemis program, enjoy interactive games, and capture photos at a selfie station and with a large, inflatable NASA logo.
With stops across the nation, NASA’s Inspiration Tour convenes academic, industry, and public sector stakeholders to connect the agency with the people, technologies, and organizations that drive American leadership in space.
The tour will culminate in MAX POWER, a public exposition of American air and space innovation, Saturday, Nov. 7, and Sunday, Nov. 8, on and near the agency’s Kennedy Space Center in Florida. Held in honor of America’s historic 250th anniversary, the multi-day, family-friendly event will showcase the next-generation aircraft, spacecraft, autonomous vehicles, and technologies that will help define the future of transportation in air and space.
For more information about MAX POWER and the agency’s missions, visit:
NASA recently awarded $10.5 million to seven organizations nationwide through its new State Hubs initiative. Space Florida was selected for Project ORBIT, which aims to expand opportunities for middle and high school students, boost enrollment in key career and technical programs, and create a statewide portal connecting skilled workers with aerospace employers.
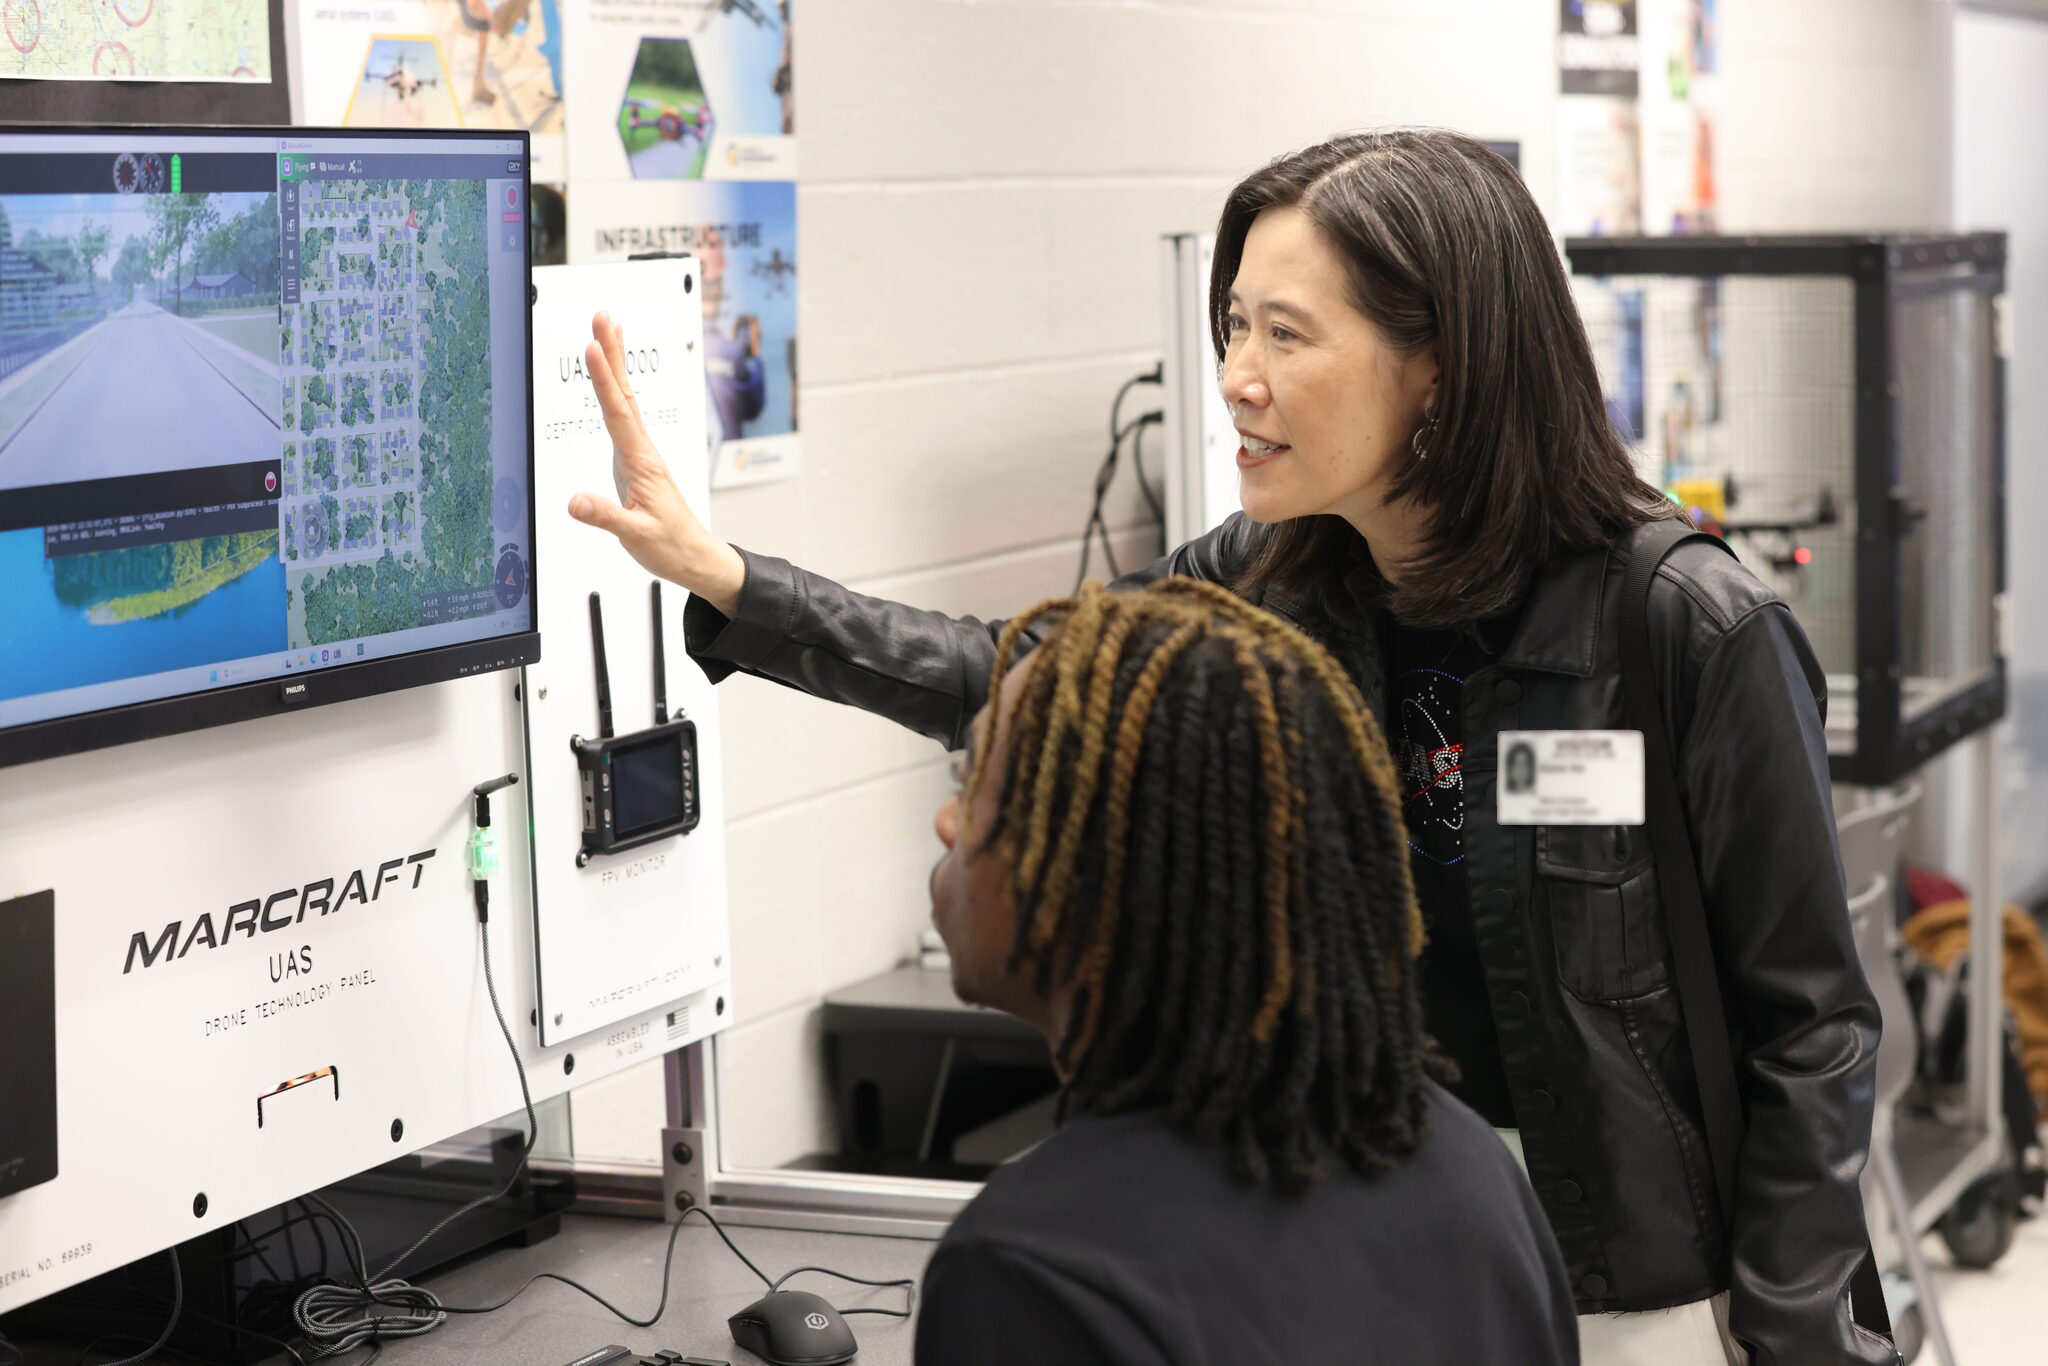
Elaine Ho, right, associate administrator for NASA’s Office of STEM Engagement, discusses training software with a student at Lyman High School in Longwood, Florida on on Aug. 27, 2026.
Credit: NASA/Clayton Rougelot
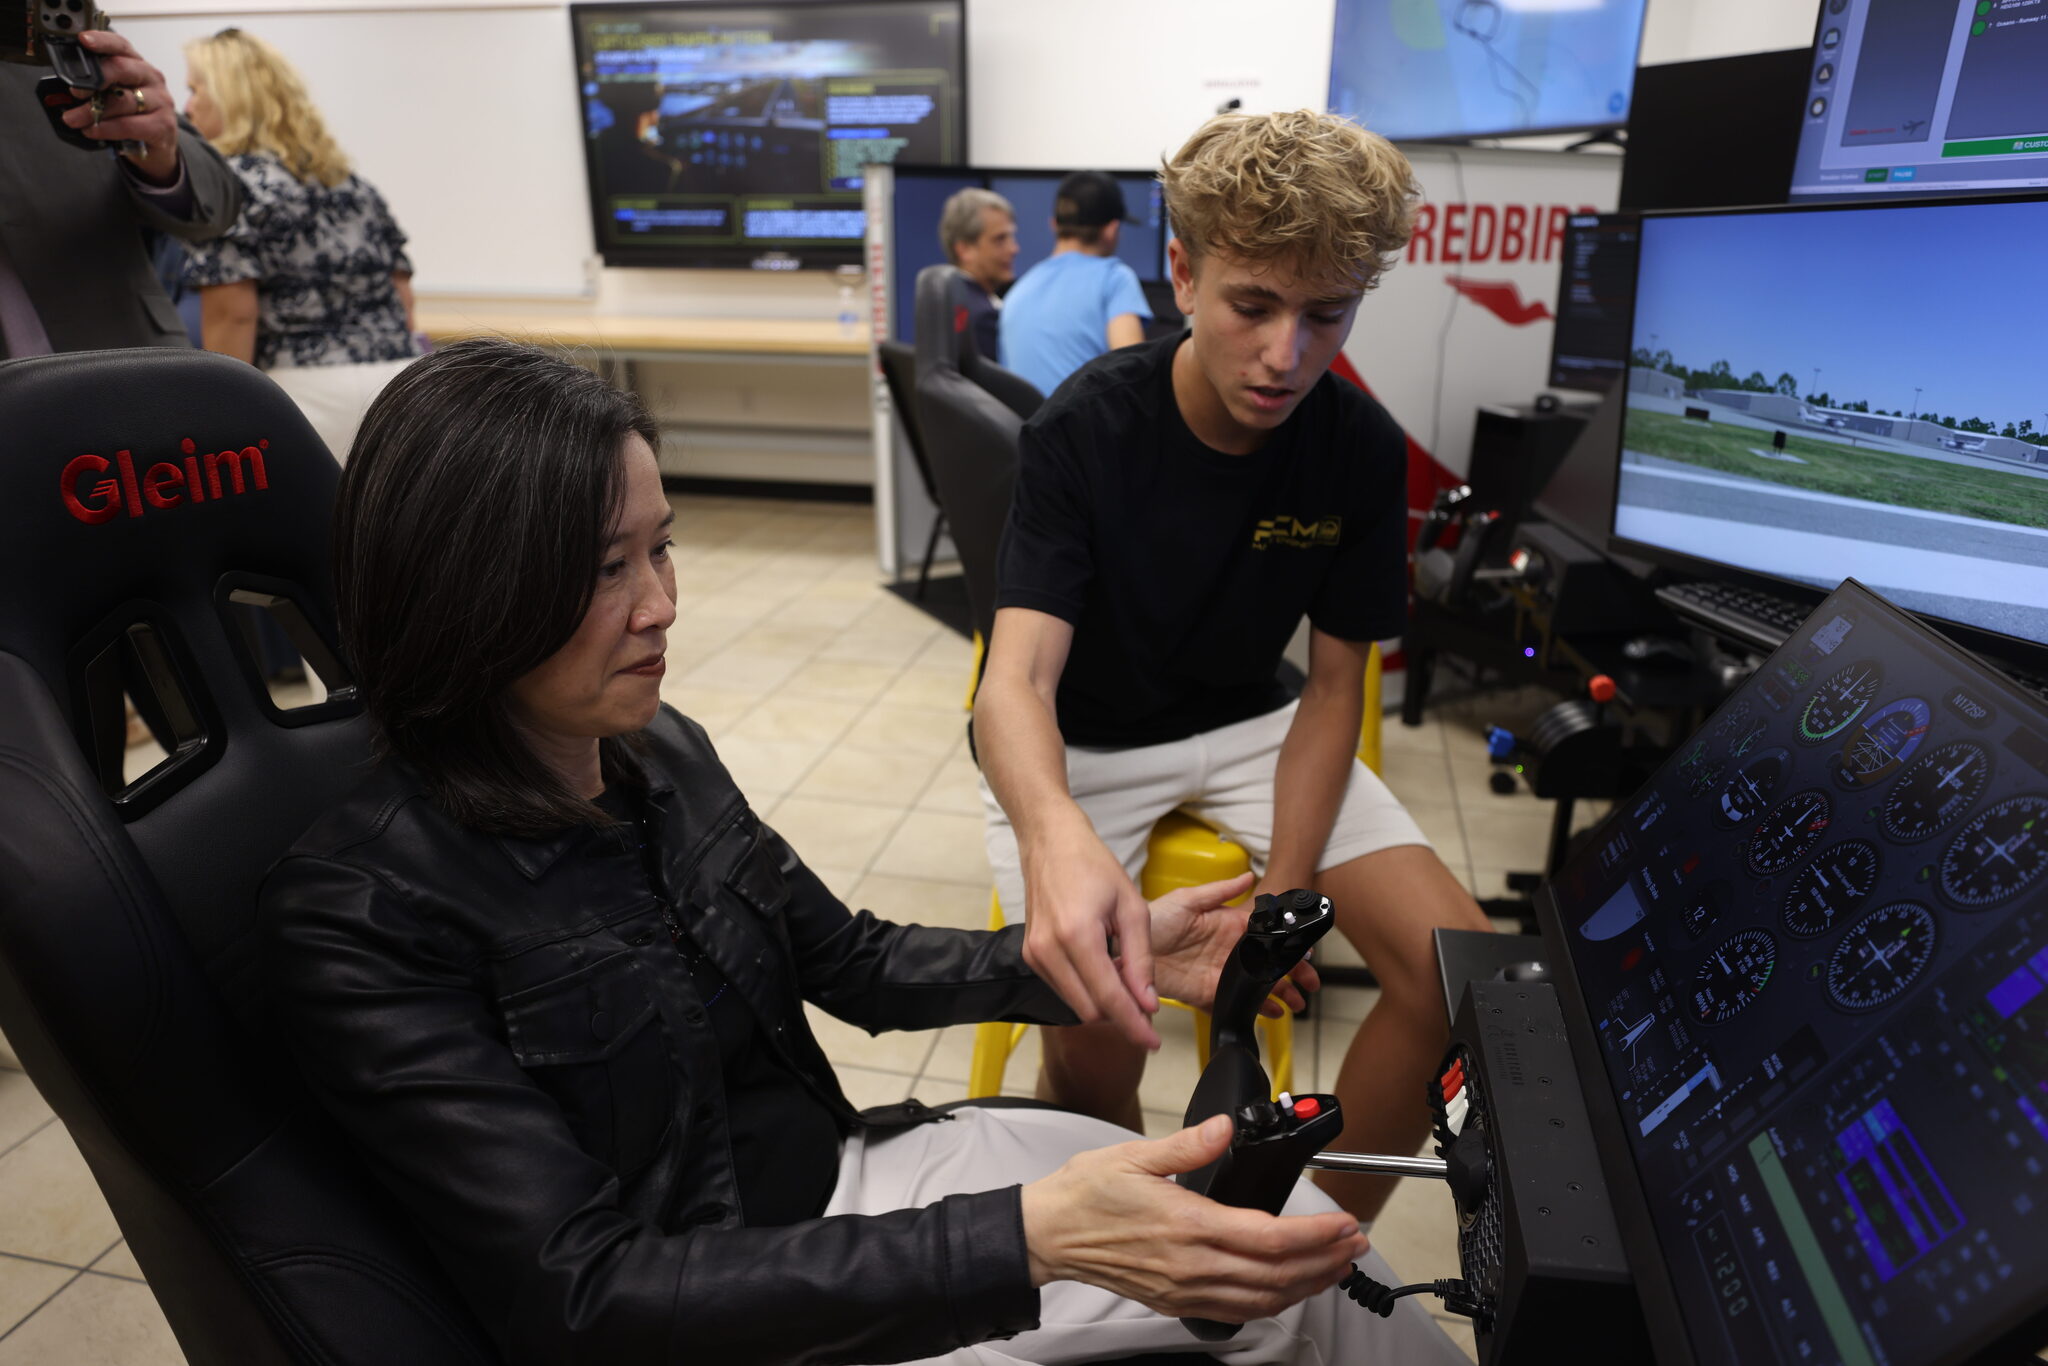
Elaine Ho, associate administrator for NASA’s Office of STEM Engagement, joined local leaders and industry partners recently to see Space Florida Academy students in action at three Central Florida schools. Students at Lyman High School in Longwood, Florida, demonstrated their skills in aerospace engineering, robotics, building trades, welding, and more. Later, in Merritt Island, Florida, Ho and the other leaders stopped by the Aeronautics & Flight Exploration (AFEX) program and cloud computing classrooms at Merritt Island High School and the robotics lab at nearby Edgewood Junior/Senior High School.
Since its launch in August 2024, the Space Florida Academy has expanded from 23 to 42 participating school districts, preparing students for careers in aviation and aerospace, advanced manufacturing, construction, cybersecurity, logistics, and semiconductors.
Elaine Ho, center, poses for a photo with Space Florida representatives, public school officials, aerospace industry partners, and students at Edgewood Junior/Senior High School in Merritt Island, Florida on Aug. 27, 2026.
Credit: NASA/Clayton Rougelot
“It’s all about showing students what’s possible and then giving them the tools to achieve it,” said Dean Cuke, Merritt Island High School AFEX astronautics and aviation flight instructor. “There are far more possible pathways to be part of the space industry than I think they realize. We’re showing them ways that they can attain that, through learning, through motivation and chasing after their dreams. I’m excited for them.”
Merritt Island High School juniors and student pilots Olivia Street and Troy Wallenburg have both benefited from the program.
“It makes you feel like you’re a part of something way bigger than just a high school class. I learned what I want to do when I grow up – to be a pilot,” Street said.
“My entire life, I’ve just loved space,” Wallenburg said. “It’s great knowing that I’m actually somewhat involved in it, too.”
A student in the Merritt Island High School Aeronautics and Flight Exploration program shows Elaine Ho, left, how to use a flight simulator on Aug. 27, 2026.
Credit: NASA/Clayton Rougelot
“I’m so impressed by how this region holds so many opportunities for our students, who are incredibly capable of solving hard problems, who can build our hardware, who want to be part of something bigger than themselves,” Ho said. “NASA is really focused on ensuring that those opportunities are easier to reach.”
Curiosity Postcard Celebrates Rover’s 5,000th Day on Mars
PIA26700
Credits: NASA/JPL-Caltech
Downloads
Curiosity Postcard Celebrates Rover’s 5,000th Day on Mars
JPEG (459.76 KB)
Description
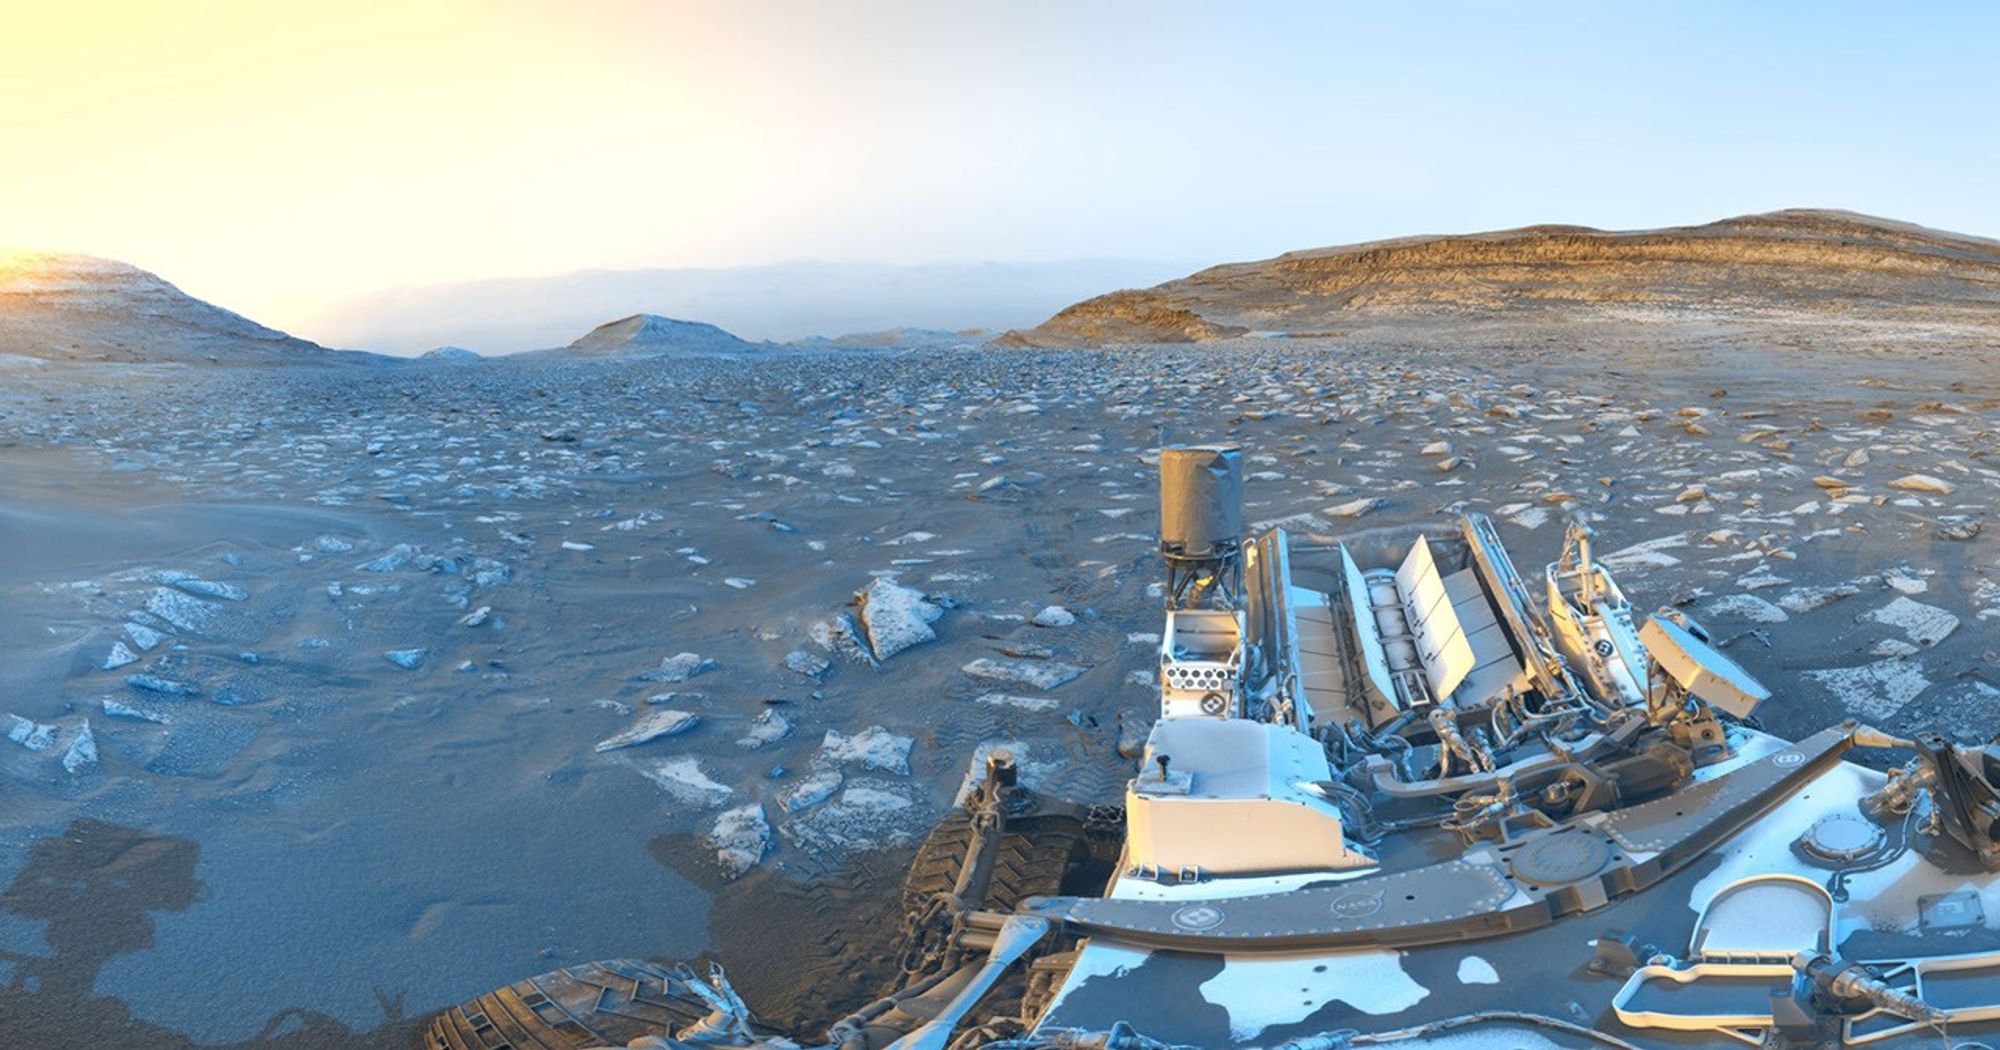
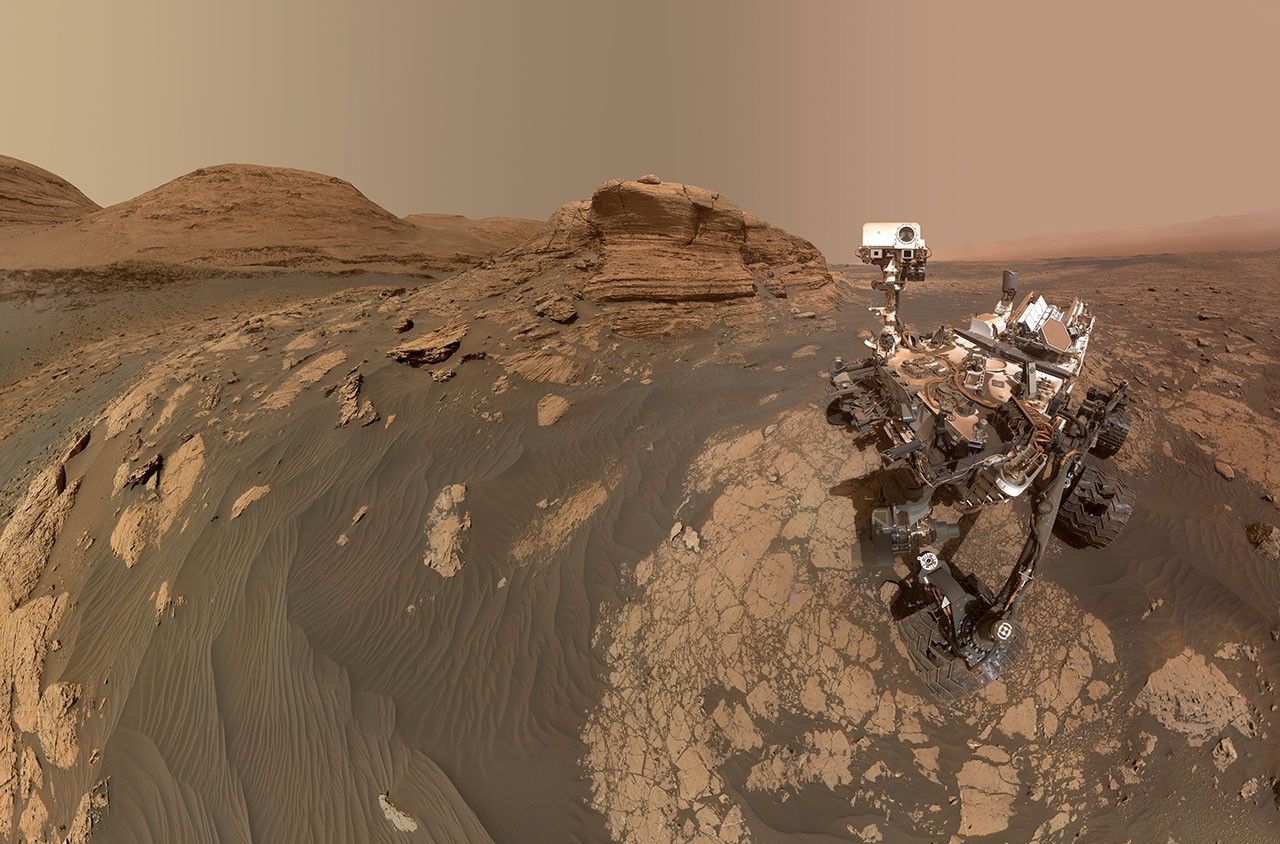
While parked at a sand ridge nicknamed “Chocolatal,” NASA’s Curiosity Mars rover used its black-and-white navigation cameras to capture panoramas at two times of day. The first was taken on Aug. 30, 2026, at 9:56 a.m. local Mars time; the second was taken on Sep. 2, 2026, at 5:39 p.m. local Mars time. Those dates correspond to the 5,000th and 5,003rd Martian days, or sols, of the mission.
After being sent back to Earth, the two images were merged together. Color was added for an artistic interpretation of the scene, with blue representing the morning panorama and yellow representing the afternoon one. The resulting “postcard” is similar to past examples created with rover images, such as one taken in November 2021.
The rover’s deck can be seen in the foreground, including its can-shaped UHF antenna, used for sending data to orbiting spacecraft, and its finned Multi-Mission Radioisotope Thermoelectric Generator (MMRTG), a nuclear power source, at its rear. The rover’s tracks can be seen trailing off in the distance.
Curiosity is in the lower foothills of Mount Sharp, a 3-mile-tall (5-kilometer-tall) mountain that sits within Gale Crater. This image looks down toward the crater floor, with the crater rim barely perceptible on the horizon.
Curiosity was built by NASA’s Jet Propulsion Laboratory, which is managed by Caltech in Pasadena, California. JPL leads the mission on behalf of NASA’s Science Mission Directorate in Washington as part of NASA’s Mars Exploration Program portfolio.
Anak Krakatau erupts ash and volcanic gases in this Sept. 5, 2026, image acquired with the OLI (Operational Land Imager) on Landsat 8. Eruptions are a regular occurrence at Anak Krakatau, a small volcano between the Indonesian islands of Java and Sumatra. Much of its activity remains relatively mild, but it occasionally puts on more impressive and hazardous shows of force. In early September 2026, a booming eruption lasting more than 24 hours sent gas and ash high into the atmosphere, disrupting thousands of flights and degrading air quality in parts of the country, including the capital city of Jakarta.
Preparations for Next Moonwalk Simulations Underway (and Underwater)
Water sloshing between the land and oceans shifts Earth’s center of mass relative to its geometric center. NASA scientists have developed a new technique using ultraprecise satellite tracking to estimate the displacement to within fractions of inches.
NASA’s Scientific Visualization Studio
Seasonal changes redistribute enough water around Earth to shift the planet’s center of mass back and forth by fractions of an inch relative to its geometric center. NASA scientists are on the case, tracking the oscillations because Earth’s center of mass is a crucial reference point for satellite navigation and elevation measurements.
A team, led by NASA’s Jet Propulsion Laboratory in Southern California, has proposed a way to calculate the seasonal swings with extreme precision. The technique and findings are detailed in a new study published in Geophysical Journal International. The authors paint a vivid picture of springtime thaws, churning oceans, and dense winter air shifting massive surface loads from season to season.
The study isn’t the first attempt to pin down Earth’s center of mass. Scientists over the decades have pioneered several space-based techniques to define and locate it. But it’s a moving goalpost. If Earth were a hard blue marble, its center of mass would simply overlap its geometric center. In reality, the planet is sloshing and sagging under the weight of water, ice, and air. Because of this, Earth’s center of mass continually swivels around its geometric center by as much as several millimeters.
NASA’s Space Geodesy Project currently uses a variety of space- and land-based techniques to track Earth’s center of mass (also called the geocenter) moving up and down and side to side. This animation traces the millimeter-scale motion from 1993 to 2017.
NASA’s Scientific Visualization Studio
How accurate are existing methods to measure the size of the swivel? The last two international estimates, made in 2017 and 2023, differ by 0.27 inches (7 millimeters), about the height of three stacked nickels. The difference is almost as large as the motion itself.
To reduce uncertainty, JPL geoscientist Donald Argus led the development of a new technique based on ultraprecise satellite tracking.
Driven by gravity, satellites naturally orbit Earth’s center of mass, as if bound by invisible tethers. Tiny changes in the distance between satellites and ground stations reflect Earth’s shifting center of mass.
Using satellites to locate Earth’s center of mass is not a new idea. In fact, dense metal satellites, launched in 1976 and 1992, are dedicated exclusively to this purpose. Resembling 900-pound (408-kilogram) disco balls, both Laser Geodynamics Satellites (LAGEOS 1 and 2) are studded with reflective prisms and tracked with laser precision via ground stations globally distributed across more than 20 countries.
However, one limitation of satellite laser ranging is the uneven distribution of ground stations around Earth. The new technique improves accuracy in two ways: It adds GPS tracking into the mix along with orbital data from several satellites in low Earth orbit to provide a diverse array of targets. And it considers how the weight of water and ice deforms Earth’s crust, taking ground stations along for the ride.
The technique was developed by Argus along with researchers from JPL’s satellite orbit determination team, the University of Nevada, University of Montana, and the Helmholtz Centre for Geosciences in Germany.
“We’re now estimating the size of the movement of Earth’s mass center back and forth each year to be about half of what we believed it to be eight years ago,” said Argus. “Our findings suggest that the mass of Earth’s water and air moving between the hemisphere is smaller than previously thought.”
Felix Landerer, one of the study’s coauthors at JPL, noted that “while these movements might appear tiny, our modern world relies on extremely accurate positioning measurements. By unraveling and understanding the mechanisms that change reference systems, we can build better reference systems that ultimately benefit mapping and navigation — from global shipping logistics to precision agriculture.”
What they found
The study authors tracked Earth’s center of mass oscillating seasonally and attributed the cause to three categories: oceans, atmosphere, and continental water (made up of land ice, snow, lake and river water, soil moisture, and groundwater).
They found that snow accumulation in North America and Eurasia reaches a maximum in March and shifts Earth’s center of mass about 3 millimeters toward the North Pole. A month later, in April, rainwater in the Amazon River basin peaks at 2,400 gigatons, swinging Earth’s center of mass 2.2 millimeters toward South America. Monsoon water in southeast Asia attains a maximum of 600 gigatons six months later in November, adding slightly to the annual oscillation.
Between August and October, the oceans swell with meltwater and rain, and Earth’s center of mass shifts toward the South Pacific Ocean. The Pacific Ocean is so large that mass changes there overshadow the loss or gain in other oceans, though seasonal dynamics in the Mediterranean, Red, North, Baltic, and Barents seas all help shift Earth’s center of mass in their own small way.
The researchers used a model developed by the European Centre for Medium-Range Weather Forecasts to estimate how atmospheric changes affect Earth’s center of mass throughout the seasons. They found that cold, dense, winter air helps tip the scales over Arabia, Asia, and northern Africa around Dec. 21 each year, and over South America and South Africa around June 21.
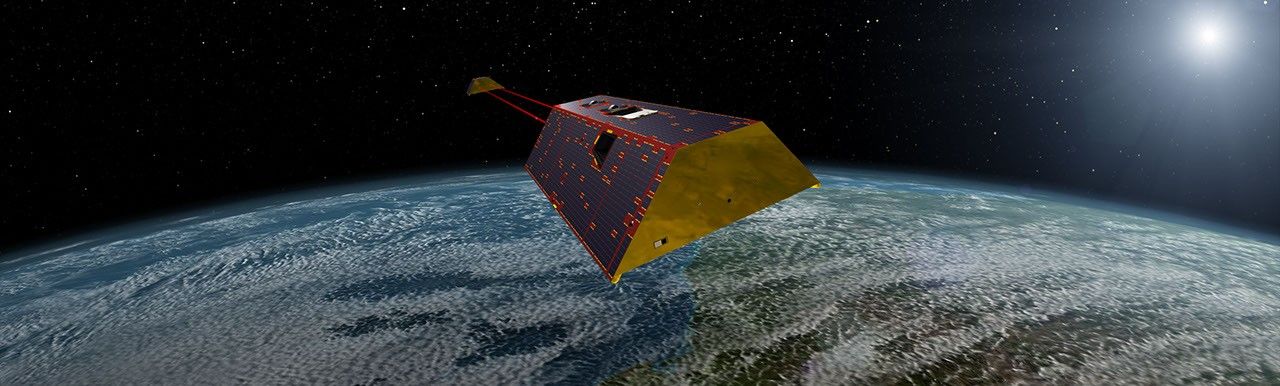
The mass calculations in the study are consistent with observations made by the Gravity Recovery and Climate Experiment Follow-On (GRACE-FO) mission. Launched in 2018, the mission is made up of twin satellites that map monthly fluctuations in Earth’s gravitational pull due primarily to the mass movement of water above and below ground. The two satellites fly in precise formation, and when the lead satellite passes over a dense body, like a swollen river basin, the extra gravitational tug changes the distance between its twin by a small but measurable amount.
The GRACE-FO mission is a joint partnership between NASA and the German Research Centre for Geosciences (GFZ). The next-generation GRACE-Continuity (GRACE-C) mission is targeting a launch in late 2028 to extend the nearly 25-year GRACE-series data record.
A zoomed-in view of the Moon made from images from NASA’s Lunar Reconnaissance Orbiter Camera. (More information at the bottom of article.)
Credits: NASA Goddard/Intuitive Machines/Robert Wagner
It started as a routine data-quality check. But as Robert Wagner, a scientist with NASA’s Lunar Reconnaissance Orbiter (LRO), scanned a giant Moon map on his computer screen, an unusually large bright spot circled by a dark halo caught his eye, as it implied that surface material in that area had been shaken up.
“I just stopped, dropped everything, and started looking into what that spot was,” said Wagner, an image-processing specialist from Intuitive Machines who works with data from the Lunar Reconnaissance Orbiter Camera (LROC) system.
By comparing before and after images of the Moon, Wagner realized he had discovered the largest, newly formed crater ever found in the solar system, as scientists reported Wednesday in Science Advances. This discovery highlights the value of NASA’s Moon orbiter data in studying a dynamic landscape as the agency advances a sustained human presence and expanded scientific and commercial activity on the Moon.
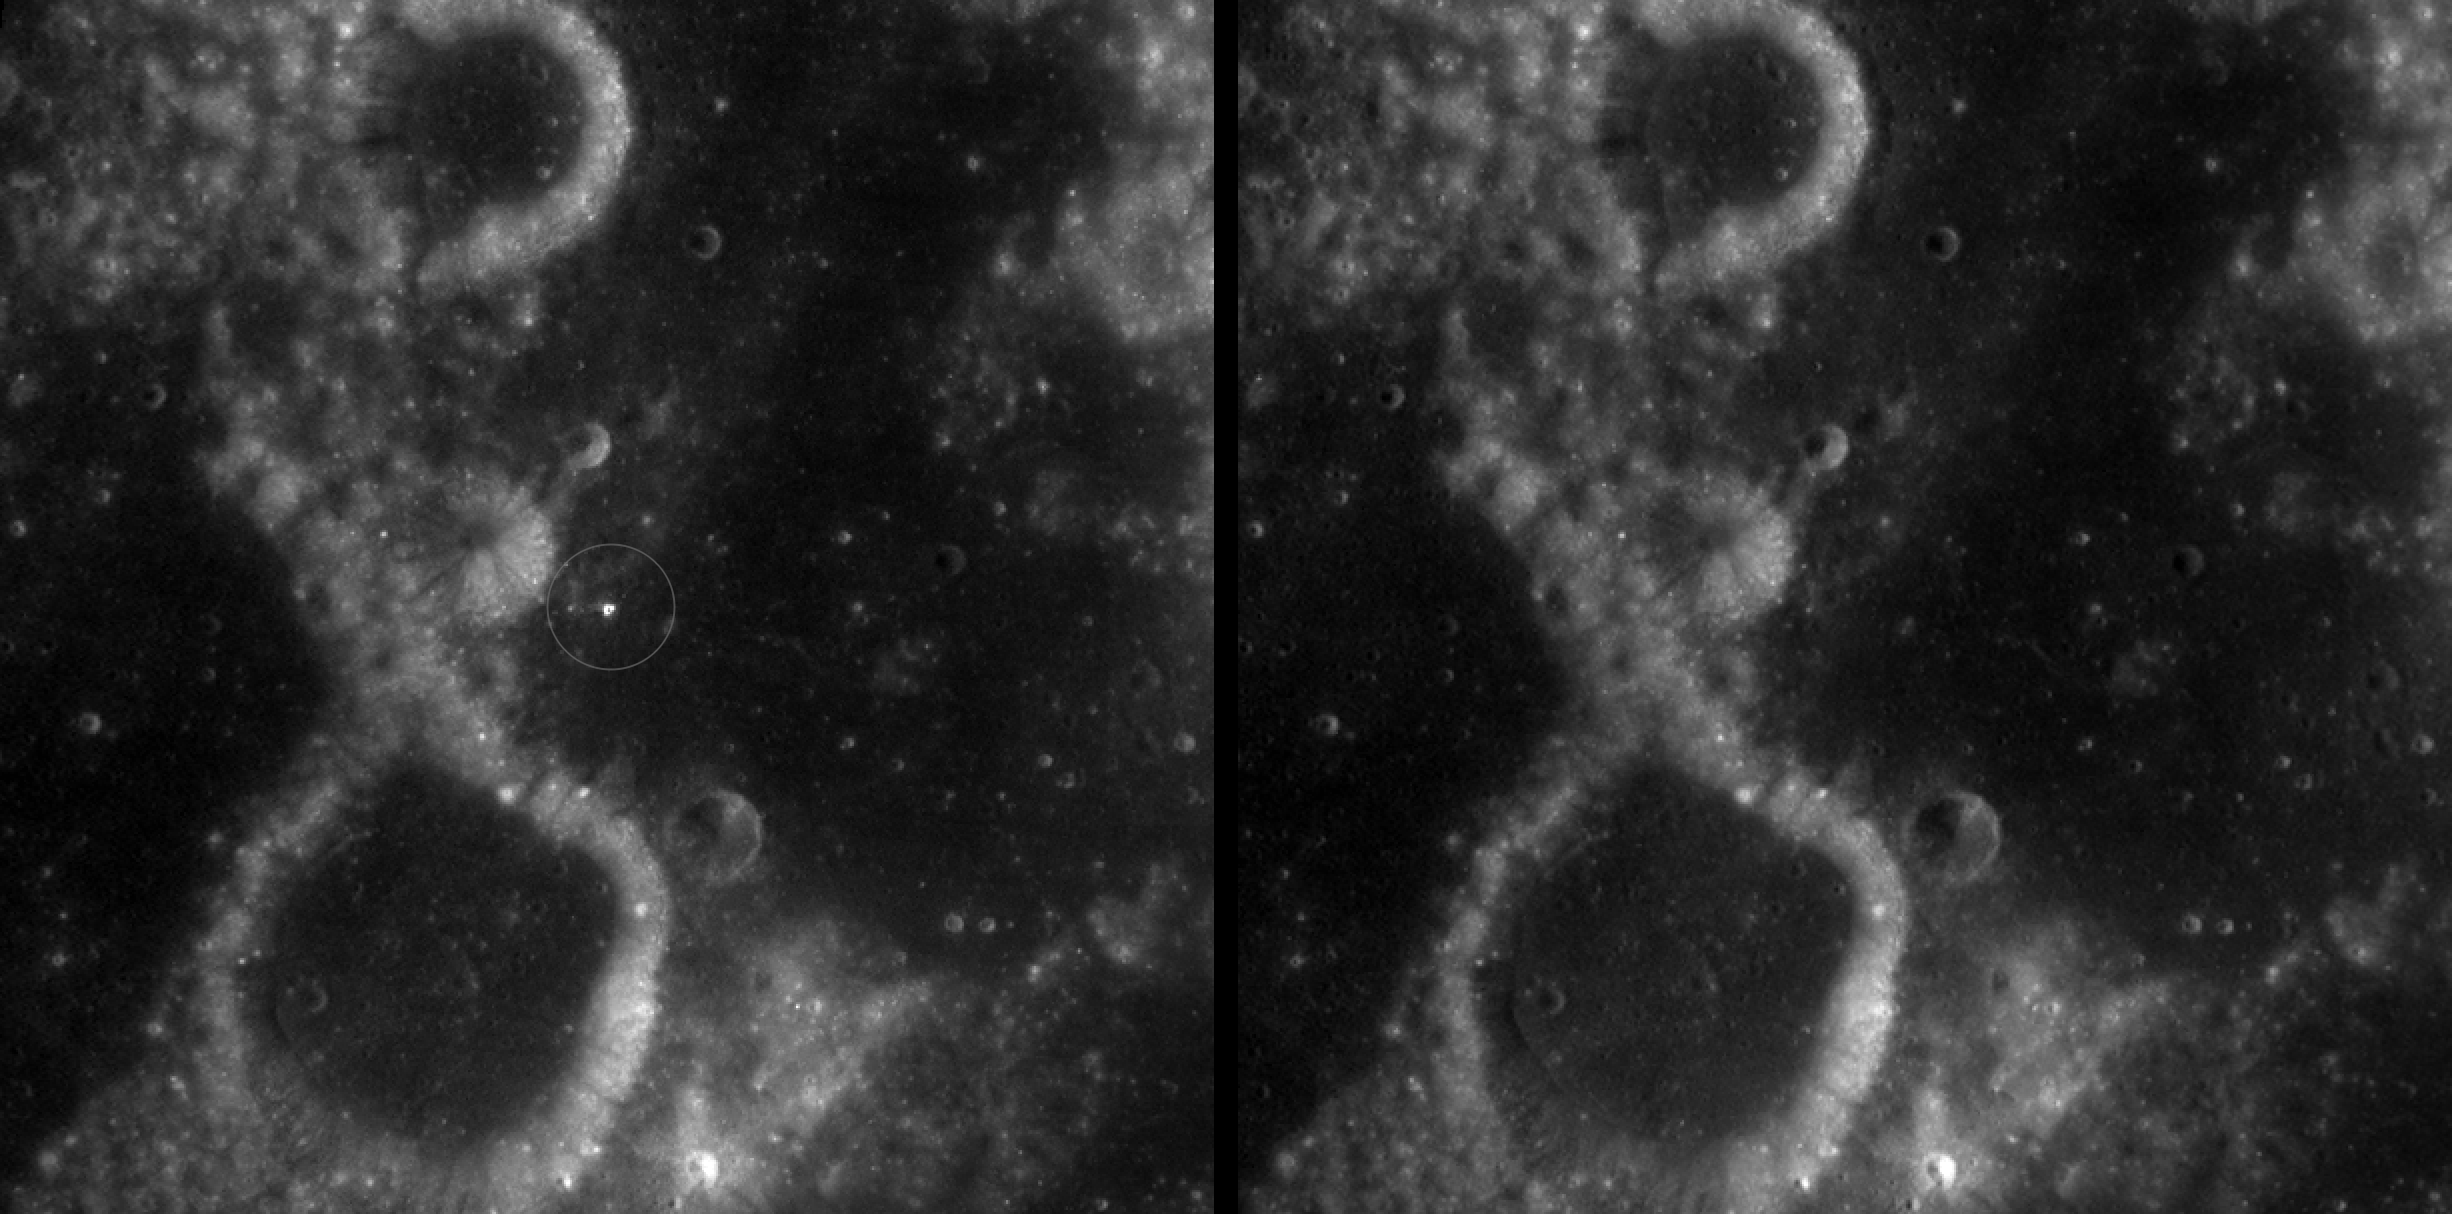
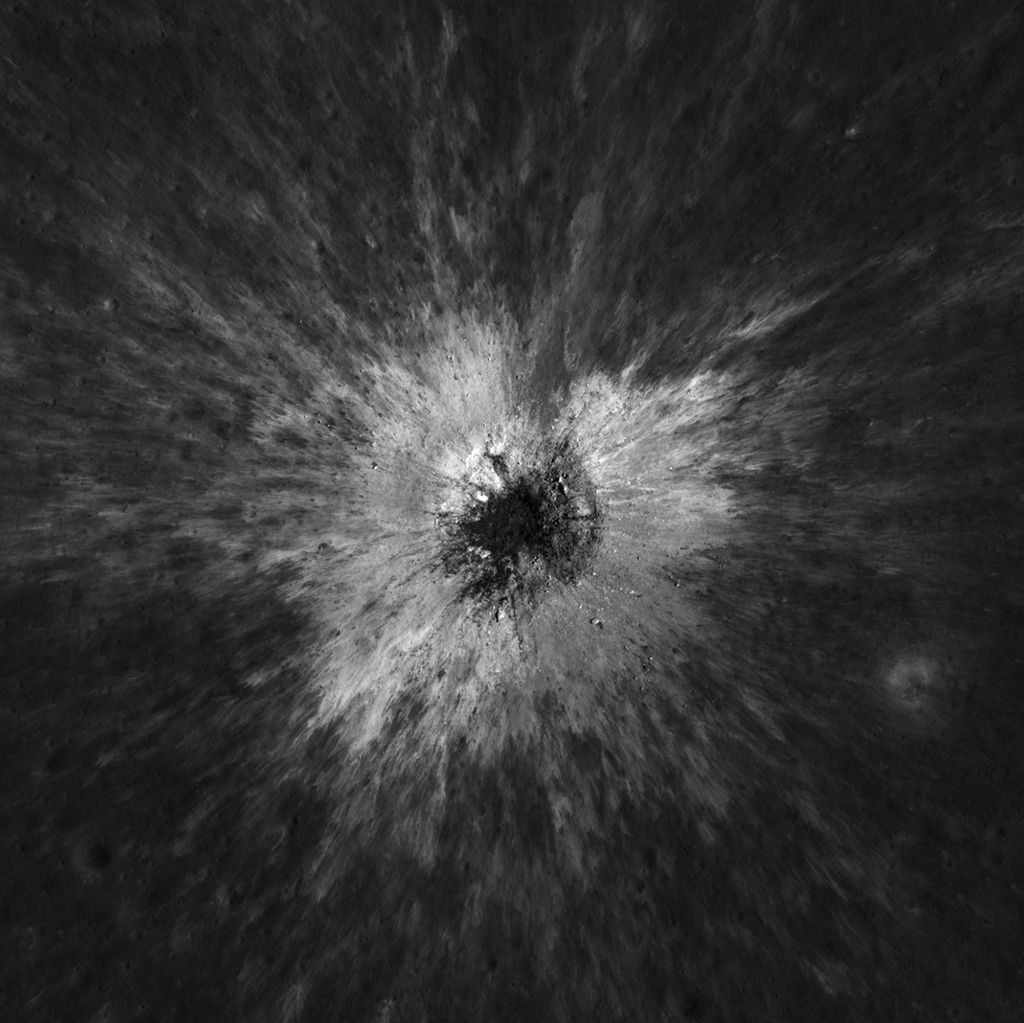
A zoomed-in view of McGetchin crater, circled on the left, next to a “before” image on the right. The panel on the left is made from images captured by NASA’s Lunar Reconnaissance Orbiter Wide-Angle Camera in summer 2025; the right panel was made from images taken in spring 2011. The white spot is not the crater itself, but rather material flung out of the crater, which formed when a rock, possibly this size of a three- to six‑story building, crashed into the Moon between April 11 and May 22, 2024 – a once-in-a-century event, as scientists reported on Sept. 15, 2026, in a pair of papers in Science Advances. The area shown in the images is 38 miles wide.
NASA Goddard/Intuitive Machines/Robert Wagner
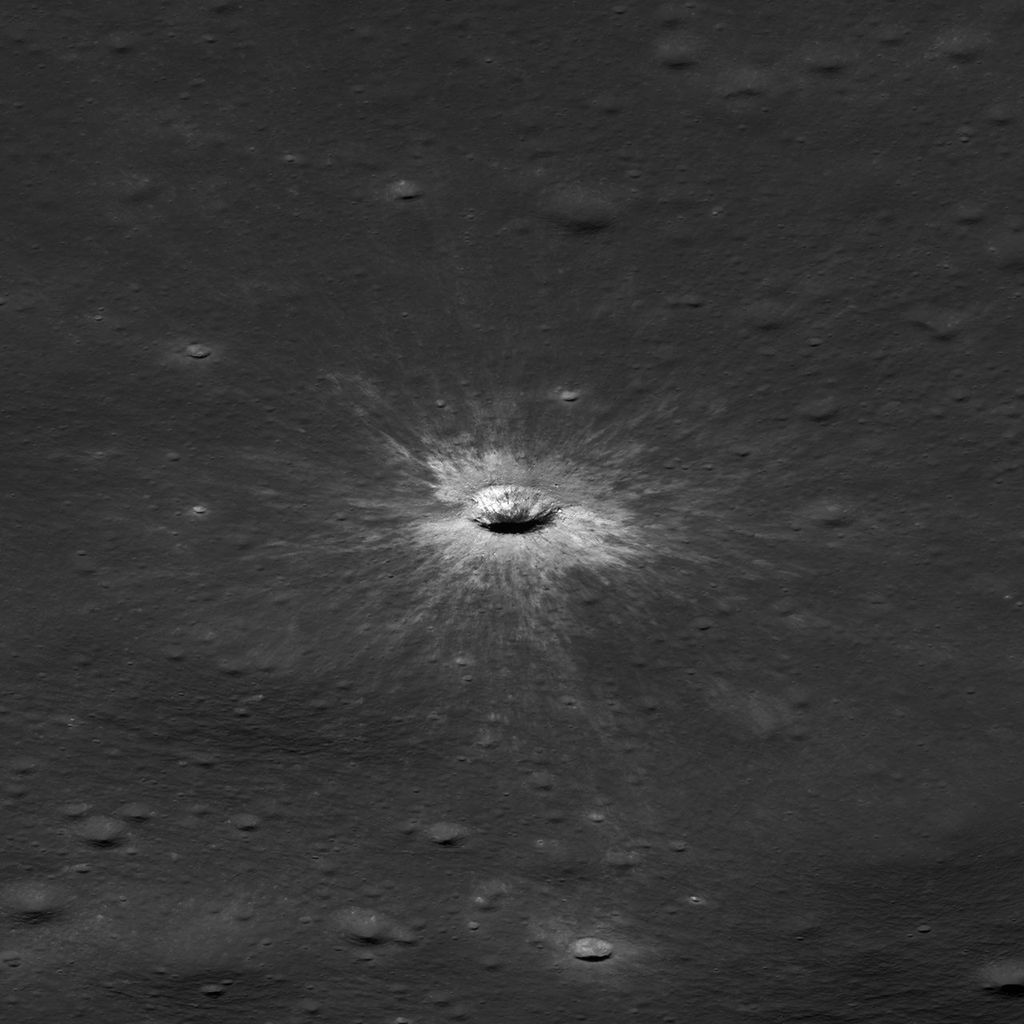
Officially named McGetchin after pioneering lunar scientist Tom McGetchin, the crater formed on the Moon’s eastern edge sometime between April 11 and May 22, 2024, after a comet or asteroid the size of a three- to six-story building hit the surface.
The crash left a crater, 728 feet wide, that spans the length of two football fields. And at 141 feet deep, the crater could fit three vertically stacked yellow school buses.
Scientists estimate that an impact of this magnitude happens on the Moon about once in a century or even longer.
Moon takes some hits
For more than 17 years, LRO has been circling the Moon and using its seven instruments to map the topography, surface composition, temperature, and radiation environment there. The spacecraft’s team has identified at least 1,000 new impact craters throughout the mission and flagged 100,000 more surface changes from an object smashing into the Moon or from the debris that flung out after.
With no atmosphere to slow them or burn them up, space rocks and other objects easily reach the lunar surface. Most are much smaller compared to the object that carved out McGetchin crater. The smallest craters scientists can distinguish from LRO images are about 30 feet wide, the length of a three-story building laid on its side, made by rocks about 43 inches wide, the size of a monster-truck tire. Scientists estimate that impacts of this scale produce about 140 new craters across the Moon each year. But most new ones are made by microscopic projectiles that leave holes too small to identify in orbital images.
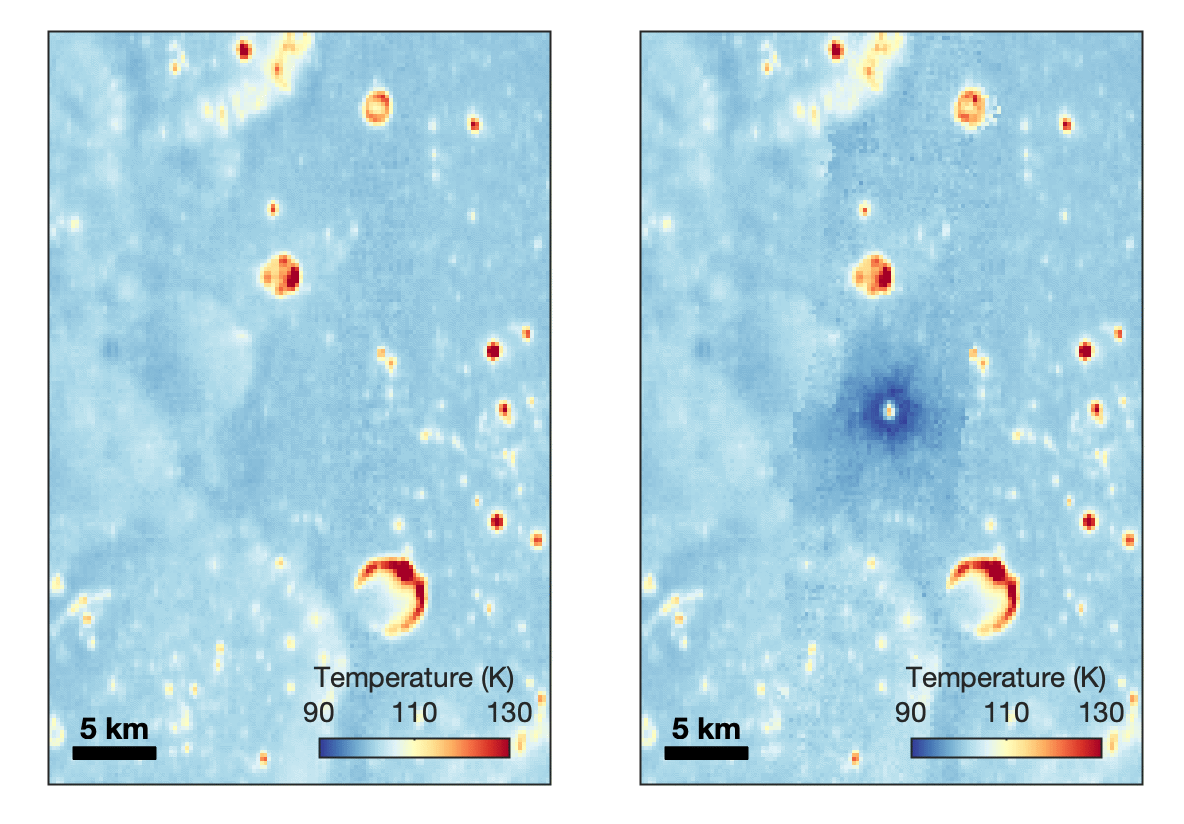
With its numerous instruments, the spacecraft can observe changes to the lunar surface that aren’t apparent in the LROC images alone. After the crater was discovered, scientists working with LRO’s thermal instrument, Diviner, made follow-up observations of the site. They found a 4-mile-wide area around the crater that is about 16 degrees Fahrenheit cooler at night than its surroundings.
This animated image set shows an area on the eastern limb of the Moon before and after McGetchin crater formed there sometime between April 11 and May 22, 2024. The post-impact image was constructed using data taken by NASA’s Lunar Reconnaissance Orbiter (LRO) thermal instrument, Diviner, between Nov. 15, 2025, and Feb. 18, 2026, after scientists discovered the crater in visible-light images taken by LRO’s Wide-Angle Camera. Pre-impact temperatures are from the Diviner Global High-Resolution Mosaics (GHRM). The crater formed on the Moon after a comet or asteroid, possibly the size of a six-story building, hit the surface in a rare, once-in-a-century collision. The dark blue strip that flashes into view reveals a 4-mile-wide “cold spot” around the crater that is about 16 degrees Fahrenheit cooler at night than its surroundings. This cooling happens because an impact fluffs up regolith around a crater, making it less dense and therefore less able to retain heat. Scientists on the Diviner team reported this finding in a paper published on Sept. 16, 2026, in Science Advances. The red and yellow spots indicate areas typically associated with rocks excavated by long-ago impacts which, though still at cryogenic temperatures like their surroundings, remain slightly warmer at night.
NASA Goddard/UCLA/JHU APL
Reporting in a second paper Wednesday in the same journal, researchers say that the cooling happens because the impact fluffs up the regolith around the crater, making it less dense and therefore less able to retain heat.
The large extent of this “cold spot” is striking, scientists say, because it shows that impacts can modify the Moon’s surface far beyond the crater itself. These physical changes could affect how rover wheels interact with the surface, for instance.
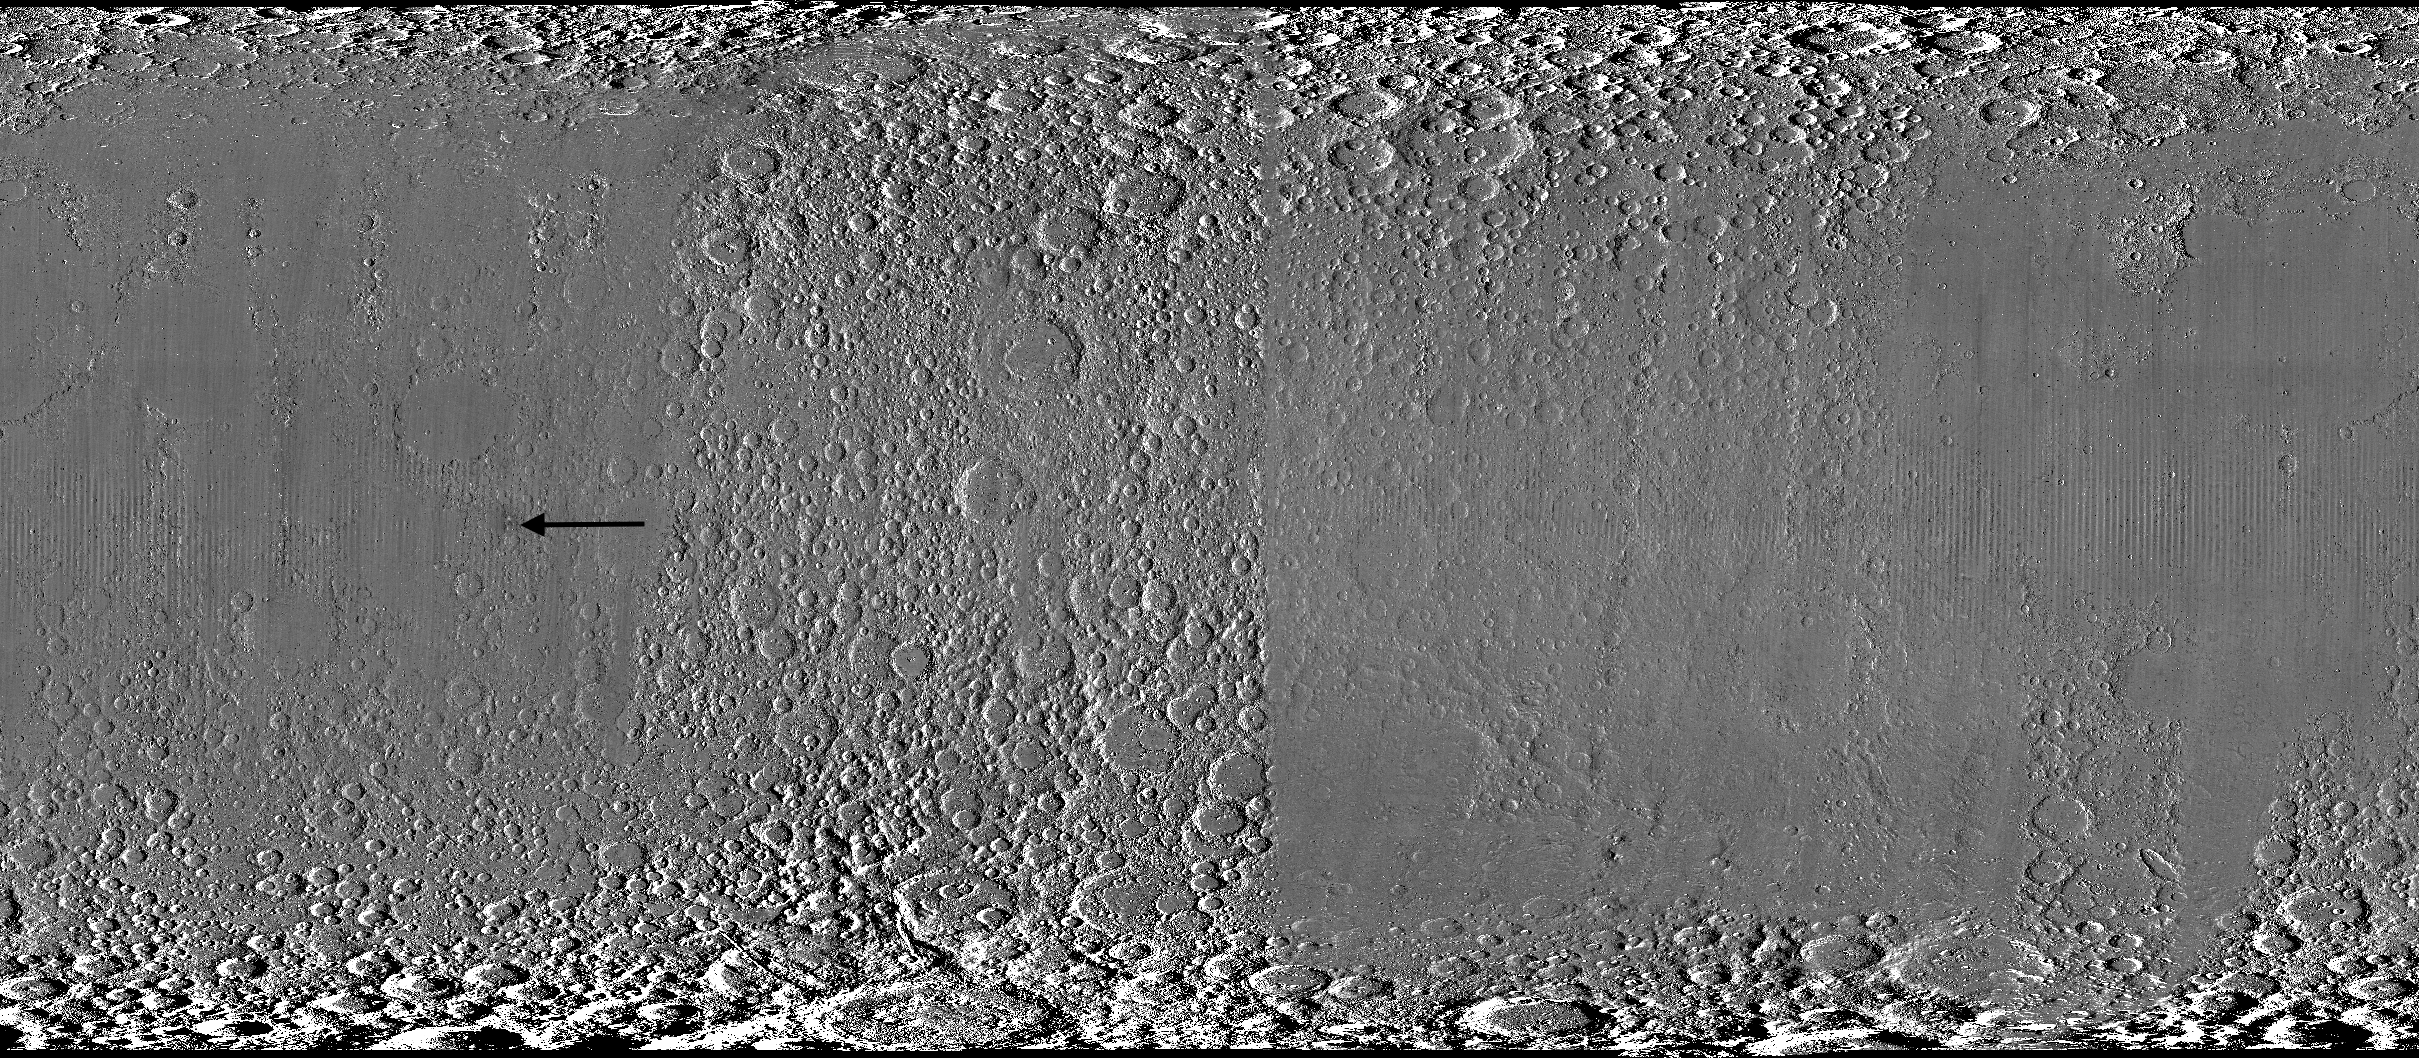
A global view of the Moon made by stitching together hundreds of images from the Wide-Angle Camera aboard NASA’s Lunar Reconnaissance Orbiter (LRO). Robert Wagner, image processing specialist for LRO, made this map using two sets of mages taken several years apart. He used a software designed to highlight any changes between the two sets. Anything that stayed the same turned gray; anything different showed up as bright or dark patches. A black arrow just left of center points to McGetchin crater.
NASA Goddard/Intuitive Machines/Robert Wagner
Road to discovery
The LROC system collects images from about 60 miles above the Moon as LRO loops from pole to pole. The system includes two cameras that capture high‑resolution black‑and‑white images and one camera for moderate‑resolution multispectral images. Over the years and thousands of passes, scientists have built maps detailed enough to spot not only new craters, but also landslides, landers, seismic faults, and even hints of lava tubes.
LROC scientists regularly analyze close-up images of small portions of the Moon’s surface taken by the Narrow-Angle Camera. Using these images, they look for changes that are typically less than 30 feet across. But every few years the team searches for large (wider than 150 feet) features by creating global Moon maps and comparing them to older versions.
An overhead, close-up view of McGetchin crater that was taken on Dec. 5, 2025, by NASA’s Lunar Reconnaissance Orbiter (LRO) Narrow-Angle Camera (NAC). After the crater was discovered on Oct. 24, 2025, in global images from LRO’s Wide-Angle Camera, which captures broad views with pixels the size of American football fields, scientists turned to the NAC, which takes much sharper views at about 3 feet per pixel. The NAC images, taken as LRO flew over the impact site again, revealed the crater size, shape, and how the surrounding terrain was affected by the impact that carved McGetchin. The image covers an area that’s ¾ mile wide.
NASA Goddard/Intuitive Machines
This view from the side (55° away from straight down) towards the east, covers an area of the Moon that’s about 1.5 miles wide. It was taken by NASA’s Lunar Reconnaissance Orbiter Narrow-Angle Camera on March 3, 2026.
NASA Goddard/Intuitive Machines
That’s what Wagner was doing on Oct. 24, 2025, when he came across McGetchin. Using images from LROC’s Wide-Angle Camera, which captures broad views with pixels the size of football fields, he stacked hundreds of “before” and “after” frames with software designed to highlight change. Anything that stayed the same turned gray while anything different showed up as bright or dark patches.
While the process sounds straightforward, spotting real craters requires a lot of manual work. The software flags every tiny shift in lighting or shadow, generating hundreds of false alarms. For this reason, Wagner typically verifies the software, looking for small fuzzy halos around pixel‑wide bright points, which indicate splashes of regolith around a new crater.
Spanning hundreds of pixels, McGetchin stood out immediately. “It was by far the most obvious impact debris pattern I’ve ever seen in one of these images,” Wagner said.
After his discovery, scientists turned to the Narrow-Angle Camera, which takes much sharper views at about 3 feet per pixel. This camera’s close-up images, taken as LRO flew over the impact site again, revealed the crater size, shape, and how the surrounding terrain was affected. These images also helped researchers estimate the size and force of the rock fragment that formed the new crater, details that are expected to appear in a future paper.
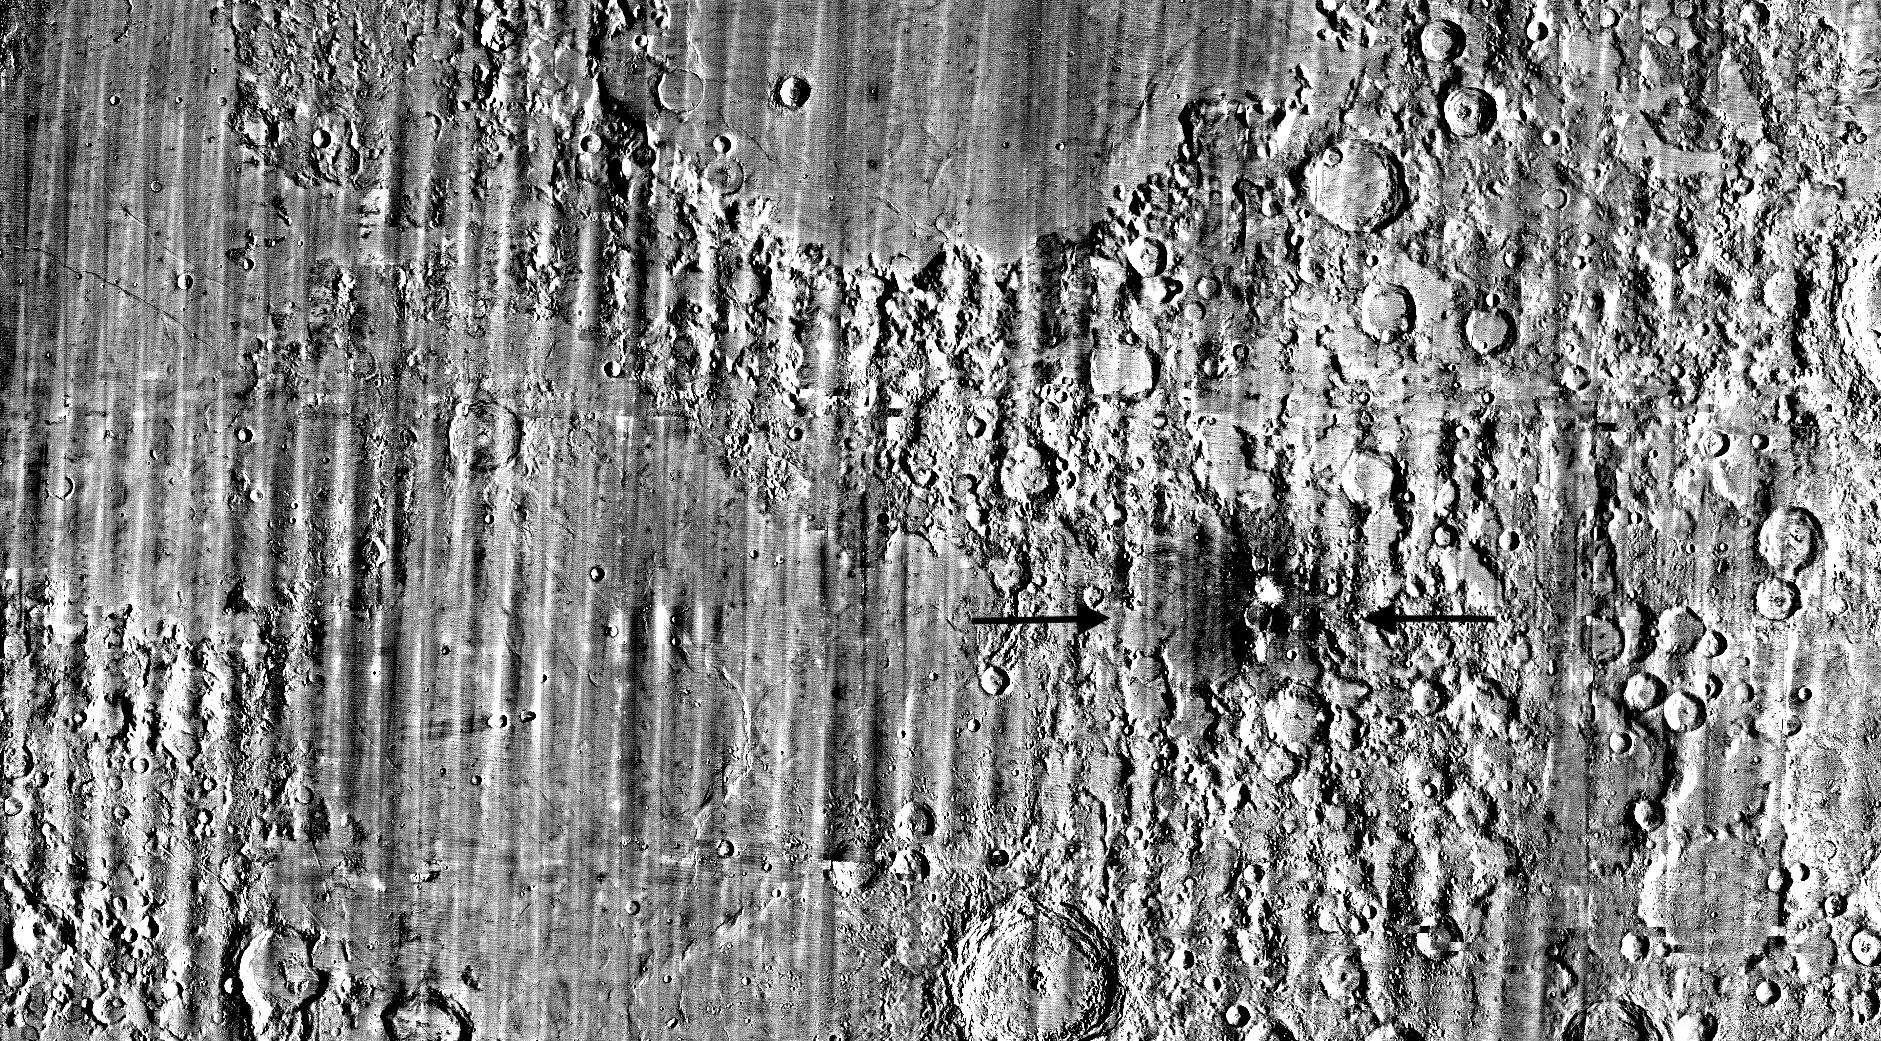
Banner image caption: A zoomed-in view of the Moon, with debris around McGetchin crater visible as a white spot circled by a dark halo just right of center of the image (marked with black arrows). This is the view that Robert Wagner saw on Oct. 24, 2025, during a routine data-quality check. Wagner is an image processing specialist for NASA’s Lunar Reconnaissance Orbiter Camera, a system of three cameras. Using images from the Wide-Angle Camera (WAC), which captures broad views with pixels the size of American football fields, he stacked hundreds of images captured by WAC over the last several years with software designed to highlight change. Anything that stayed the same is gray; anything that changed showed up as bright or dark patches. The stripes in the image are due to slight changes in lighting between the older and newer images. This image composite shows an area of the Moon approximately 900 miles across.
About the Author
Lonnie Shekhtman
Senior Science Writer
Shekhtman helps communicate NASA planetary science to the world through news and feature stories on NASA.gov, videos for NASA+ and YouTube, and by working with the media. She reports on lunar and Mars science and exploration; NASA’s search for life; missions to Venus, Titan, and Jupiter’s Trojan asteroids; and many other topics related to NASA’s exploration of our solar system and beyond.
Scientists discovered a crater on the Moon that formed sometime between April 11 and May 22, 2024, after a comet or asteroid the size of a three- to six-story building hit the surface.
The crash left a crater, 728 feet wide, that spans the length of two football fields. And at 141 feet deep, the crater could fit three vertically stacked yellow school buses.
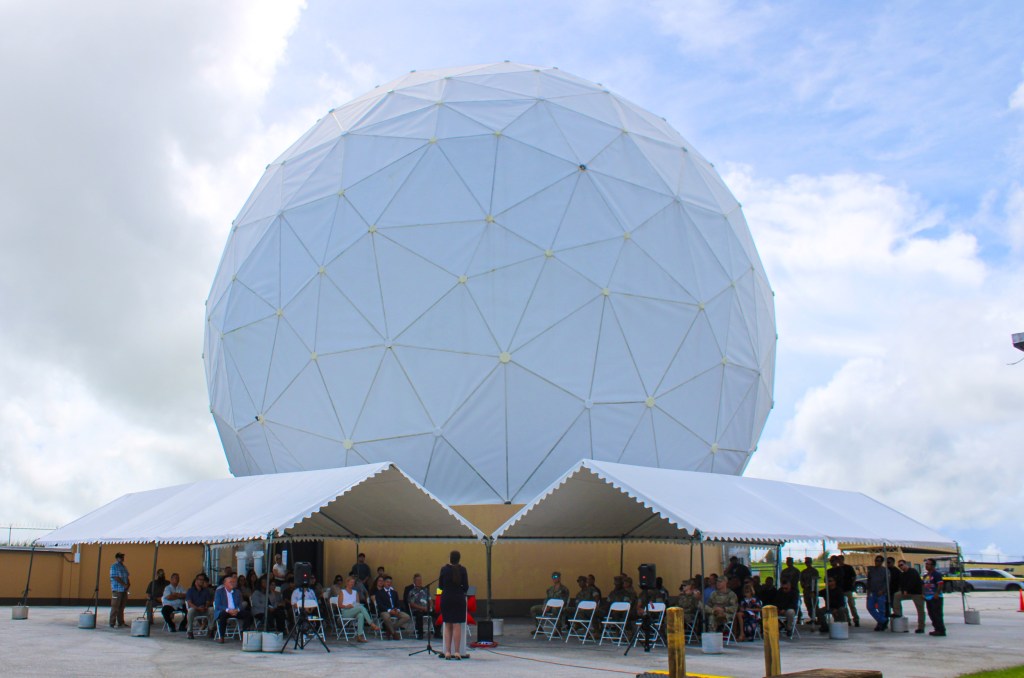
On Sept. 10, 2026, NASA commemorated the completed repairs of the Guam Remote Station’s central antenna with a ribbon-cutting ceremony.
Members of NASA, the Governor’s Office of Guam, military personnel, and family members gathered to celebrate the Guam Remote Station’s return to operations.
NASA
The ribbon-cutting event was held in front of the repaired central antenna. As of 2026, the newly hardened station has withstood two super typhoons more powerful than Mawar with minimal damage.
SCaN Deputy Manager for Network Operations Jena Garrahy addresses members of the Guam Remote Station ribbon-cutting event.
NASA
Guam Remote Station Site Manager Kristopher Copple was among those recognized during the ceremony.
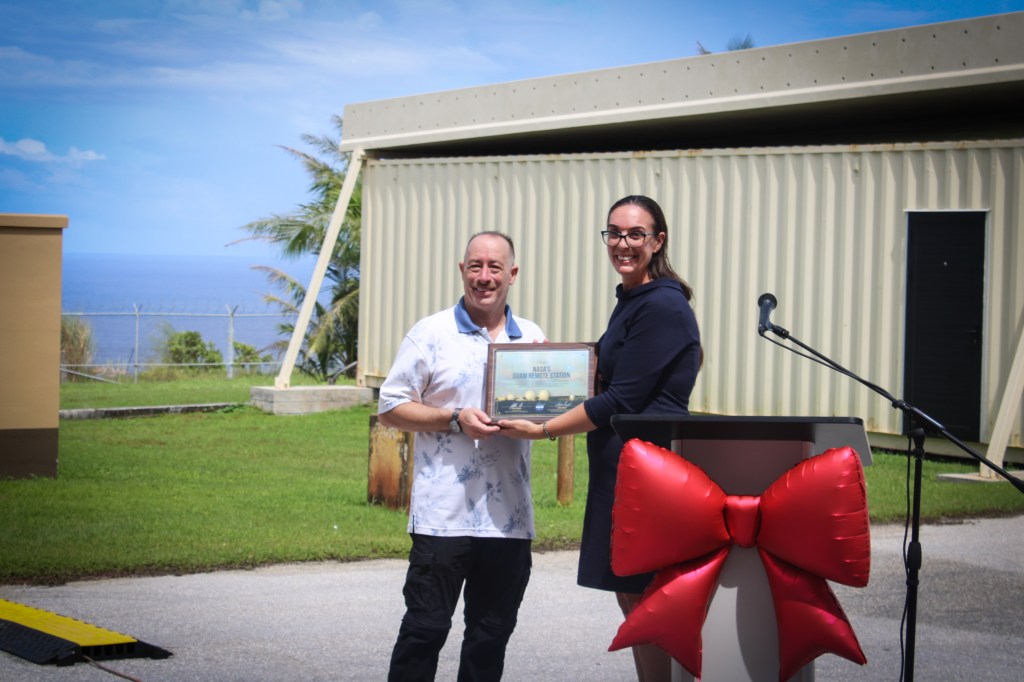
Jena Garrahy (right), SCaN Deputy Manager for Network Operations, presents a certificate of recognition to Guam Remote Station Site Manager Kristopher Copple (left).
NASA
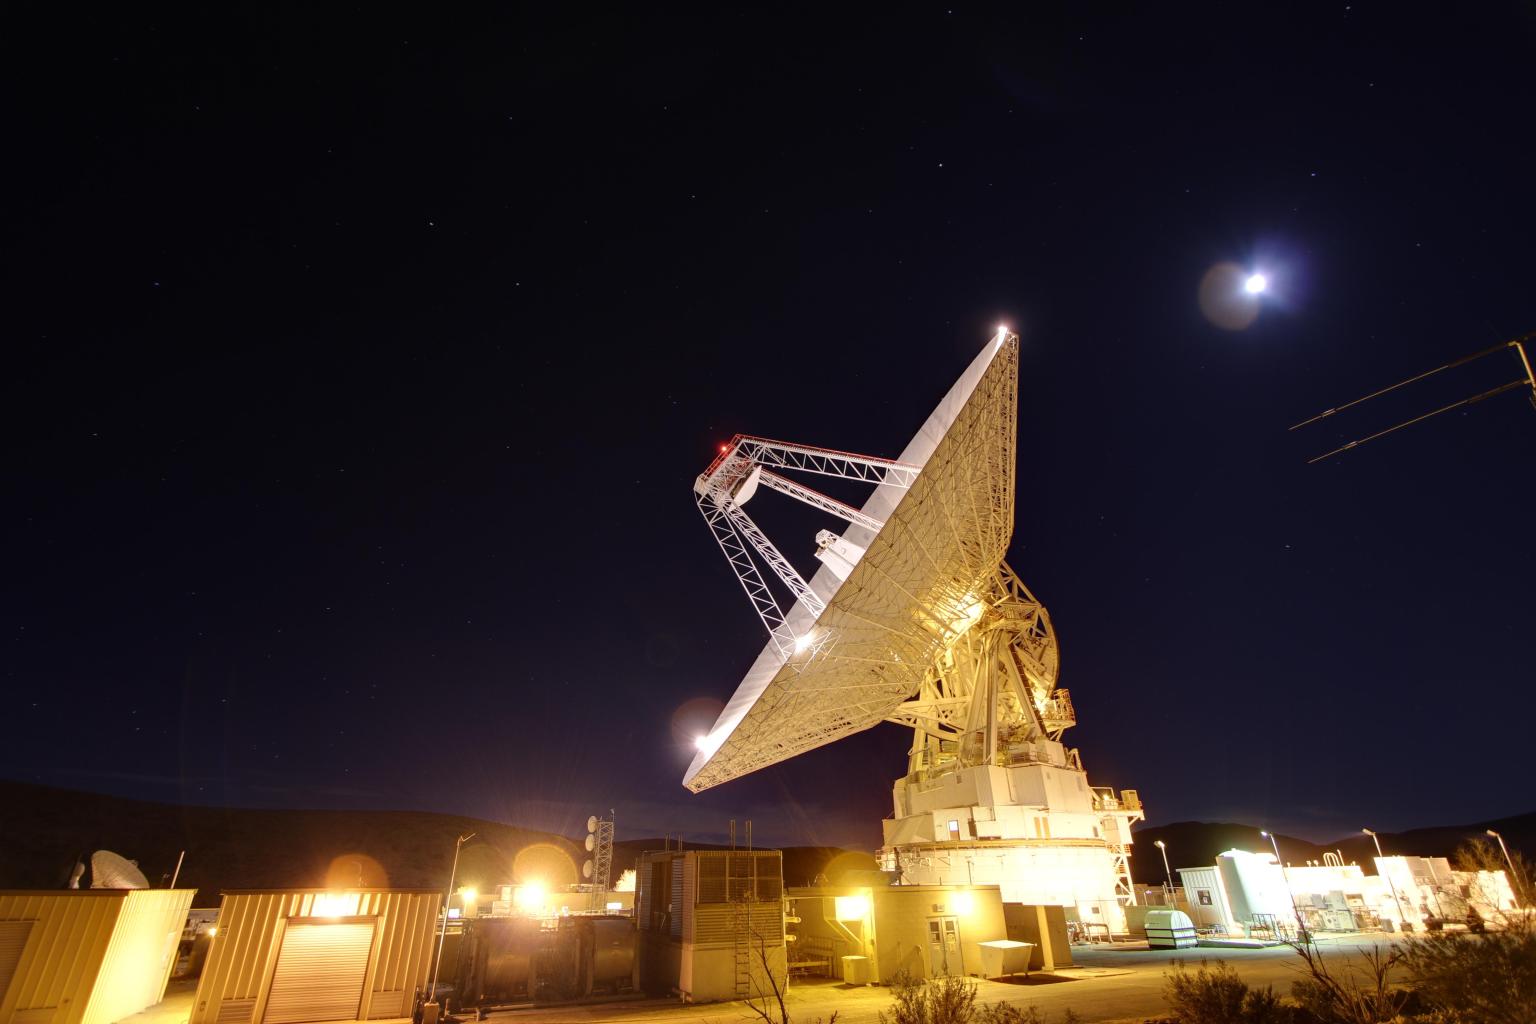
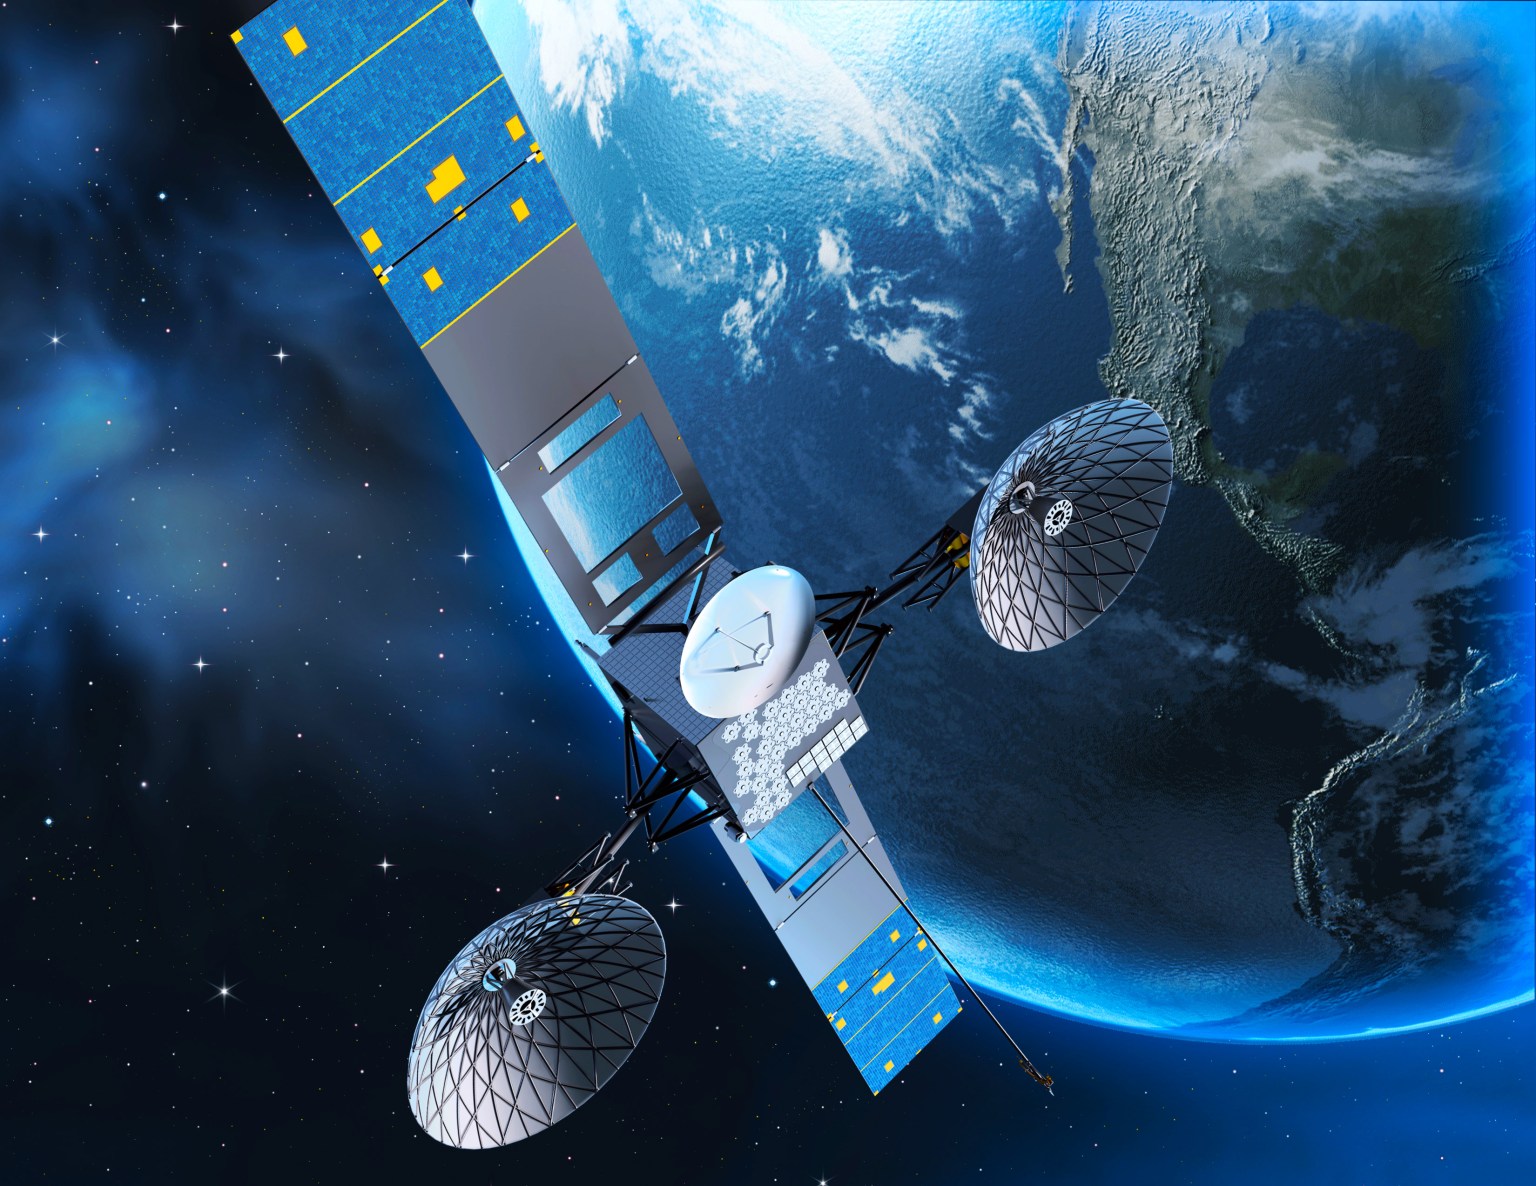
NASA’s Guam Remote Station is key to the Tracking and Data Relay Satellite (TDRS) constellation maintaining continuous communications with the International Space Station.
An artist’s concept of the International Space Station using NASA’s Tracking and Data Relay Satellite (TDRS) fleet to transmit data to Earth.
NASA
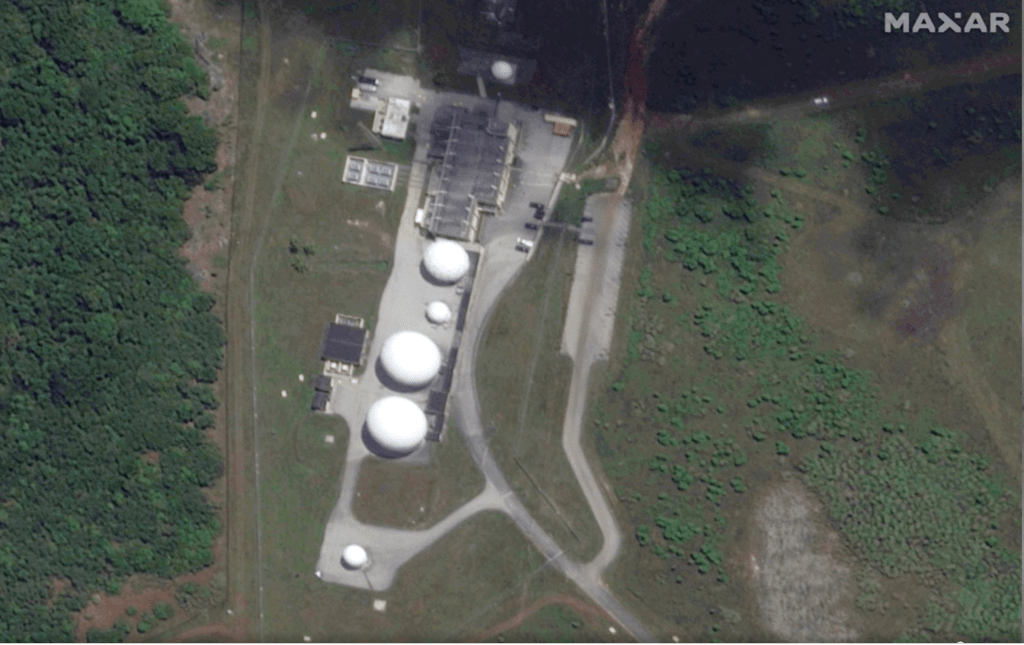
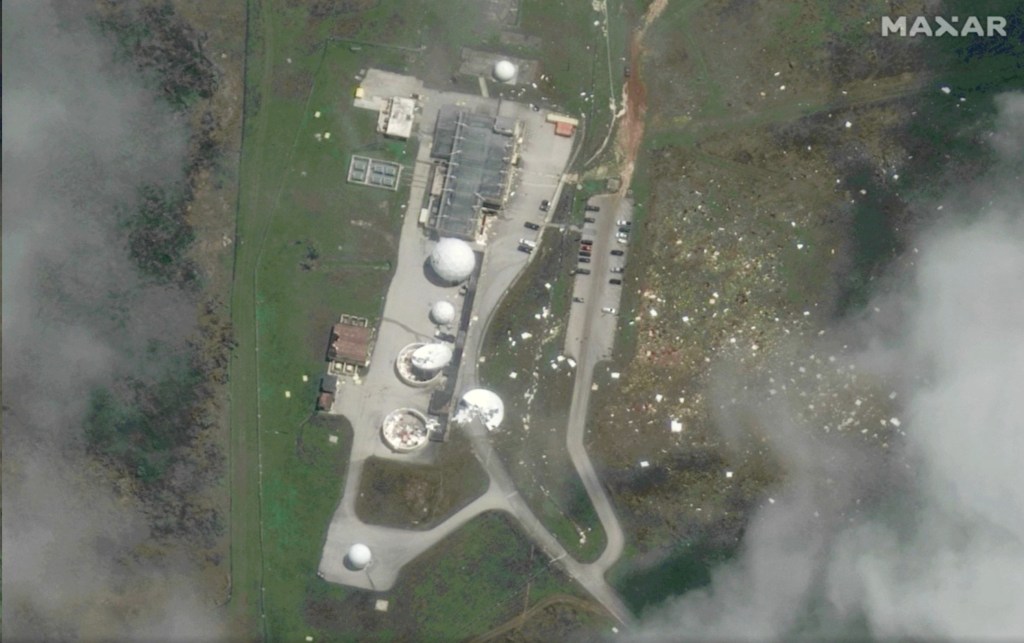
A 2023 aerial photo of the Guam Remote Station prior to Super Typhoon Mawar landing on the island.
Satellite image of NASA remote ground terminal located in Dededo area, Guam, released by U.S. commercial satellite company MAXAR.
MAXAR
An aerial photo of the Guam Remote Station immediately after Super Typhoon Mawar struck the station. of the station’s three ground antennas were demolished.
Satellite image of NASA remote ground terminal located in Dededo area, Guam, released by U.S. commercial satellite company MAXAR.
MAXAR
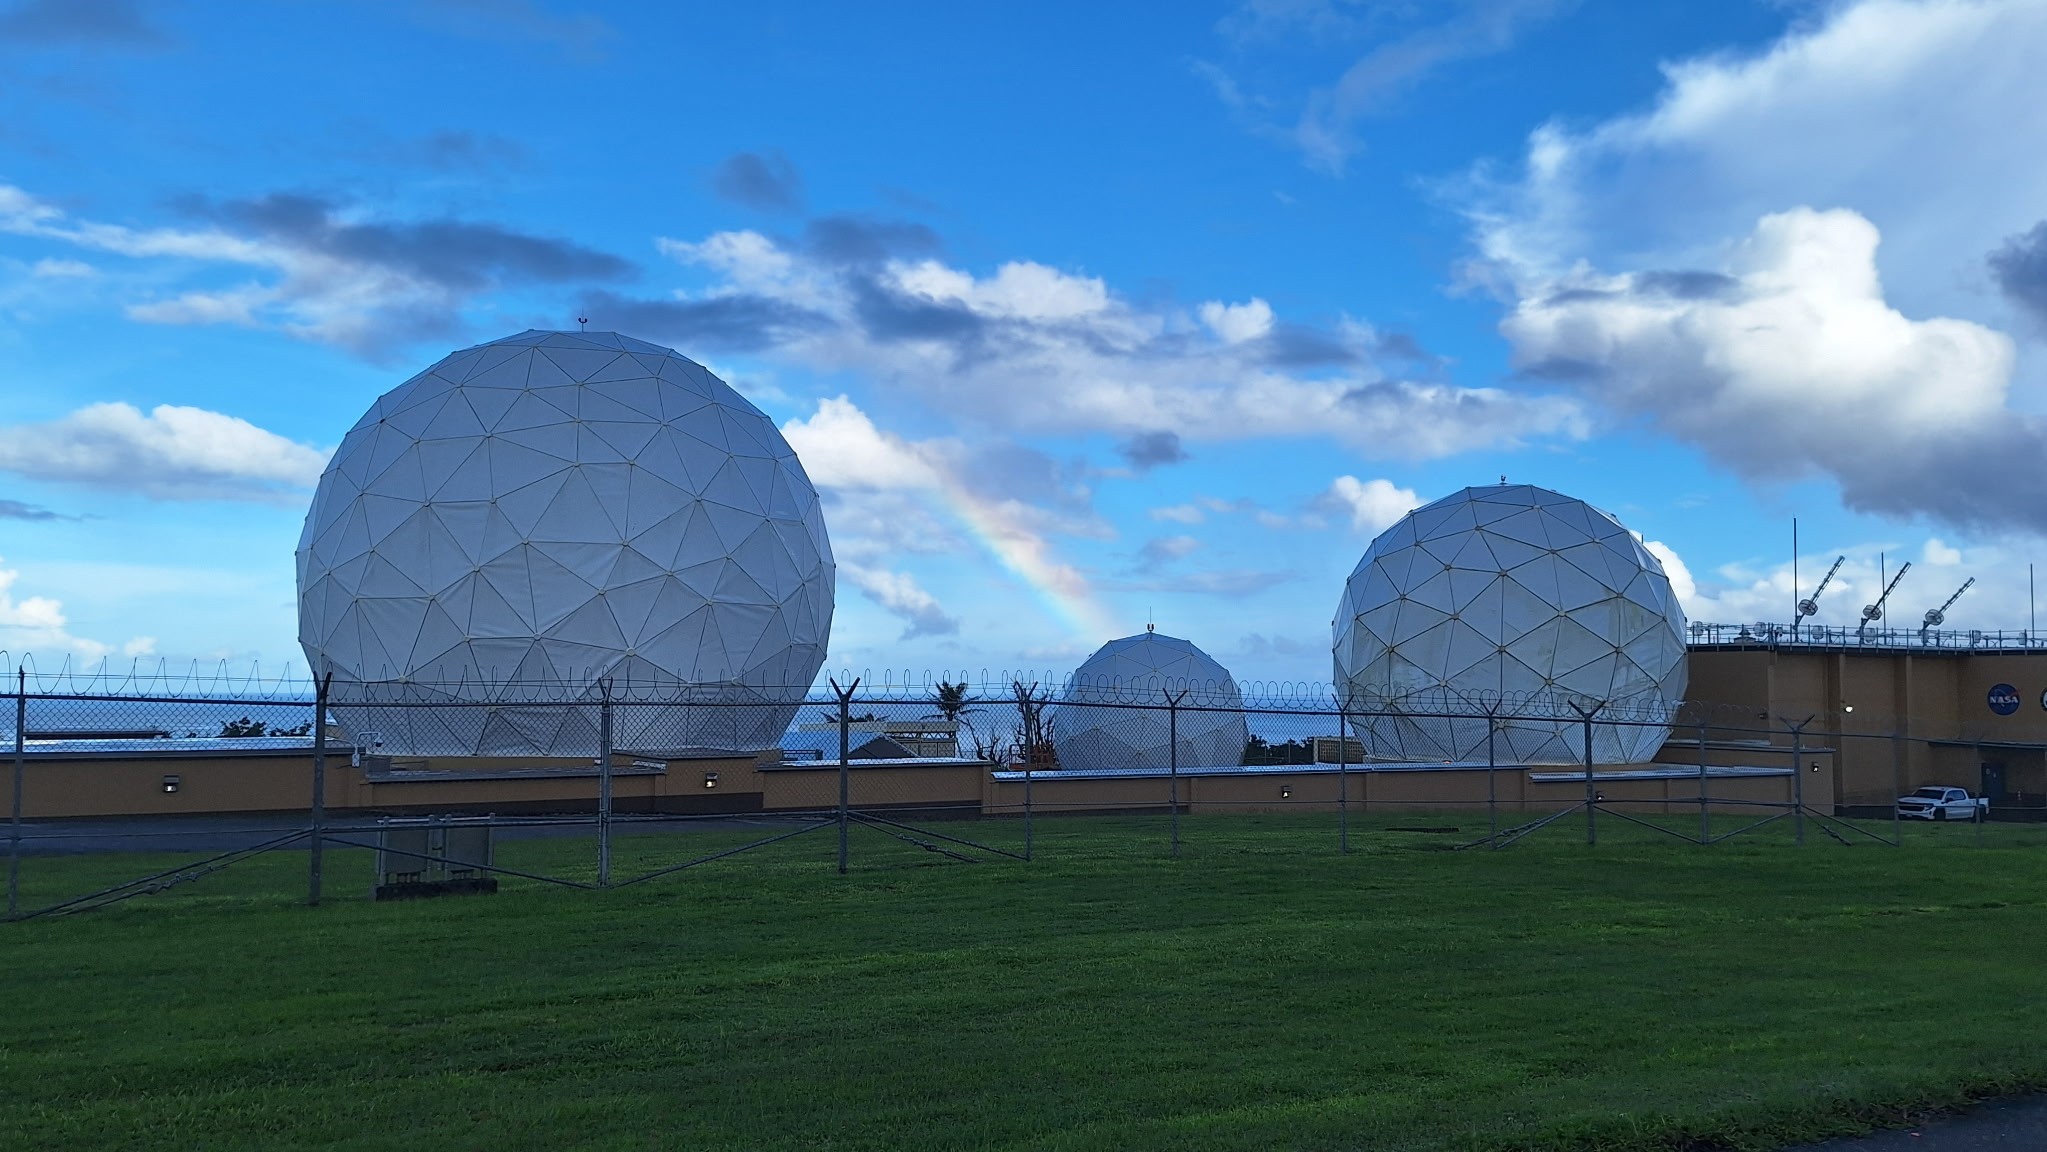
NASA celebrated the full restoration of its Guam Remote Station with a ribbon-cutting on Sept. 10, closing out more than three years of recovery after Super Typhoon Mawar devastated the site in 2023. Engineers from across the agency completed the final and most complex step of the rebuild on July 1, when they returned the station’s central antenna to service.
A rainbow arcs over the newly repaired Guam Remote Station antennas.
NASA
For nearly three decades, the Guam Remote Station has been one of three ground stations supporting NASA’s Tracking and Data Relay Satellites, or TDRS, a critical part of the Near Space Network. From 22,000 miles above Earth, the relays link spacecraft in low Earth orbit with the ground, allowing flight controllers to communicate with astronauts, command spacecraft, and receive mission data. The Guam station alone closes the “Zone of Exclusion,” a stretch of orbit beyond the relays’ line of sight. Without it, the International Space Station can lose contact with Earth for up to 20 minutes of every 90-minute orbit, an unacceptable risk for crewed missions.
On May 24, 2023, the Category 4 super typhoon struck Guam with 185 mph winds and more than 28 inches of rain, destroying two 16.5-meter antennas and damaging an 11-meter north antenna and the Inter Facility Link building at NASA’s station. The Zone of Exclusion reopened for the first time since 1998, cutting TDRS coverage to about 85% of a spacecraft’s orbit.
NASA made emergency repairs to the least-damaged antenna and borrowed two mobile terminals from the U.S. Army to expand coverage. The patchwork restored partial service within months, in time for a November 2023 spacewalk.
In early 2025, Congress dedicated disaster-relief funding to rebuild the ground station and harden the network against future storms. Construction began that summer and finished in summer 2026, when the rebuilt central antenna rejoined TDRS operations and the Zone of Exclusion closed once more. The same appropriation funded critical upgrades at three additional Near Space Network ground stations.
The return to service of the Guam Remote Station’s central antenna represents far more than the restoration of a critical piece of infrastructure — it is a testament to the dedication, resilience, and ingenuity of the people who made it possible.
Jena Garrahy
SCaN Deputy Program Manager for Network Operations
At the ribbon-cutting, representatives from NASA’s SCaN (Space Communications and Navigation) Division joined the station’s workforce and local leaders to mark the central antenna’s return to service. The Guam team, which led debris removal, site security, and on-island recovery, was recognized for its work to keep NASA connected to its missions through the outage and rebuild. A companion ceremony at NASA’s White Sands Complex in Las Cruces, New Mexico, honored the engineers and specialists across SCaN who supported the recovery off island.
“The return to service of the Guam Remote Station’s central antenna represents far more than the restoration of a critical piece of infrastructure — it is a testament to the dedication, resilience, and ingenuity of the people who made it possible,” said Jena Garrahy, Deputy Program Manager for Network Operations. “Through long days, challenging conditions, and unexpected obstacles, this team remained focused on the missions that depend on these critical assets every day.”
The Near Space Network is funded by SCaN, a division of NASA’s Research and Technology Mission Directorate, at the agency’s Headquarters in Washington. The network is operated out of NASA’s Goddard Space Flight Center in Greenbelt, Maryland. Repairs of the Guam Remote Station were managed out of NASA’s Glenn Research Center in Cleveland.
About the Author
Korine Powers
Lead Writer and Communications Strategist
Korine Powers, Ph.D. is a writer for NASA's SCaN (Space Communications and Navigation) Program office and covers emerging technologies, commercialization efforts, exploration activities, and more.
Newfound ‘Baby’ Planet Smashes Record for Youngest Known World
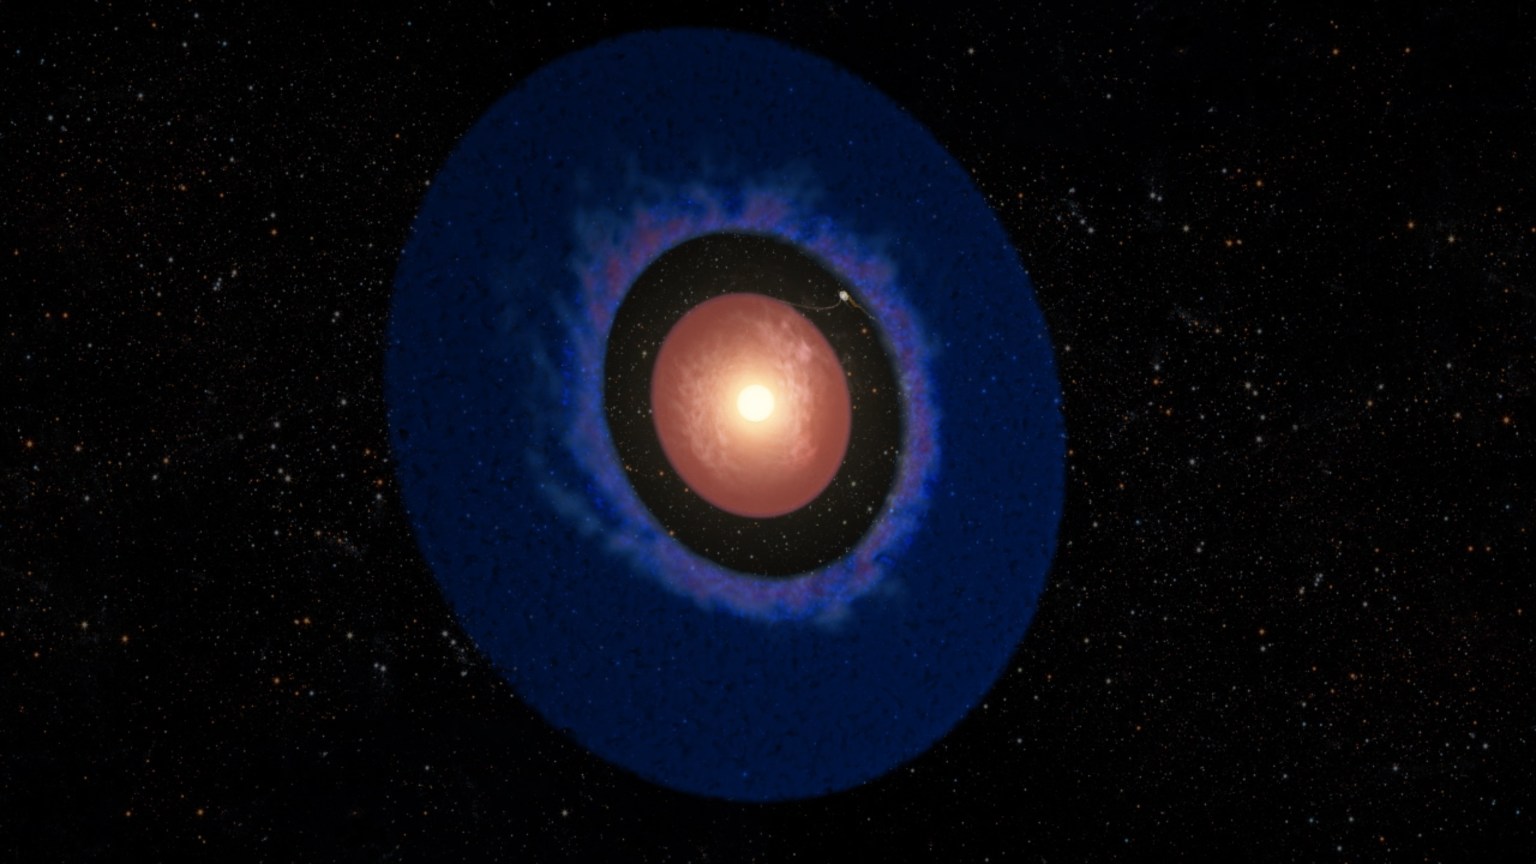
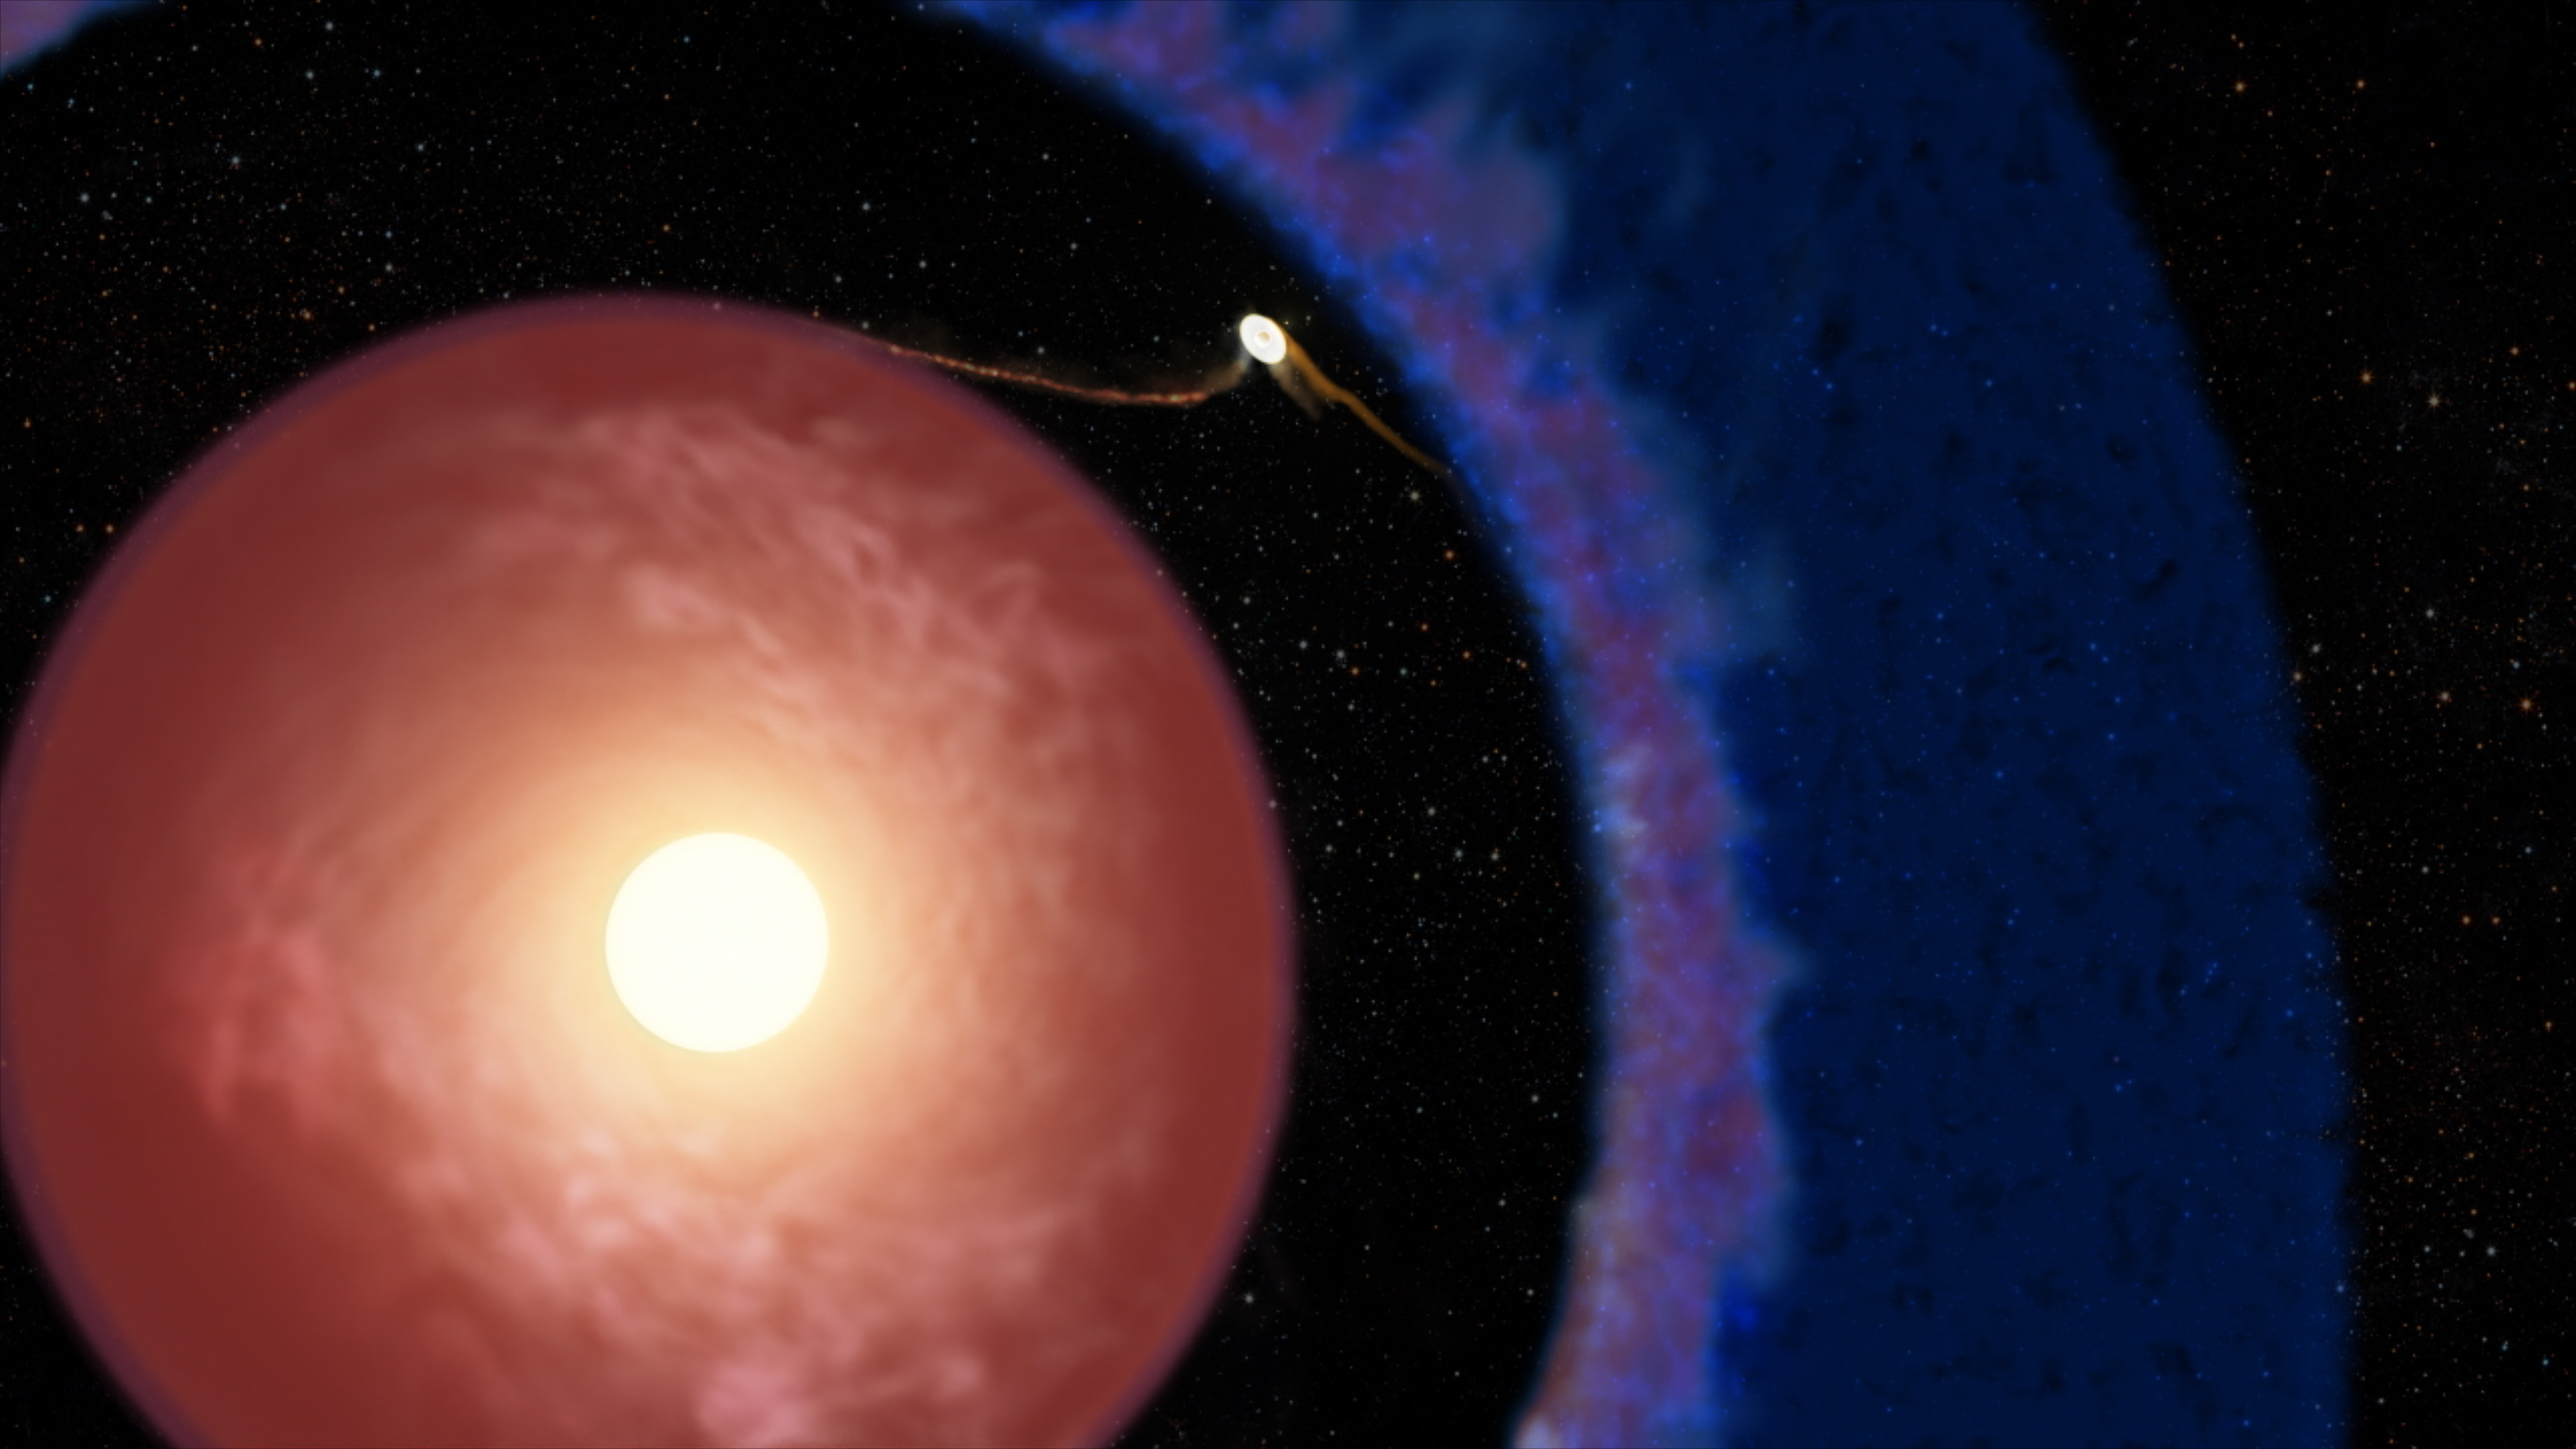
An artist’s concept of the youngest known exoplanet, Elias 2-24 b.
Credits: W. M. Keck Observatory/Adam Makarenko
Astronomers have confirmed a world that’s less than a million years old as the youngest known planet, using data from NASA-funded archives. Called Elias 2-24 b, the baby planet is still whirling in its natal disk of dust and gas.
“Our planet-formation models already struggled to explain the previous record holders for the youngest known planet — a four-way tie between two planets orbiting the star PDS 70 and two planets orbiting the star WISPIT 2 — which are all more than 5 million years old,” said Lucas Cieza, a professor at the Instituto de Estudios Astrofísicos in Chile and co-author of a paper detailing the results. “Elias 2-24 b shows us that even our best planet-formation models are still missing some important processes.”
In a study published Wednesday in The Astrophysical Journal Letters, a team led by Andrea Bernardi, a doctoral candidate at the Universidad Diego Portales in Chile, homed in on archival observations of seven stars that were observed using the coronagraph at the W. M. Keck Observatory in Hawaii, which partners with NASA under a cooperative agreement. Each of these stars hosts a debris disk chock-full of dust, gas, and chunks of ice and rock with structures and gaps in the disk hinting that planets may be forming around them.
Artist’s concept depicting Elias 2-24 b, the youngest exoplanet detected to date, still growing within the disk of gas and dust surrounding its young host star. Material from the disk is actively accreting onto the Jupiter-mass planet, which sits within a prominent gap in the disk, supporting the leading theory of giant planet formation.
W. M. Keck Observatory/Adam Makarenko
With the coronagraph blocking light from the host stars, astronomers searched for fainter planets orbiting those stars that could be embedded in the dusty disks. Planets found outside our own solar system are called exoplanets.
“The planets should be found within the gaps, since they are carving them,” Bernardi said. “And that’s exactly where we found Elias 2-24 b.”
The planet orbiting the star Elias 2-24 is about as massive as Jupiter and the star is about 450 light-years from Earth. Studying this system offers a time machine of sorts for scientists to explore what our own planetary system may have been like billions of years ago.
Construction zone
Stars are born in swirling clouds of gas and dust, swaddled in haze. Orbiting planets form from leftover material that clumps up and gradually sculpts a path around the star. But it’s difficult to study an exoplanet’s newborn stage because of all the dust that shrouds them.
Most of the exoplanets we’ve discovered so far have been found using transits, which happen when a planet passes in front of its star and temporarily dims the amount of light we receive.
Those transits are hard to spot when the planets are still deeply buried in dust or orbiting far from the star. That’s why an overwhelming majority of the 6,000 currently confirmed exoplanets are billions of years old and very close to their stars. Current planet-formation models rely on a combination of complex theories and simulations, along with observations of young stars with disks where the presence of planets cannot yet be detected. Finding and studying more baby planets like Elias 2-24 b will help astronomers refine those models.
“The galaxy churns out new stars and planets continuously, so there are many in every stage of evolution,” Cieza said. “That means we can see the entire process in theory, but there is a large gap in what most telescopes can detect. We are mostly blind to these baby planets right now.”
Artist’s animation depicting Elias 2-24 b, the youngest exoplanet detected to date, still growing within the disk of gas and dust surrounding its young host star. Material from the disk is actively accreting onto the Jupiter-mass planet, which sits within a prominent gap in the disk, supporting the leading theory of giant planet formation.
W. M. Keck Observatory/Adam Makarenko
Connecting dots
The confirmation using Keck data solves a mystery that has puzzled astronomers for a decade. About a decade ago, observations from ALMA (Atacama Large Millimeter/submillimeter Array) in Chile showed a gap in the young star’s dusty disk. The European Southern Observatory’s Very Large Telescope in Chile then detected a faint point of light sitting in that gap.
Astronomers debated whether it could be a planet; according to planet formation theories, such gaps appear too early and too far from their stars for planets to have formed. Current models predict that it takes about 5 million years to form a Jupiter-size planet at Jupiter’s distance from the Sun (which is just over five times larger than the distance of Earth to the Sun), and even longer farther out. Yet the glowing dot they spotted was 55 times farther from its star than Earth is from the Sun and already behaving like a forming planet.
So Bernardi’s team searched the Keck Observatory Archive, a NASA-funded partnership between Keck Observatory and the NASA Exoplanet Science Institute at Caltech/IPAC, for the same little point of light again and found it in observations from 2018 and 2020. They stitched the observations together to analyze its motion over time and found that it behaved more like a planet than an imaging defect or background star, ultimately confirming it as Elias 2-24 b.
“We usually hear about telescopes working separately, but this confirmation was possible only by using multiple telescopes together,” Bernardi said. “Elias 2-24 b is at the limit of what current telescopes can detect, but with new instruments like NASA’s Nancy Grace Roman Space Telescope, such detections should become easier.”
Roman, which just launched Aug. 30, is equipped with an even more powerful coronagraph and is capable of spotting planets that are much harder for other telescopes to see. By employing the same technique, Roman could find planets in much smaller orbits, including true Jupiter analogs that are currently impossible to see through the glare. Elias 2-24 b is about 10 times farther out from its host star.
“This is just the beginning of a new era of discovery,” Cieza said. “It’s incredible that with modern technology, we are actually able to see planet formation in action, and Roman will take planet hunting to the next level.”
To learn more about NASA’s exploration of exoplanets, visit: