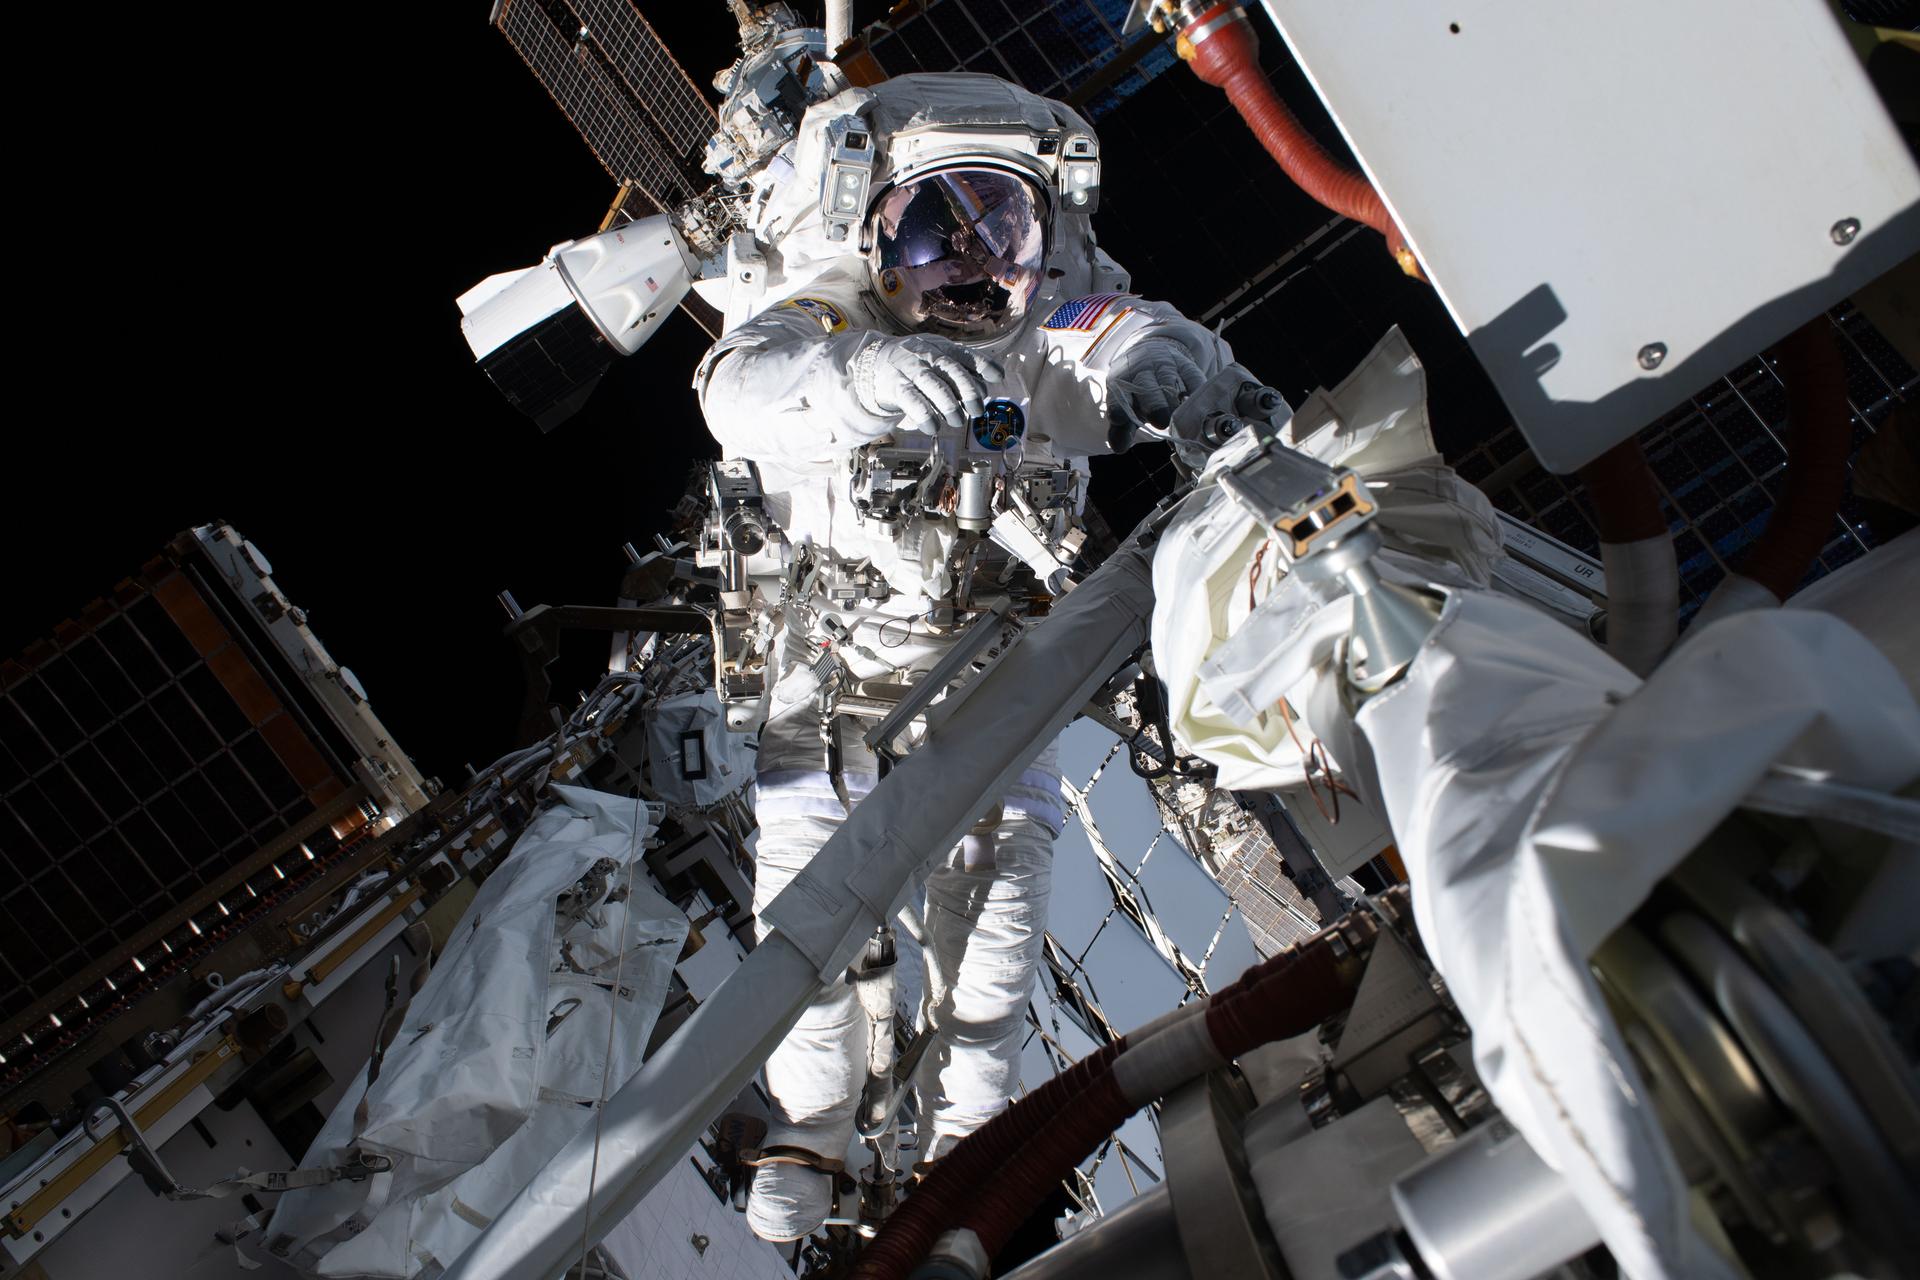
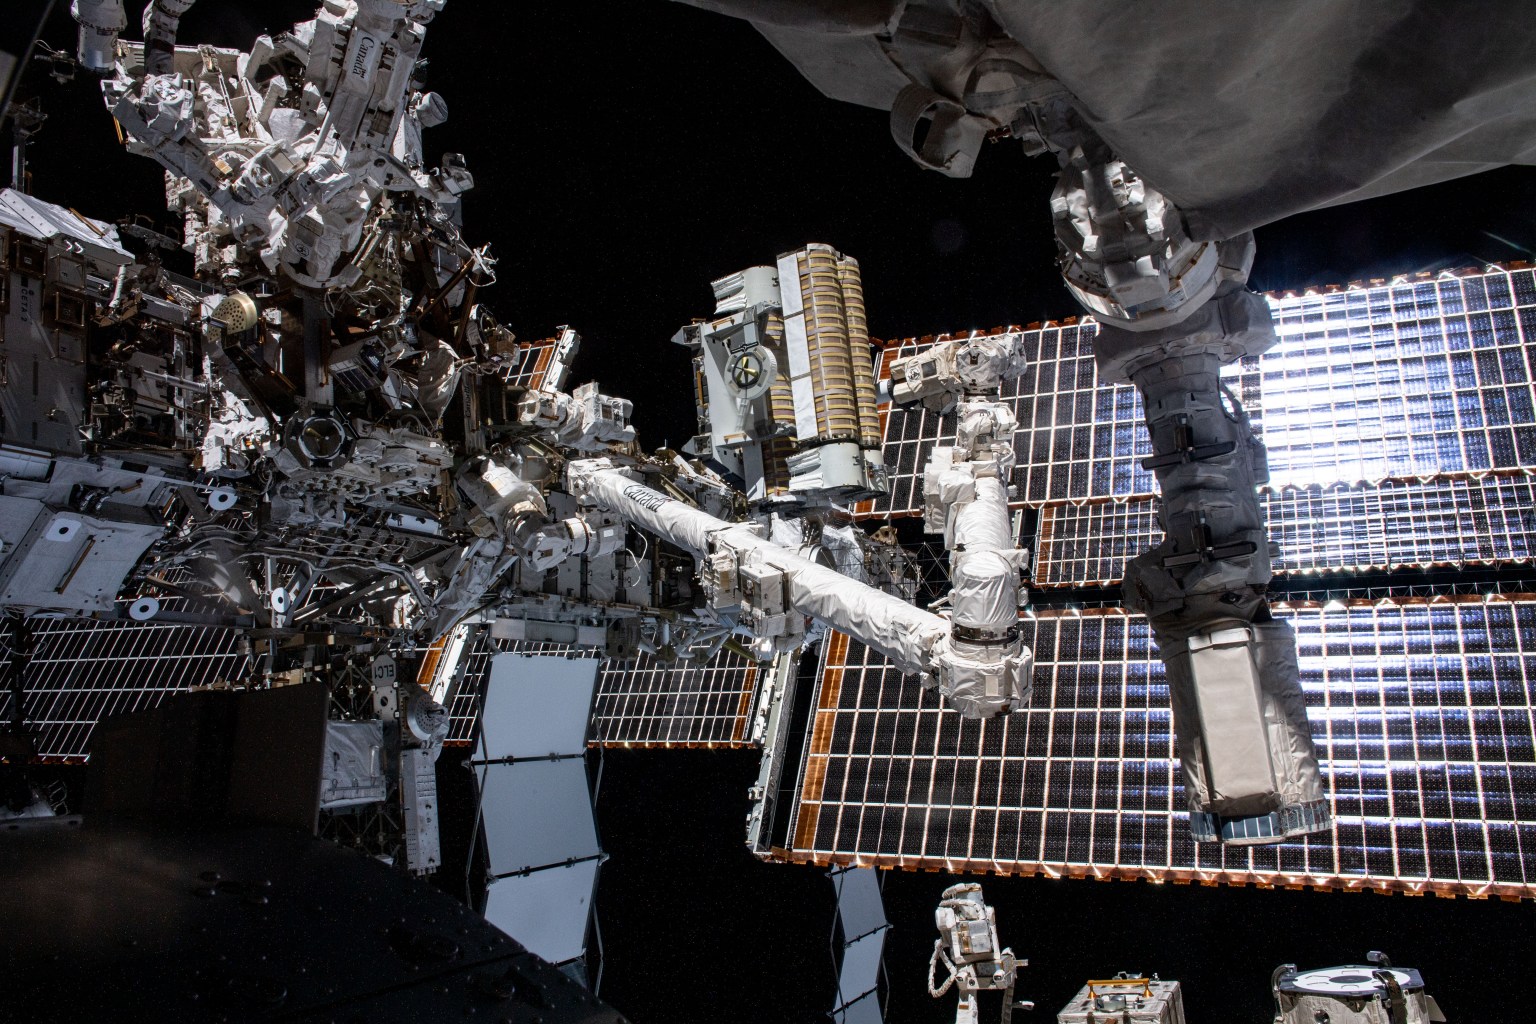
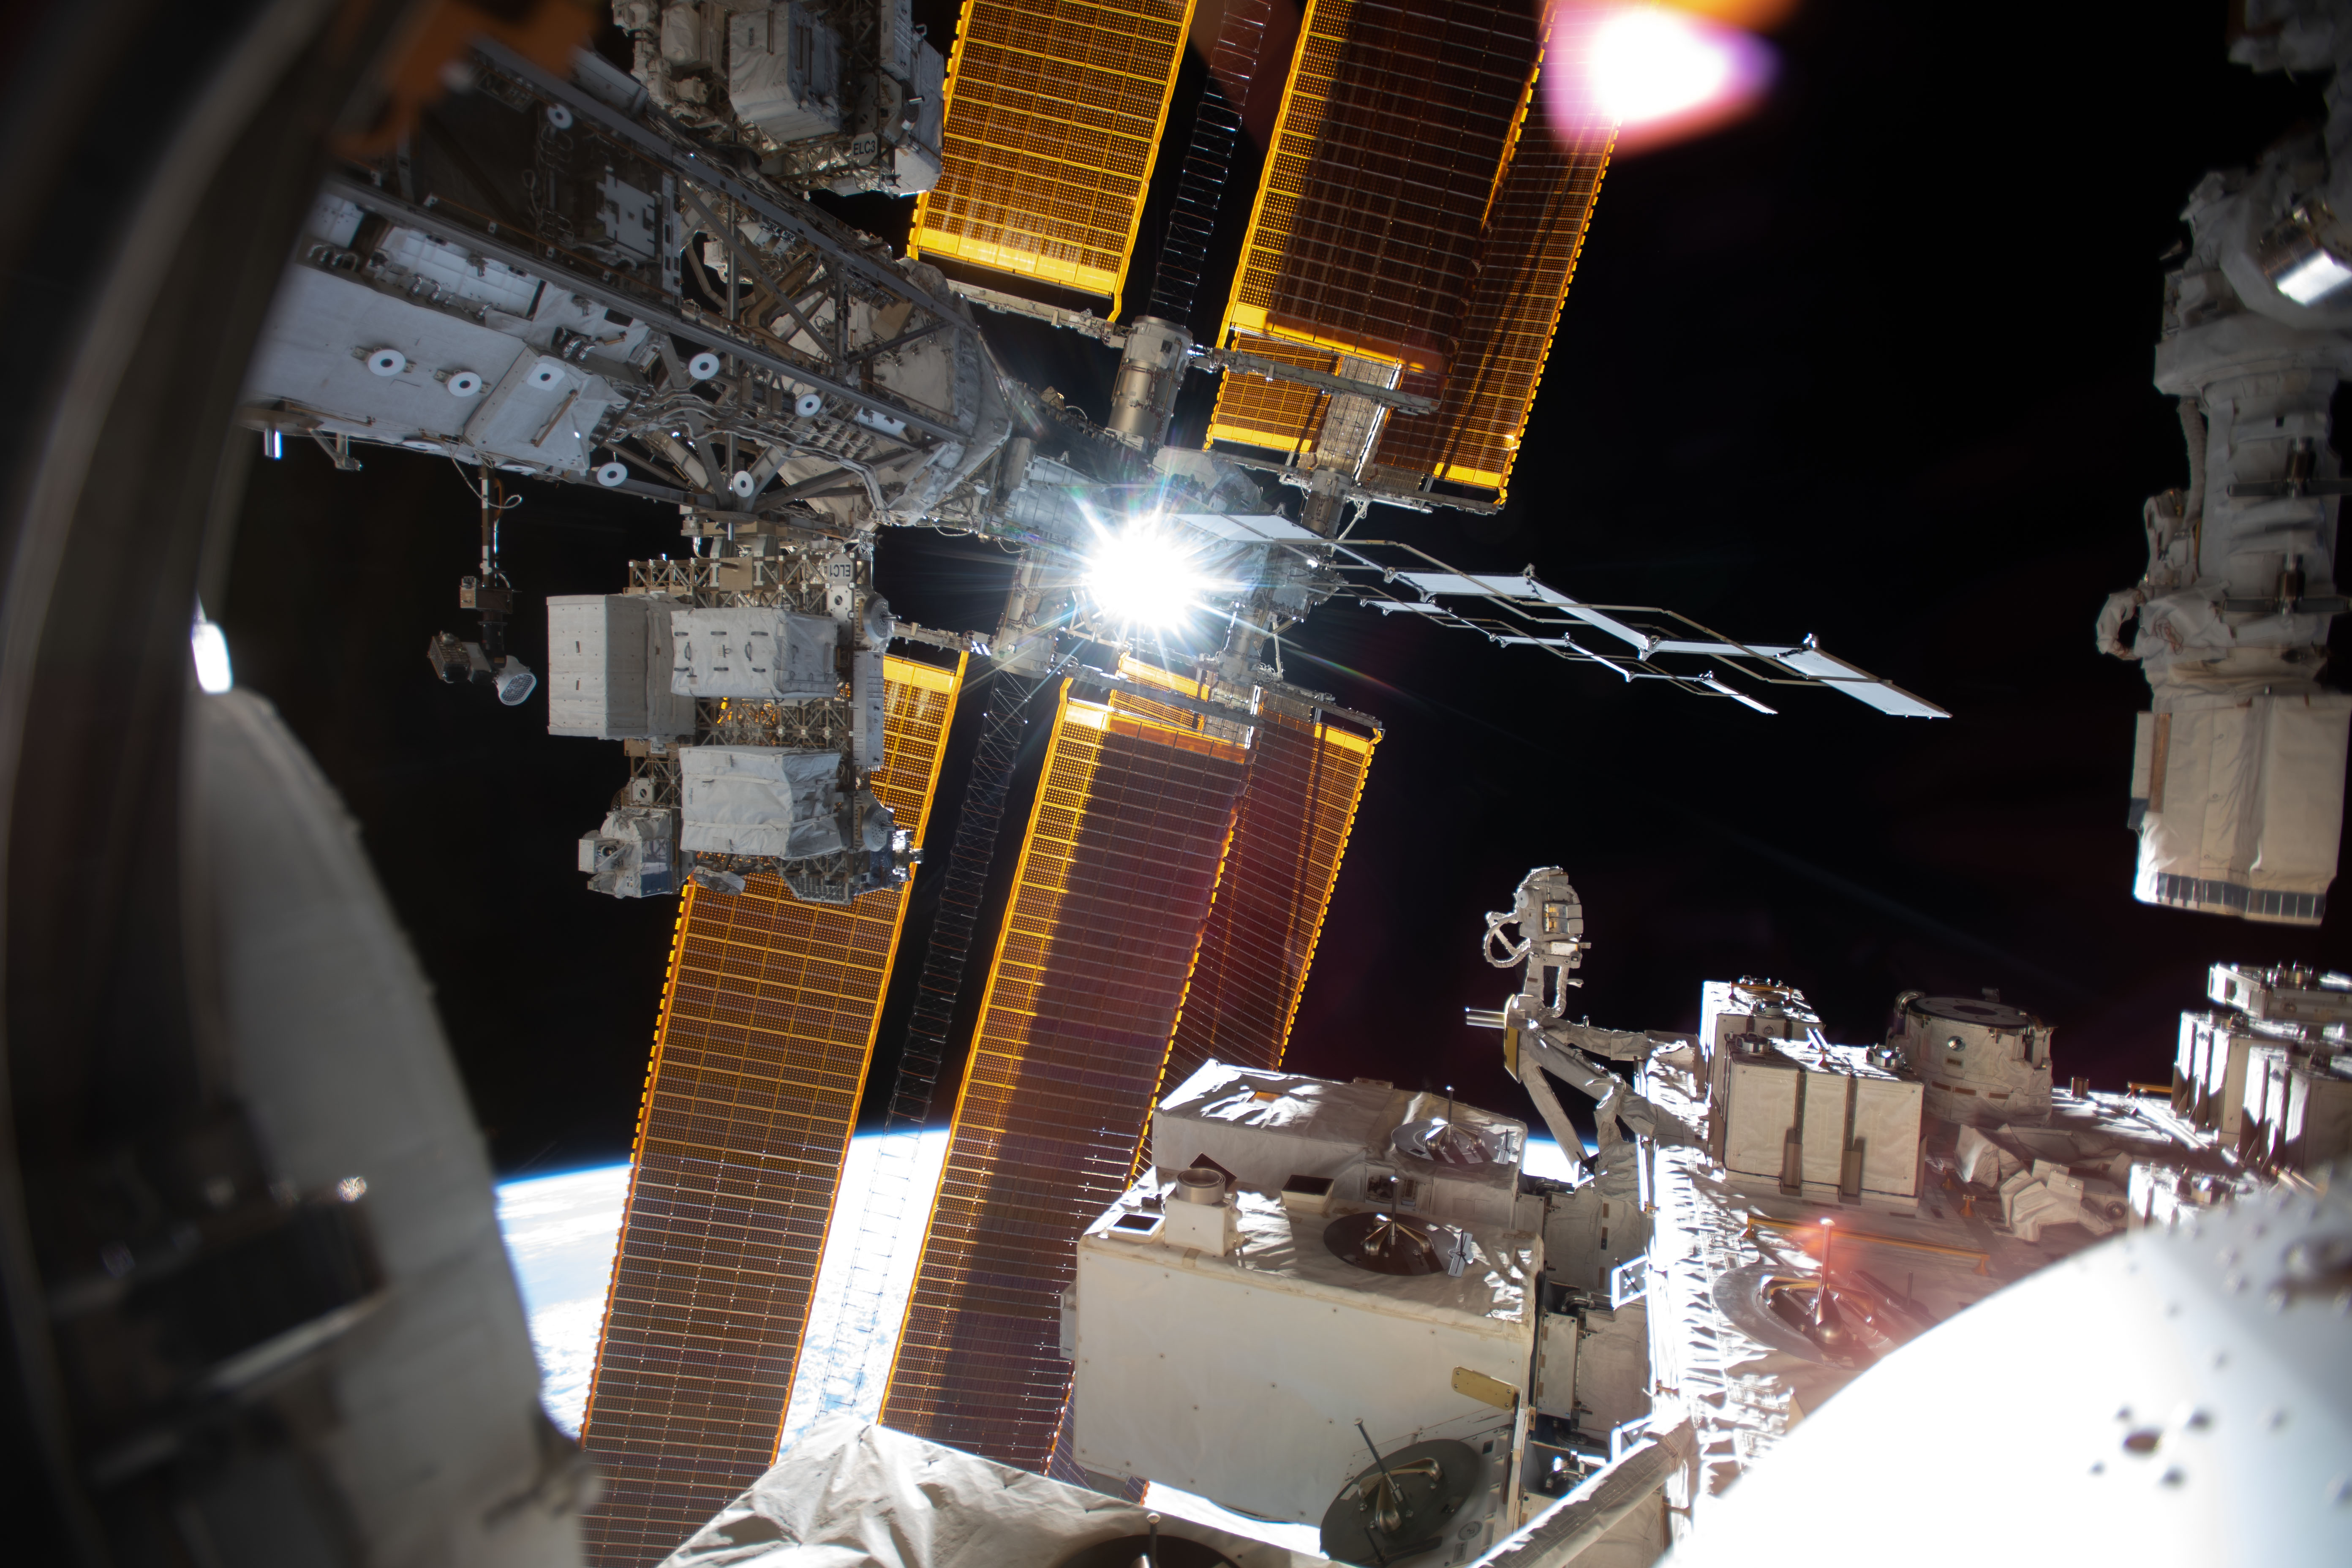
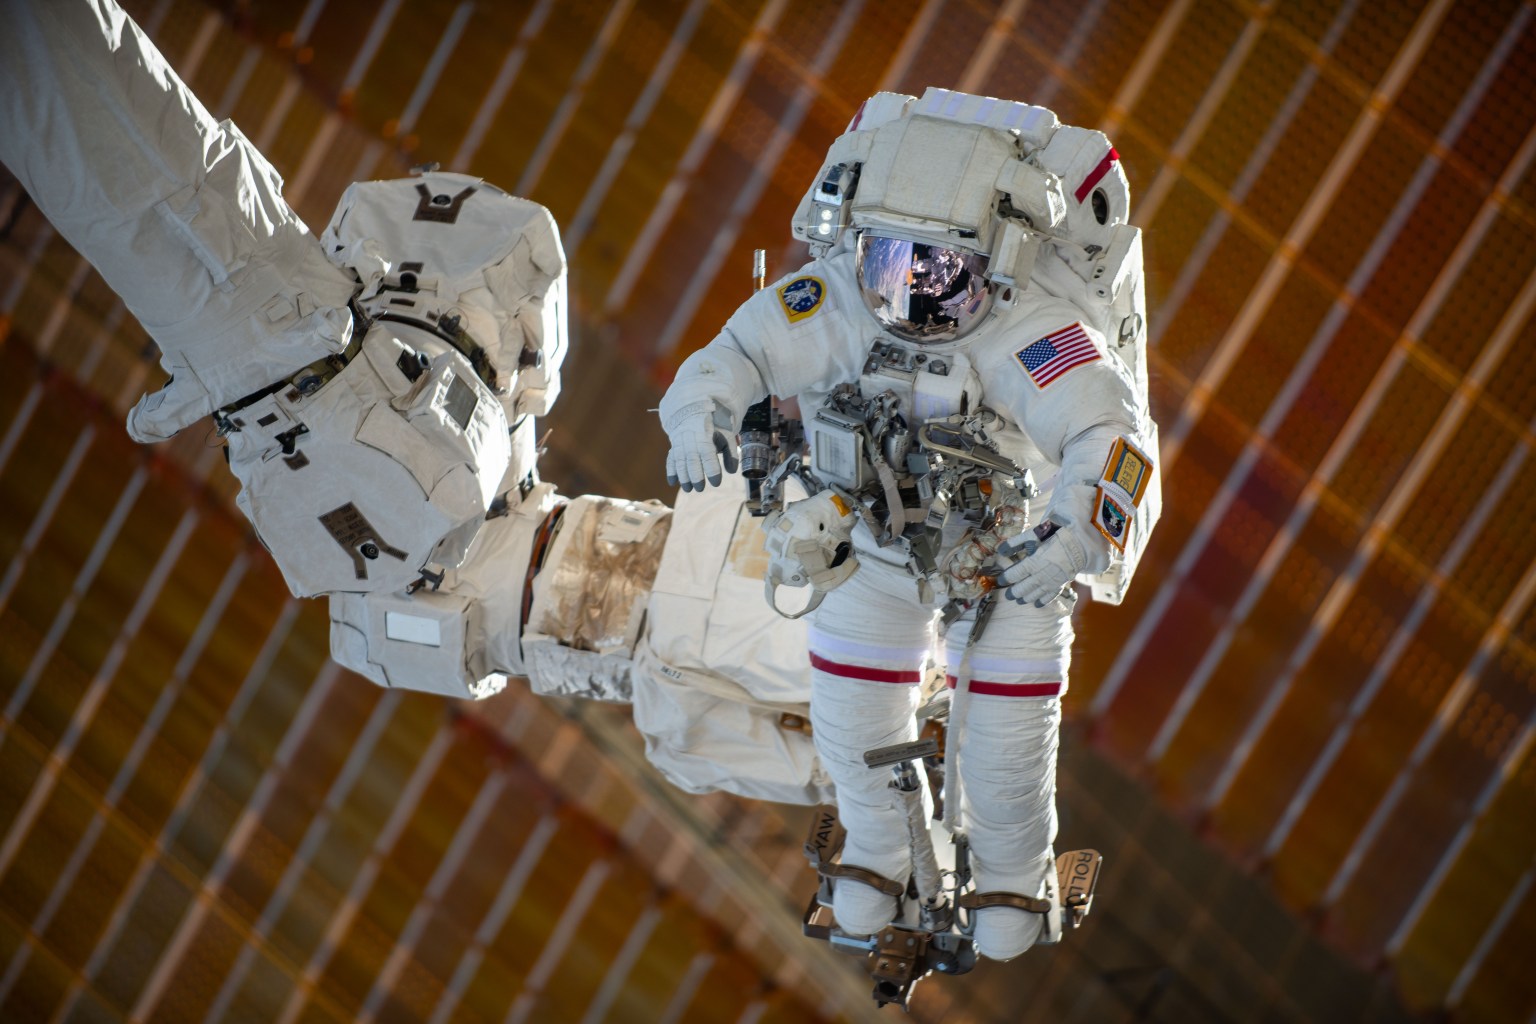
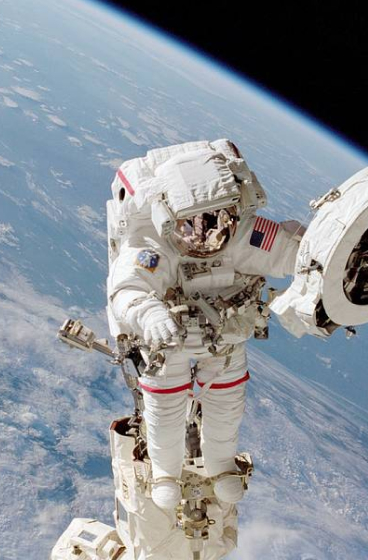
NASA astronaut Anil Menon conducts a spacewalk on Aug. 6, 2026, to prepare the International Space Station for future upgrades to its power system.
Credit: NASA
NASA will preview two upcoming spacewalks to complete solar array installation and power augmentation of the International Space Station during a news conference at 2 p.m. EDT, Tuesday, Oct. 20, from NASA’s Johnson Space Center in Houston.
NASA will stream the event through a variety of platforms. Learn where to watch online:
United States-based media interested in attending in person must contact the Johnson newsroom no later than 3 p.m., Monday, Oct. 19, at: [email protected]. Media joining by phone should request dial-in details by the same deadline. To ask a question, media must dial in no later than 15 minutes before the start of the news conference.
Thursday, Oct. 29
During U.S. spacewalk 100, NASA astronaut Anil Menon and CSA (Canadian Space Agency) astronaut Joshua Kutryk will exit the station’s Quest airlock to install and deploy an International Space Station Roll-Out Solar Array (IROSA) on the 2A electrical power channel. The solar array will be the seventh IROSA and will provide additional power to support critical station operations, including its safe and controlled deorbit.
Thursday, Nov. 5
During U.S. spacewalk 101, Menon and Kutryk will install and deploy the eighth and final IROSA on the 3B channel of the space station, completing the power augmentation upgrades.
The final two roll-out solar arrays will complete the space station’s power system augmentation. Together, the eight roll-out arrays will increase available power by up to 30%, boosting the station’s electric power generation capacity from 160 kilowatts to approximately 215 kilowatts.
NASA will share additional coverage details about U.S. spacewalks 100 and 101 closer to each operation on the agency’s live events web page and the space station blog. The spacewalks will be the 285th and 286th conducted in support of space station assembly, maintenance, and upgrades.
To learn more about International Space Station research, operations, and its crews, visit:
Unlike a tornado or thunderstorm that can deliver destruction in minutes, El Niño exerts its influence over many months. This year, a drought accompanying El Niño has left the Amazon rainforest primed to burn, and scientists say the region has entered the early stages of what they think will be a long and severe fire season.
Starting in September 2026, satellites detected sharp increases in fire activity and smoke emissions in the central and eastern Amazon, visible in fire and emissions monitoring platforms including NASA’s Fire Information for Resource Management System (FIRMS), the Global Fire Emissions Database (GFED), and NASA Worldview. The region with elevated fire activity stretches from forests surrounding the commercial and transportation centers of Manaus and Santarém to the mouth of the Amazon River.
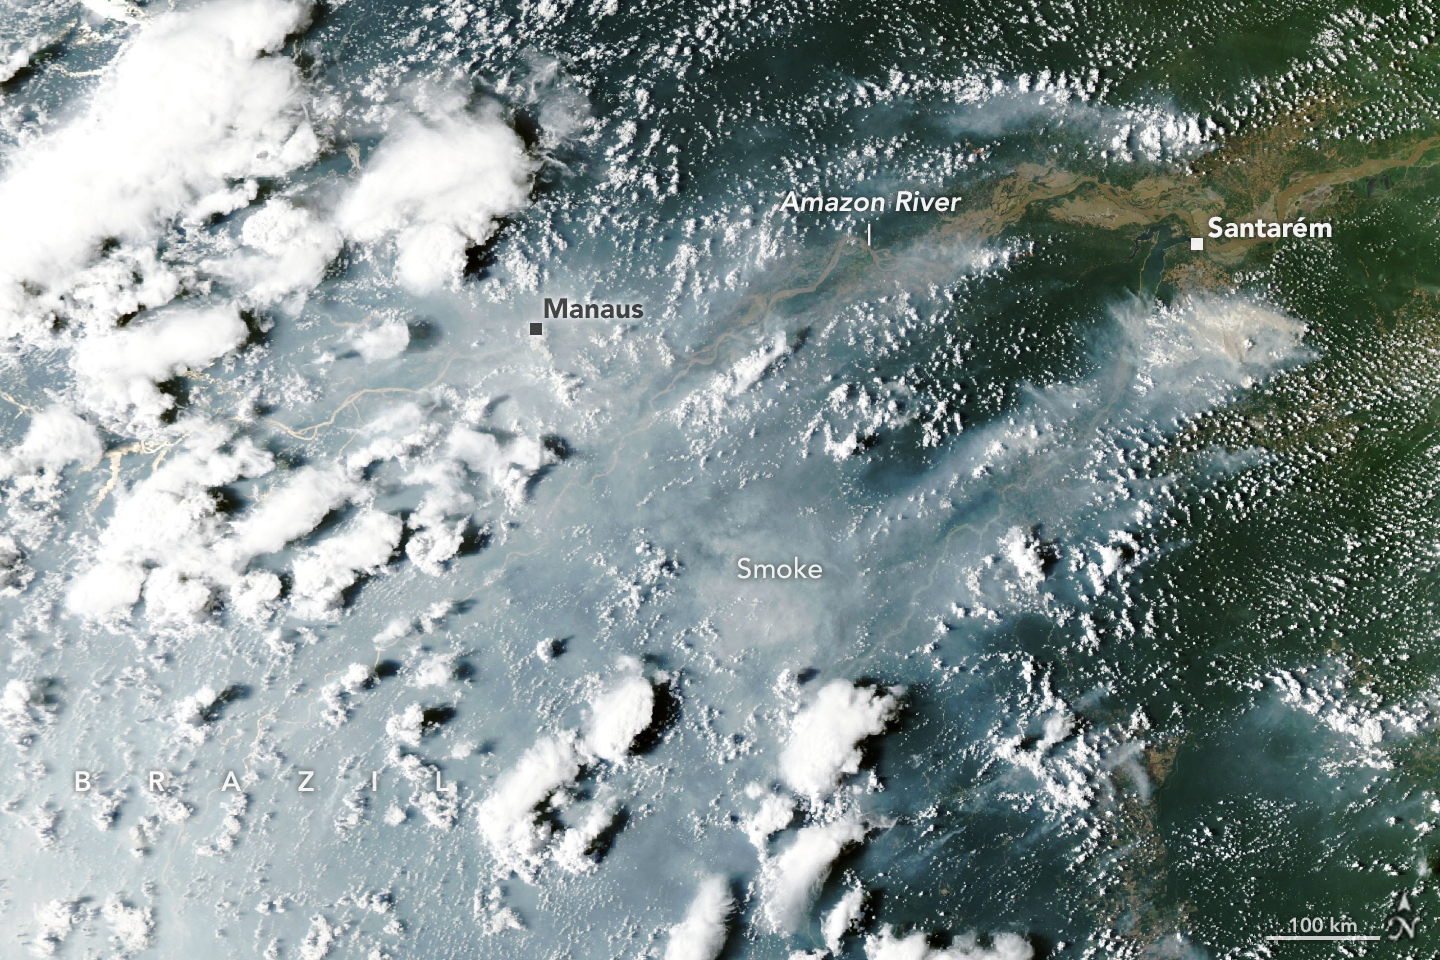
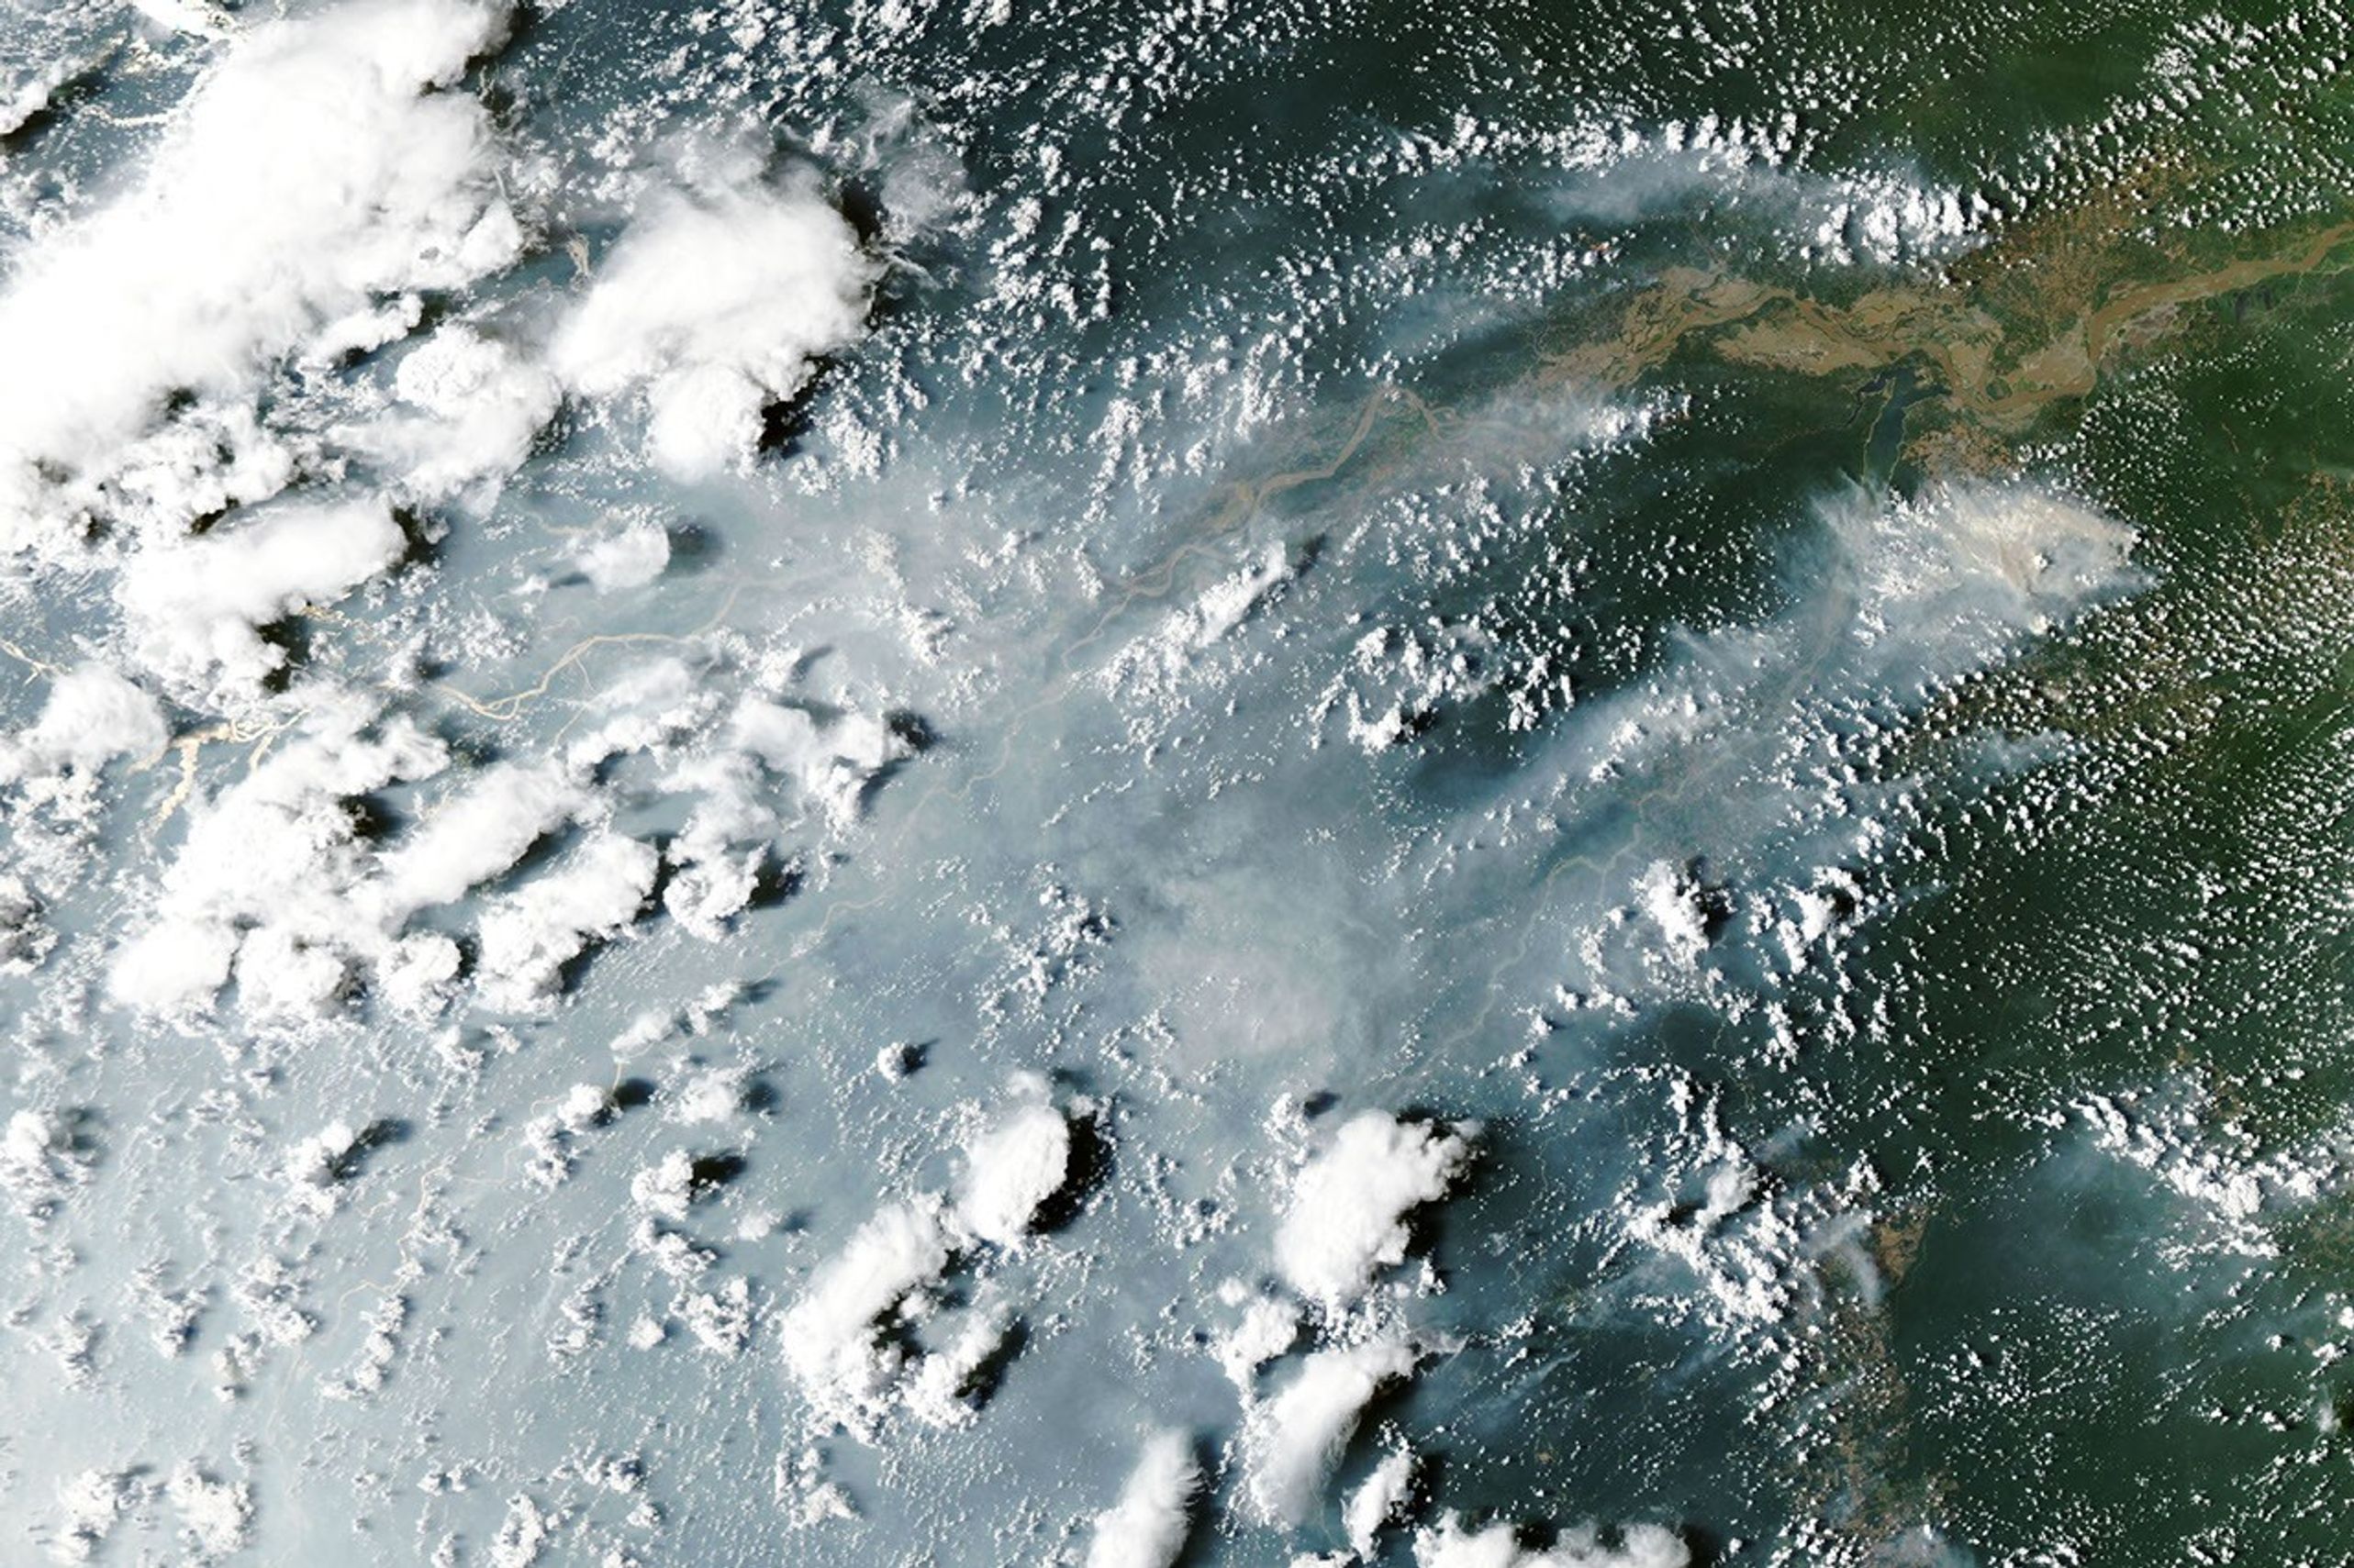
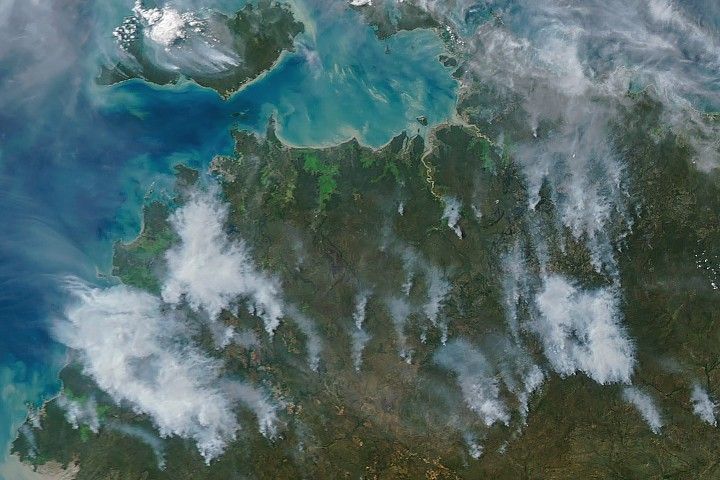
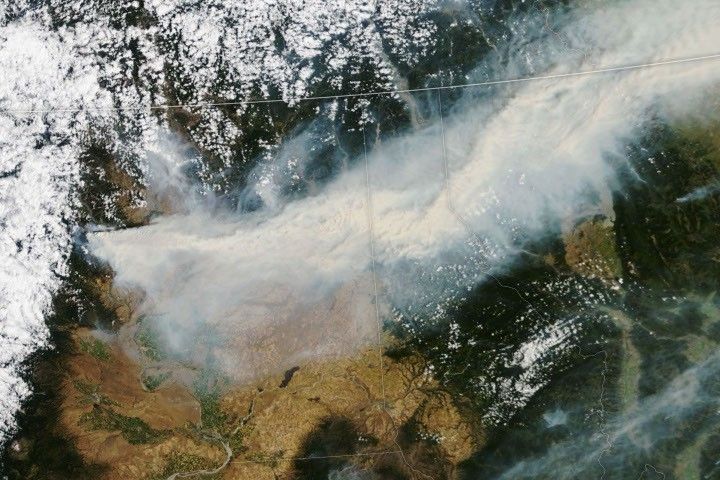
When the MODIS (Moderate Resolution Imaging Spectroradiometer) on NASA’s Aqua satellite captured this image of smoke streaming from fires on both sides of the Amazon River on October 12, 2026, heavy smoke socked in Manaus, the capital of the Brazilian state of Amazonas. That day, city officials reported extremely poor air quality, with fine particulate matter (PM2.5) values above 135 micrograms per cubic meter, the second-worst rating on a regional air quality index. The pall disrupted daily life in a city of more than 2 million people. Schools closed, and citywide events and children’s sports leagues were canceled as officials warned of hazardous air quality, according to news reports.
The burning around Santarém and Manaus is part of a “cascade” of fire in the tropics that accompanies the disrupted rainfall patterns of an El Niño, said Douglas Morton, an Earth system scientist based at NASA’s Goddard Space Flight Center. The pattern begins along the equator with drought and peat fires in Indonesia, followed by elevated fire activity in this part of the Amazon. Morton and colleagues from the University of California, Irvine; Vrije Universiteit Amsterdam; and the University of Maryland detailed the pattern in a 2017 study following the destructive fire season that accompanied the 2015–2016 El Niño. They also saw the pattern play out in 2023.
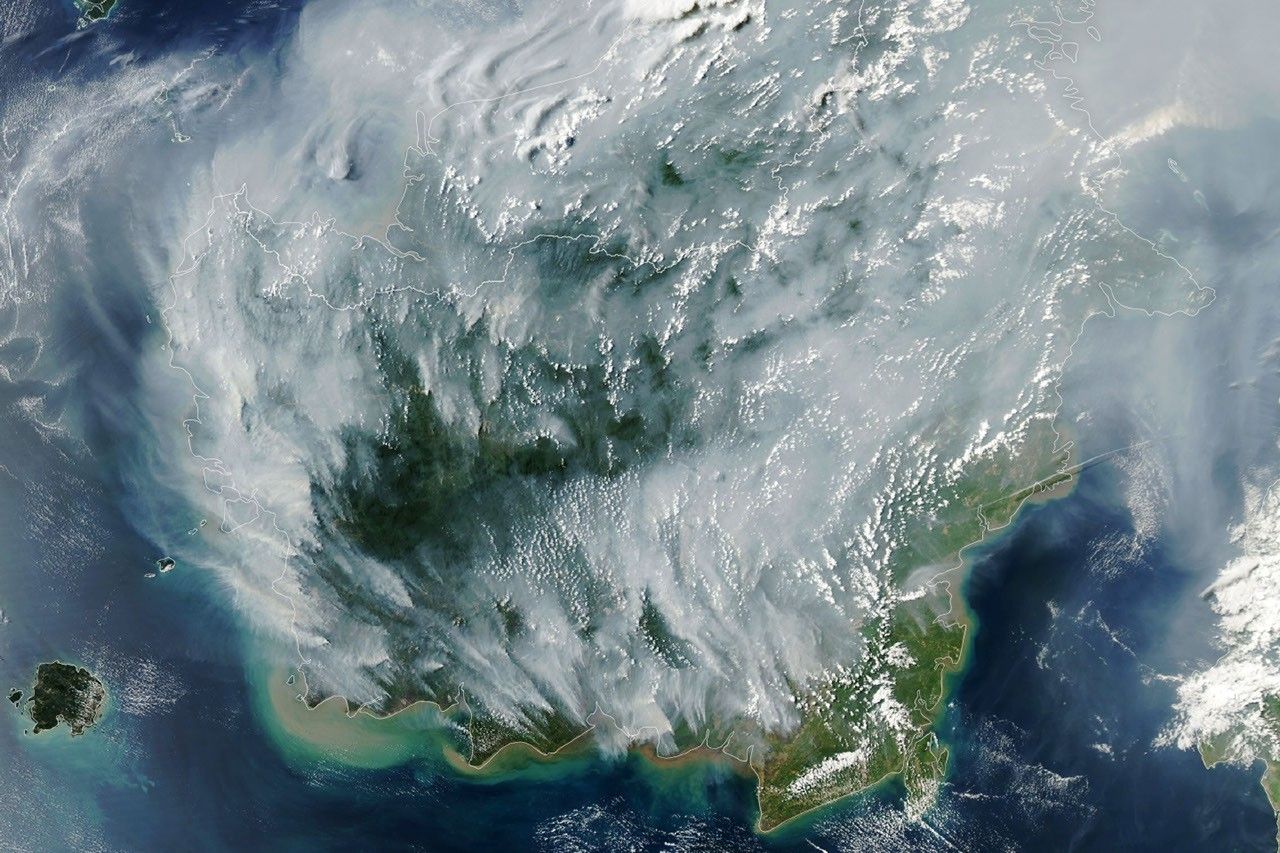
A swell of fire in the tropics riding the 2026 El Niño has followed the pattern. Drought, fire, and smoke have smothered parts of Indonesia since August, with hundreds of homes razed in October and thick smoke blanketing whole islands most days. “Now, in the Amazon, we’re seeing the second domino in the cascade fall,” Morton said, referring to the uptick in fires that has begun in Pará and Amazonas.
Morton and his colleagues expect the next wave of fire to hit farther north in November and December in the Brazilian states of Roraima, northern Pará, and Amapá, as well as parts of Venezuela, Guyana, and Suriname. Finally, around August and September 2027, he said, drought and fire risk will peak in the southern Amazon regions of Brazil and Paraguay.
“It’s so striking—and frustrating—that this is happening all over again,” said Morton, adding that many of the same forests that burned during the El Niño events in 2023 and 2015 are burning again. Forest fires in these rainforests are known to cause especially serious ecological damage because most species are not adapted to fire. It’s likely that some of the forest fires will burn even more intensely this time because the earlier fires partially charred trees, degrading the forest and making what remained more susceptible to burning, he added.
Morton expects the fires around Santarém and Manaus to continue burning until the rainy season arrives in December 2026 or January 2027. For the regions to the north and south, there is still time to prepare. “Given the intensity of this El Niño, this really is the year for people to avoid burning at all costs,” Morton said.
It’s so wet in the Brazilian Amazon that lightning ignites less than 1 percent of fires, so the vast majority of fires currently burning there were started by people, Morton said. But this year’s drought, worsened by El Niño, has been intense. Brazil’s National Institute of Meteorology reported that Manaus rainfall levels were 95 percent less than normal in August and 60 percent less than normal in September.
The large fires in this region began as management fires—clearing shrubs from pastures or crops from fields, for instance—but have escaped and are now burning freely through the parched understory of the rainforest, he added. Analysis of satellite observations indicates there are 50 to 70 uncontrolled fires burning in the Santarém region alone, said Shane Coffield, a University of Maryland assistant research scientist at NASA Goddard.
As part of a NASA Earth Action project, Coffield is mining fire observations from VIIRS (Visible Infrared Imaging Radiometer Suite) to identify fires that didn’t meet the threshold for inclusion in official data products distributed by FIRMS. He plans to share the locations of these “candidate fires” with scientists at MapBiomas, a multi-institutional network comprising universities, NGOs, and technology companies that maps fires and land-use change in the Amazon.
“For the area around Santarém, we’ve identified about 40 percent more fires than you’ll see in active fire counts from FIRMS,” said Coffield. Satellites often miss fires in circumstances like this due to dense smoke, clouds, and tree canopy cover, which can block the sensors from detecting the infrared signal of fires—especially lower-intensity fires spreading along the forest understory. “On some of the smokiest days, we have very few detections from MODIS and VIIRS, and we know that isn’t right.”
NASA Earth Observatory images by Lauren Dauphin, using MODIS data from NASA EOSDIS LANCE and GIBS/Worldview. Story by Adam Voiland.
Discover the cosmos! Each day a different image or photograph of our fascinating universe is featured, along with a brief explanation written by a professional astronomer.
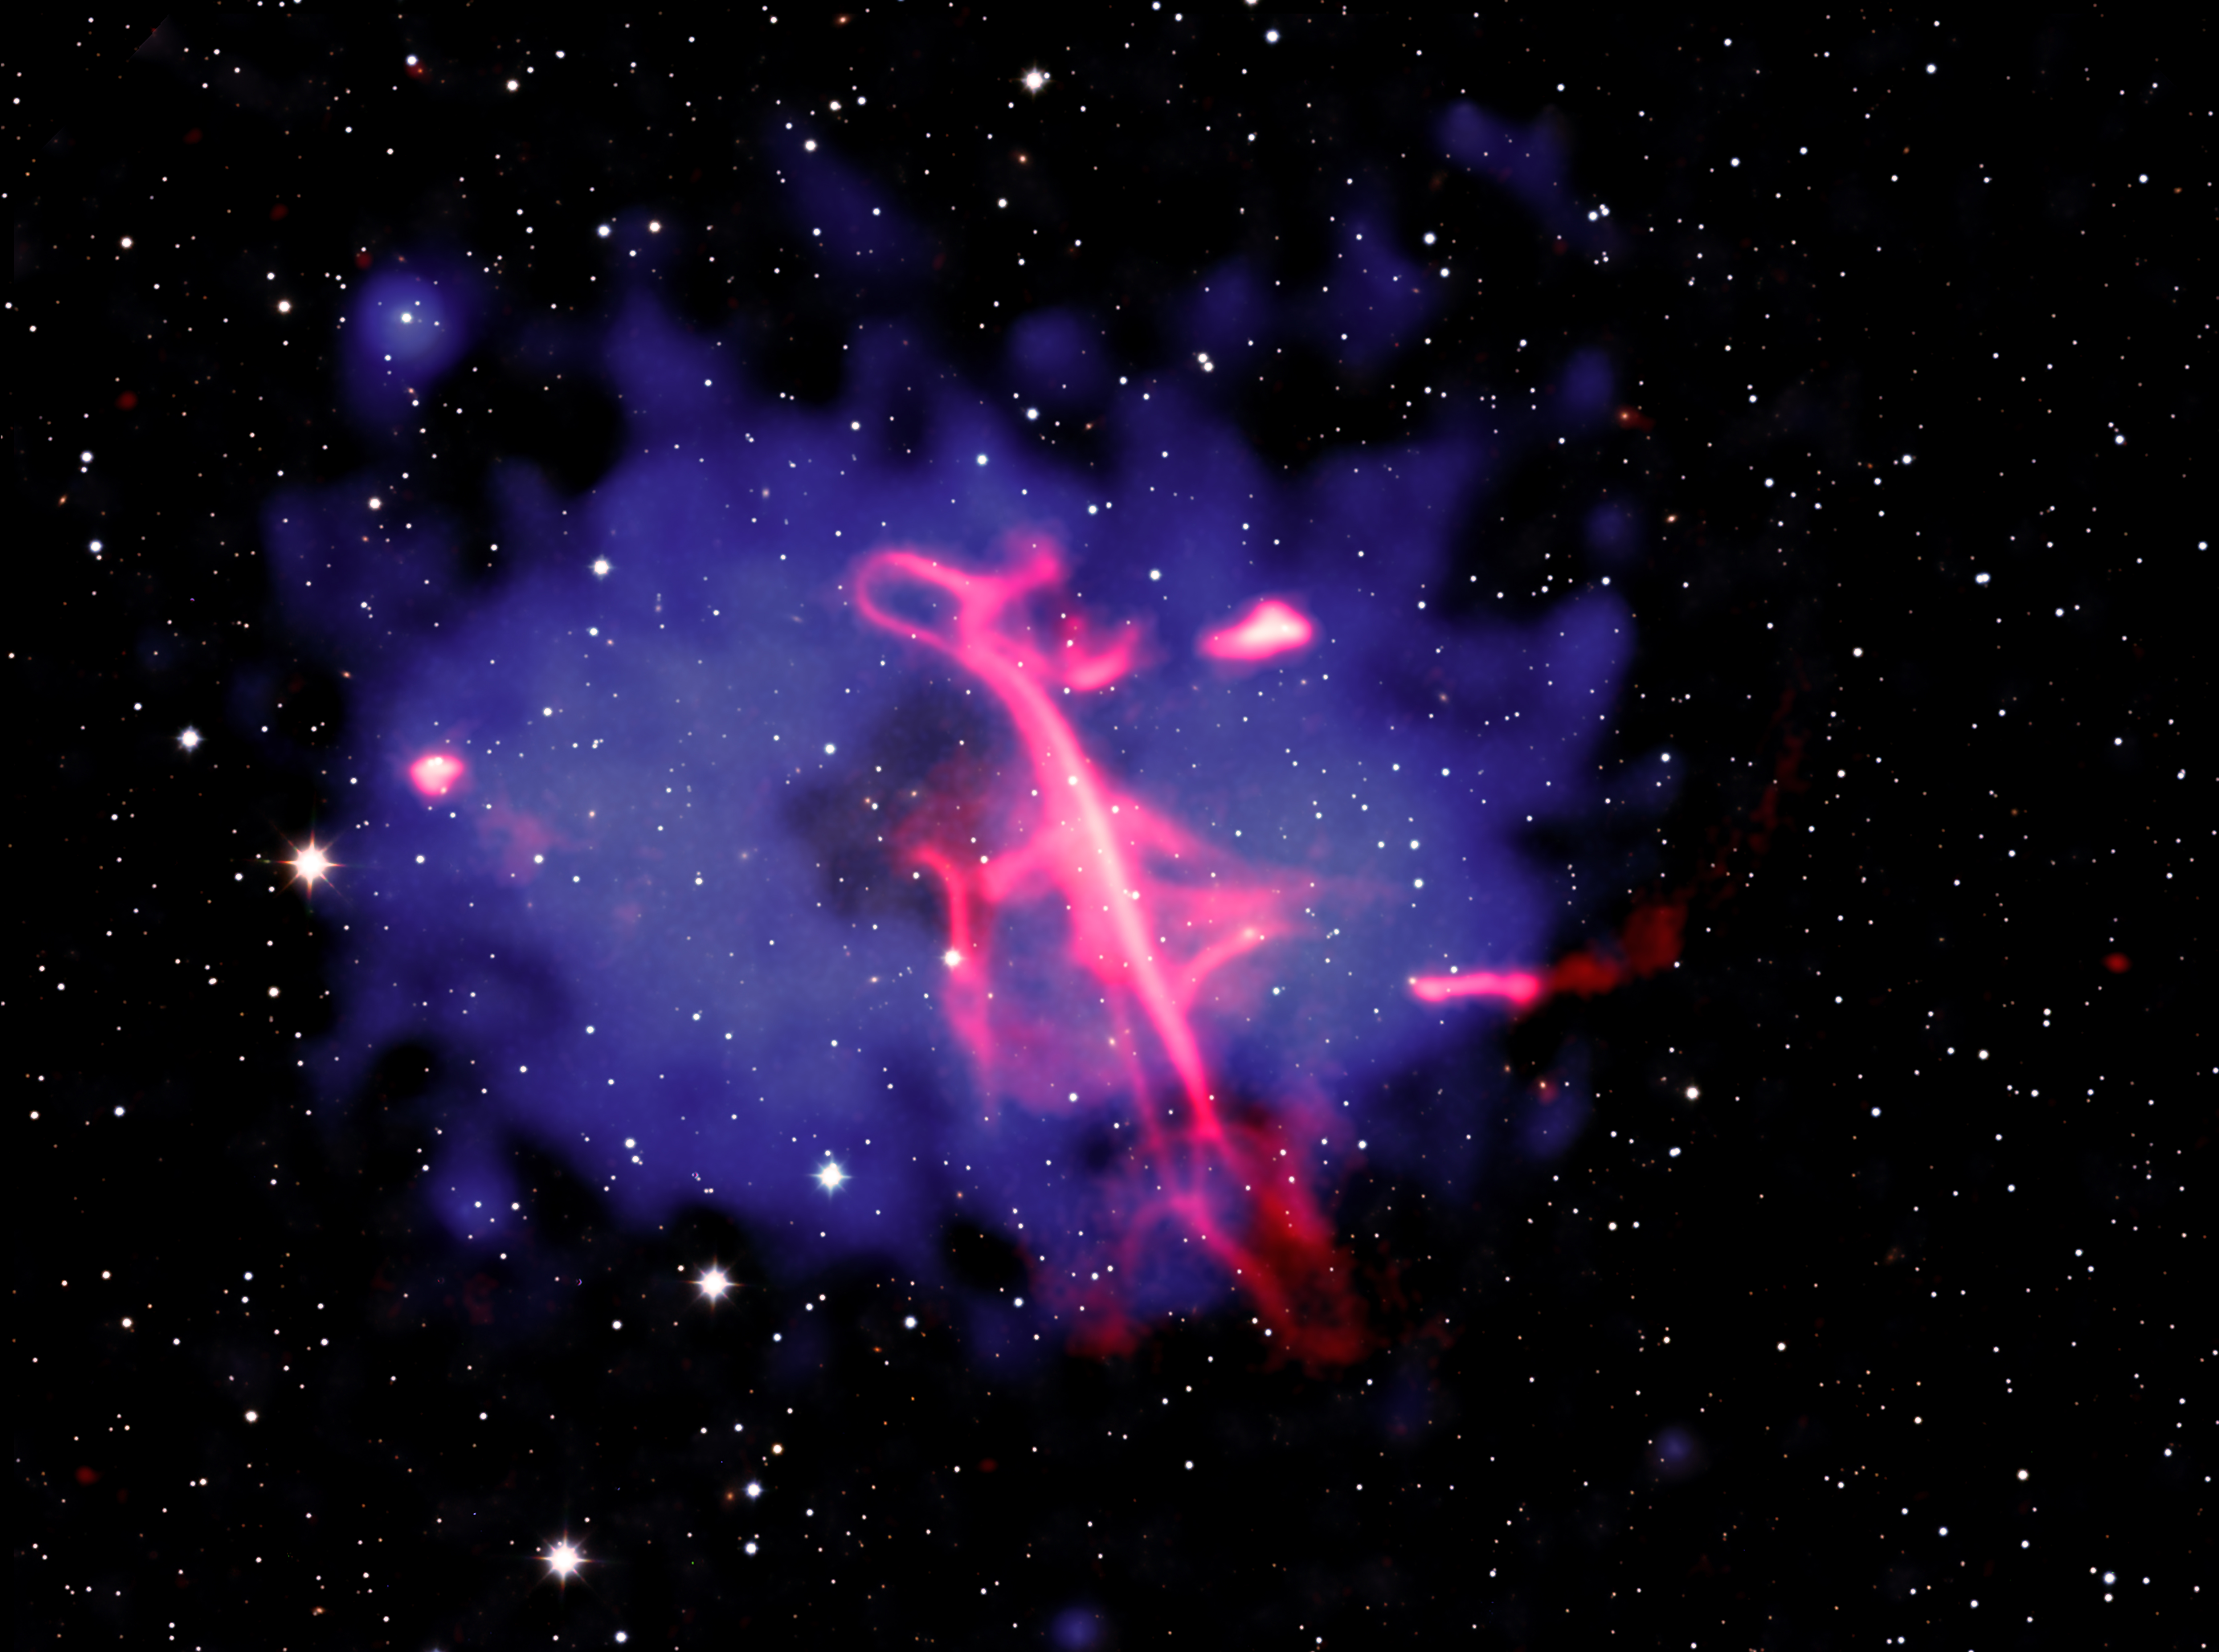
A formation of radio waves looks remarkably like a treble clef in this Oct. 14, 2026, image from NASA’s Chandra X-Ray Observatory. Researchers used Chandra to find that the Treble Clef is likely caused by an outburst from a supermassive black hole, followed by a collision of two galaxy clusters.
A post‑mission comparison of the Orion spacecraft heat shields from Artemis I (left) and Artemis II (right) are shown after removal from their crew modules. Both heat shields are seen rotated for inspection inside the Operations and Checkout Building at NASA’s Kennedy Space Center in Florida.
NASA
NASA’s Artemis II mission sent four astronauts around the Moon and brought them safely back to Earth, laying a foundation for crewed flights to the Moon’s surface.
Additional engineering data analysis of the Orion spacecraft’s heat shield confirmed initial data showing the heat shield performed as expected.
In particular, NASA measured whether the thermal protection system effectively safeguarded the crew and Orion systems as the spacecraft reentered Earth’s atmosphere. This test flight was the first time astronauts flew aboard Orion.
Orion reached a maximum velocity of 39 times the speed of sound and experienced external temperatures exceeding 4,000 degrees Fahrenheit at its peak, all while the four astronauts inside Orion stayed relatively cool with a cabin temperature in the mid-70 degree Fahrenheit range during their return to Earth from the Moon.
After NASA’s thorough analysis of Artemis I heat shield findings, informed by extensive arc jet material testing at NASA’s Ames Research Center in California’s Silicon Valley, the agency modified Orion’s reentry trajectory for Artemis II by shortening the maximum downrange distance the spacecraft could fly between when it entered Earth’s atmosphere and splashed down in the Pacific Ocean. Analysis prior to the mission showed that limiting downrange distance would limit how long the spacecraft’s heat shield spent in the temperature range at which the Artemis I heat shield phenomenon occurred.
Shortly after Artemis II splashdown on April 10, 2026, U.S. Navy divers captured underwater imagery of the Orion spacecraft’s heat shield.
US Navy
The spacecraft reentered with precision, entering within only 192 feet of its targeted entry interface, and successfully splashed down only 0.59 miles from the predicted landing site off the coast of San Diego. Initial inspections of the thermal protection system, including diver imagery of the spacecraft’s heat shield taken just after splashdown and further inspections on the recovery ship, found it performed as expected, with a significant reduction in the amount of cracks and char loss as compared to Artemis I.
Upon the spacecraft’s return to NASA’s Kennedy Space Center in Florida after the Moon mission, thermal protection system experts began additional examination of the heat shield, made of 186 unique blocks of an ablative material called Avcoat. The heat shield was then transported to NASA’s Marshall Space Flight Center in Huntsville, Alabama, where work on sample extraction and internal x-ray scans began in August to provide further engineering insight into the system and behavior of the material.
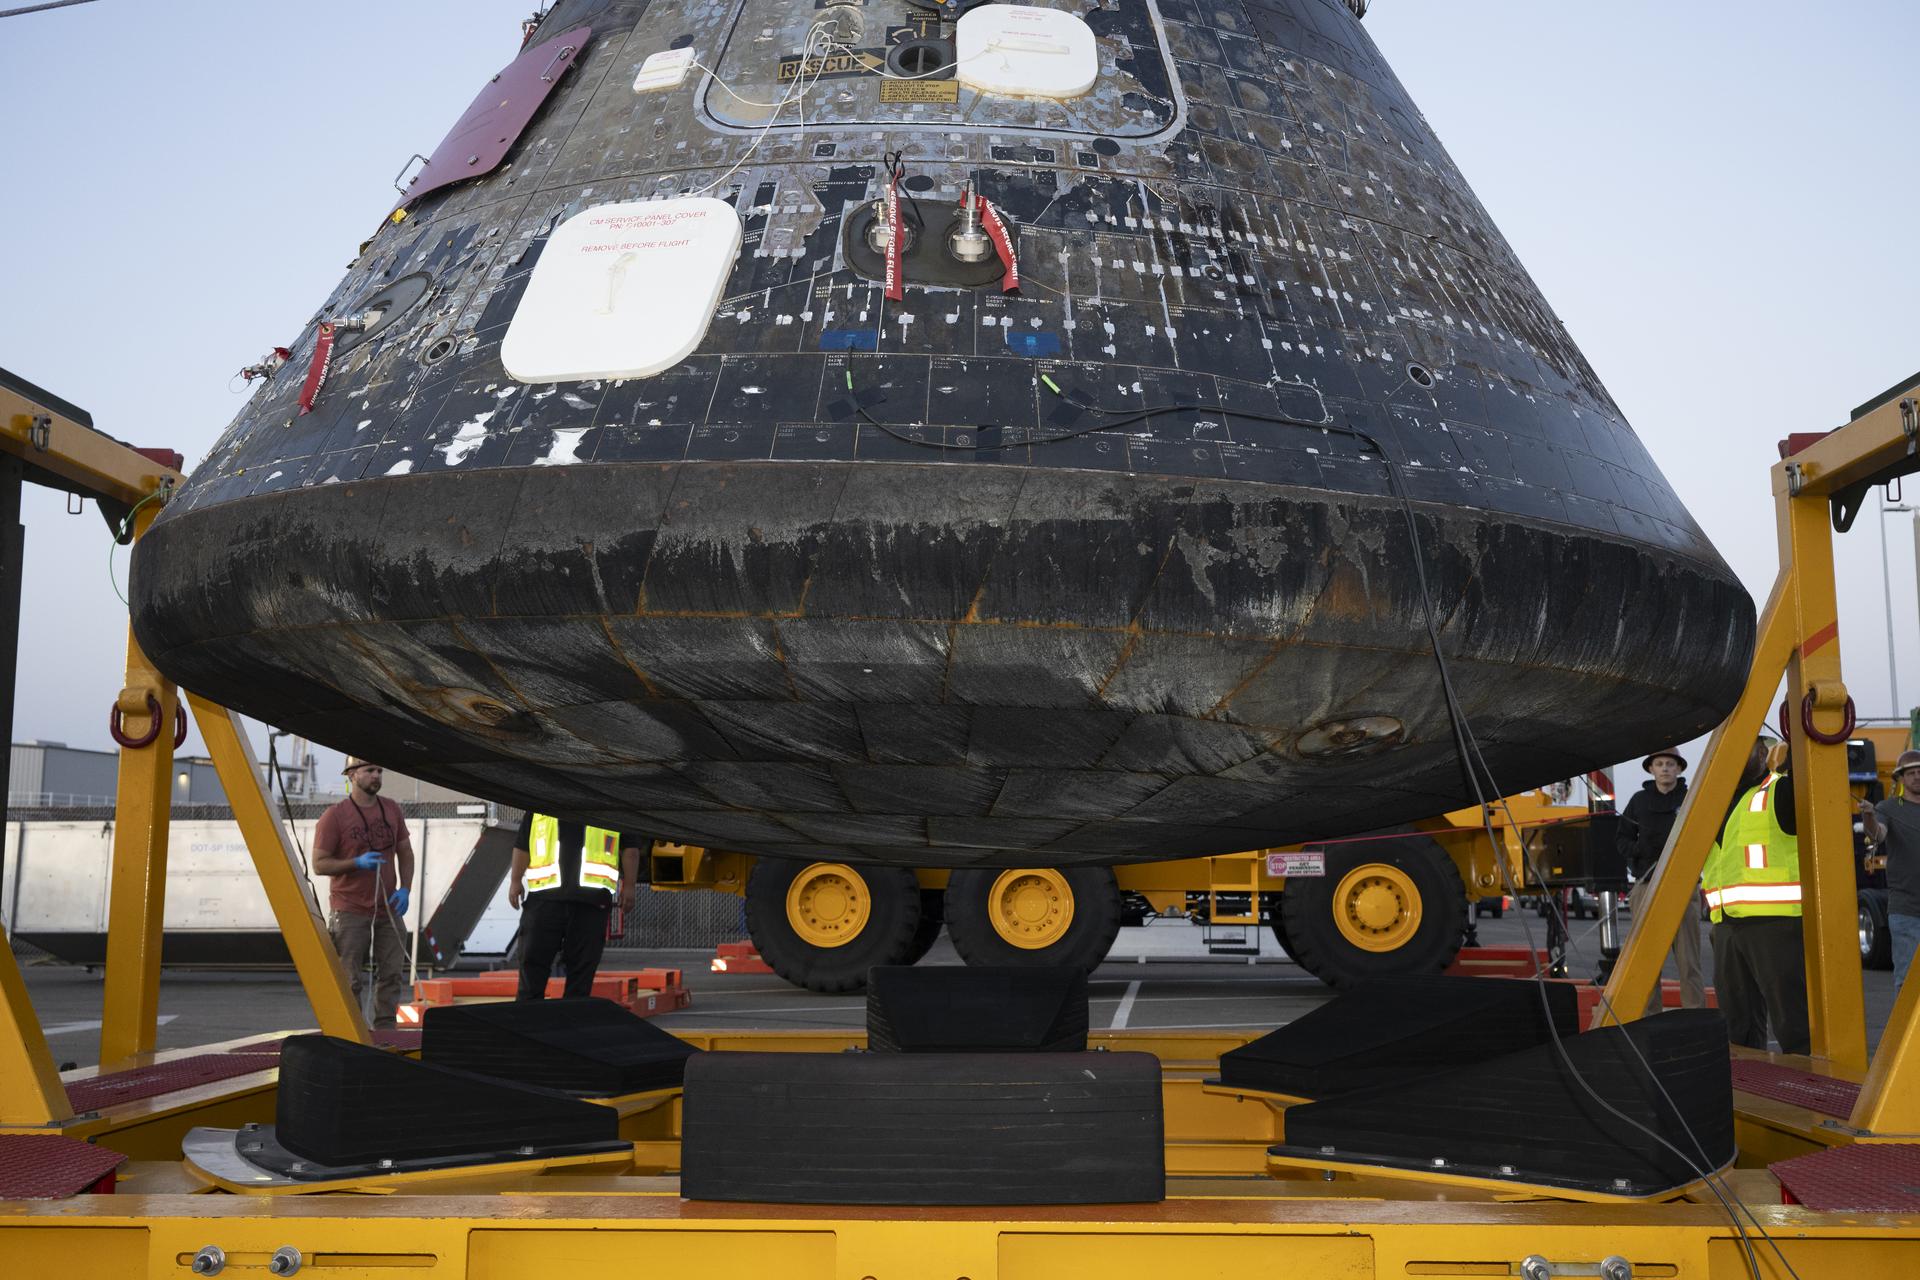
The Artemis II Orion crew module after being offloaded from the well deck of USS John P. Murtha at Naval Base San Diego and lifted from the Orion Recovery Cradle Assembly on April 18, 2026. The gray area, as seen on the edge where the spacecraft’s heat shield and the backshell meet, is from recovery operations.
NASA/Kevin Davis
A thorough post-flight assessment review found that Orion’s aerodynamic and aerothermal performance, including the heat shield and backshell thermal protection system, was in line with engineering predictions based on pre-flight analyses and ground testing. The shorter allowable down range during entry reduced the cracking and char loss experienced on the Artemis II heat shield relative to the Artemis I heat shield by a factor of ten, proving the effectiveness of the trajectory modification. Engineers found only nine spots of char loss of varying sizes on the Artemis II heat shield dish, compared to 103 during Artemis I.
The analysis also showed that Orion’s robust heat shield design showed consistency from Artemis I to Artemis II, evident by the performance of system features such as the seams between the heat shield Avcoat blocks and the Avcoat surrounding the heat shield compression pad separation bolts.
Post-flight inspection of Orion’s backshell, the protective cover on the sloped sides of the crew module made up of 1,300 ceramic tiles, showed expected performance across the crew module surface. Visual inspections indicated backshell features designed to seal and protect penetrations such as windows, vents, thrusters, and the side hatch also met expectations, with no signs of overheating observed.
The team also performed post-flight laser scans of the heat shield surface and is comparing this data to pre-flight measurements to determine material recession, which will then be compared to analysis predictions. Engineers are continuing with heat shield sample extraction at NASA Marshall and subsequent material test and assessment and thermal analysis, to support long-term heat shield development, manufacturing efforts, and data capture.
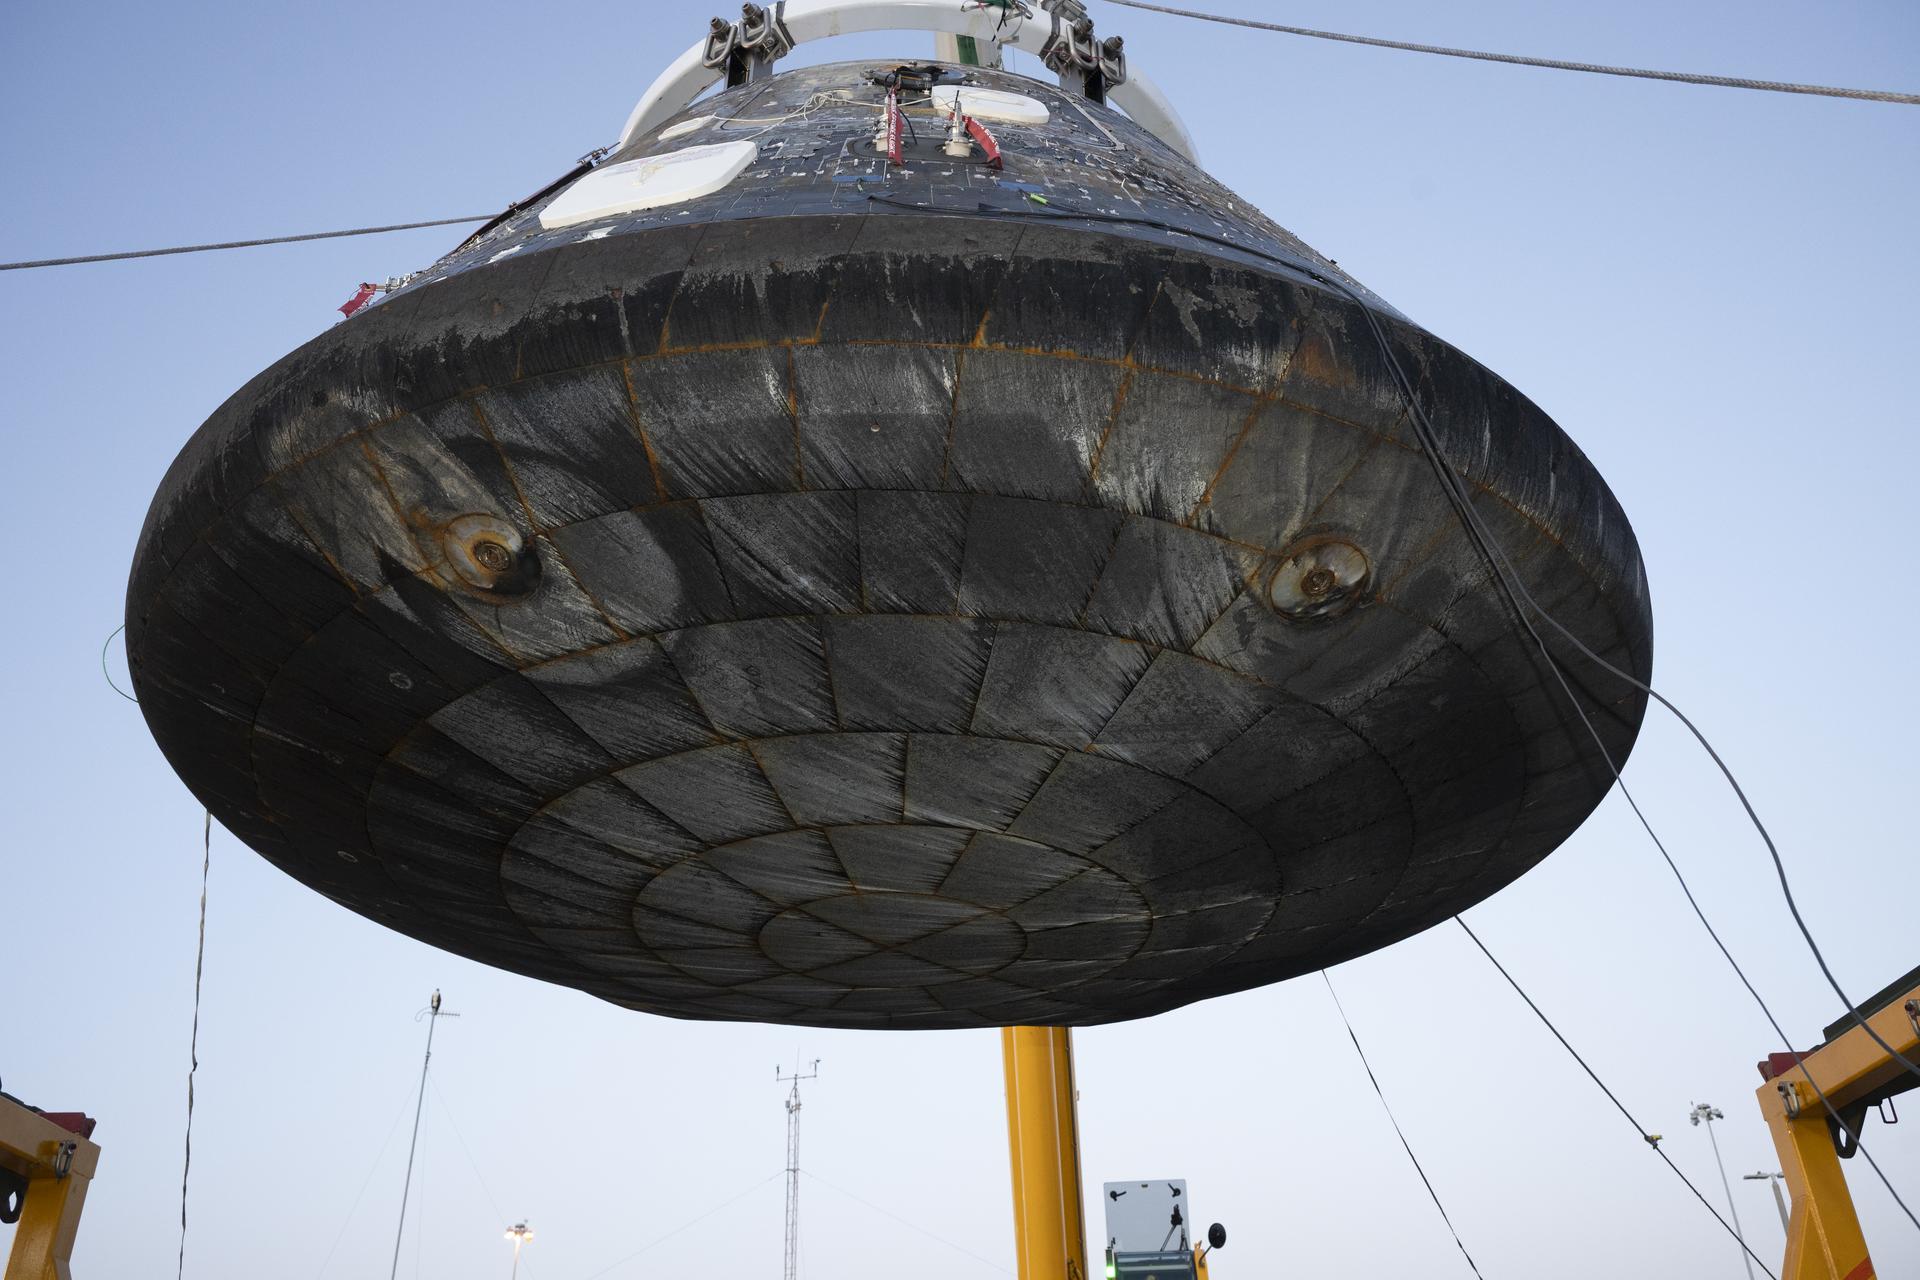
The Artemis II Orion crew module is lifted from its recovery fixture for inspection and engineering imagery after being offloaded from the USS John P. Murtha at Naval Base San Diego on April 18, 2026. The recessed areas, or smaller concentric circles, seen on the heat shield are associated with the separation bolts that connect the crew module with the service module. The larger circular patterns are formed due to compression pad material used within this location of the spacecraft, creating flow disturbances caused by extreme aerodynamic and thermal airflow during reentry. This causes increased heating locally and therefore Avcoat ablator thickness is increased in these areas by design.
NASA/Kevin Davis
Orion’s performance and the team’s analysis on Artemis II reflect system robustness, capability to support crew, and critical insights gathered that will enhance the Artemis III mission and beyond. Following the extensive Artemis I heat shield investigation, upgrades were made to the heat shield design for Artemis III to achieve uniformity and consistent permeability of the Avcoat blocks. Technicians attached the heat shield for the Artemis III Orion crew module at NASA Kennedy in early July, and the Orion crew and service modules were joined at the end of July. The spacecraft has since been successfully powered up for the first time, enabling engineers to check all connection lines between the two modules are working as planned.
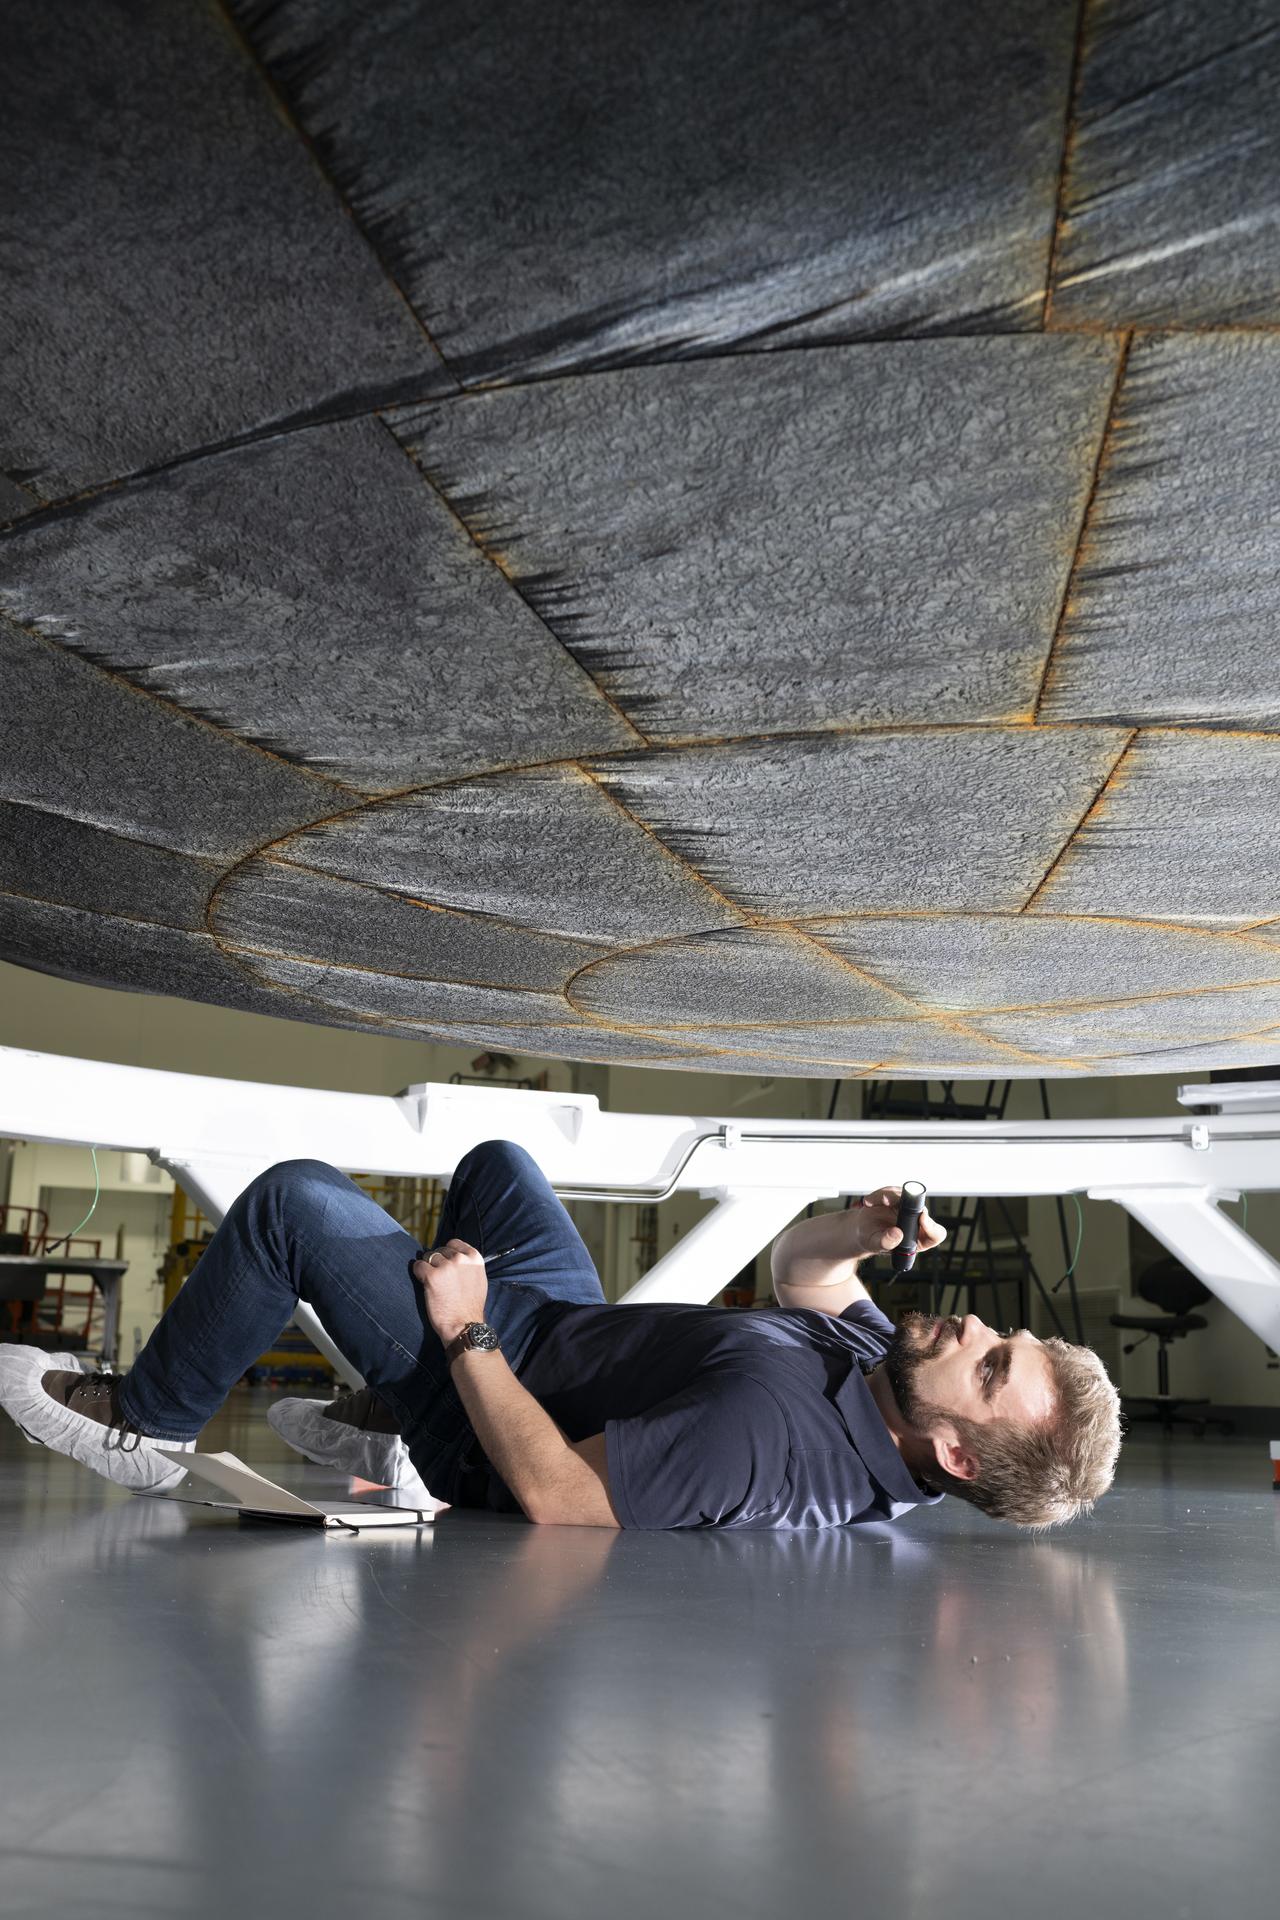
An engineer from NASA’s Ames Research Center inspects the Artemis II Orion heat shield at NASA Kennedy’s Multi-Purpose Payload Facility on April 30, 2026, prior to its removal from the crew module. The orange tint seen between Avcoat tiles is an expected effect of the silicone used to fill the gaps between the blocks. The silicone gap filler contains iron oxide, which gives it a red appearance after enduring reentry.
NASA/Kevin Davis
NASA continues to advance toward Artemis III as teams ready the Orion spacecraft for next year’s mission in low Earth orbit. NASA will launch the SLS (Space Launch System) rocket and Orion spacecraft with NASA astronauts Randy Bresnik, Frank Rubio, Andre Douglas, and ESA (European Space Agency) Luca Parmitano, to rendezvous with human lander test articles from Blue Origin and SpaceX to demonstrate critical systems and operations needed for future lunar landings, beginning with Artemis IV in 2028.
NASA Awards Enable Research, Technology to Build Future Workforce
An illustration of a suited Artemis astronaut looking out of a Moon lander hatch across the lunar surface, a Lunar Terrain Vehicle and other surface elements.
Credits: NASA
NASA has selected 12 U.S. institutions to receive $12 million to accelerate academic research and technology development in support of the agency’s priorities for exploring the Moon, Mars, and deep space.
Through NASA’s Minority University Research and Education Project (MUREP) Space Technology Artemis Research (M‑STAR) initiative, selected institutions will each receive up to $1 million to grow their scientific and engineering capabilities, enhance faculty and student engagement in aerospace research, and expand their ability to compete for future federal and commercial research awards.
“We are excited to launch this new cohort of M-STAR investigators,” said Alicia Baturoni Cortez, MUREP program manager in the agency’s Office of STEM Engagement. “NASA investments in our Nation’s research institutions create real opportunities for students and faculty to build skills, knowledge, and infrastructure, while helping NASA close technology gaps for long-duration operations on the Moon and eventually, Mars.”
As NASA enters a Golden Age of innovation and exploration, the M-STAR initiative supports the agency’s mission to develop innovative technologies that improve space transportation, human exploration, robotic discovery, and the growing space economy.
The awardees and their projects are as follows:
California State University, Sacramento Adaptive Vision-Language-Action Models for Resilient Multi-Robot Collaboration in Unstructured Planetary Environments
University of Central Florida, Orlando M-FAST: Multi-Fidelity Aerothermal Simulation & Testing for Artemis
University of Hawaii at Manoa HI-STRIDE: Hawai’i Student Training in Radiation Instrumentation, Detection, and Exploration
University of Houston RODEO: Rover-carried On-surface Deployables for Exploration Operations
University of Texas, San Antonio Characterizing Physical and Mechanical Properties of Regolith at Cryogenic Conditions Using the Multi-Planetary Surface Simulator (MPS2)
Kean University, Union, New Jersey Integrating Terrain Understanding of AI Models With Robust Control for Autonomous Path Planning
Virginia Commonwealth University, Richmond BNNT-Reinforced Multifunctional Composites for Radiation-Tolerant, Hydrogen-Compatible Nuclear Thermal Propulsion (NTP) Secondary Hardware
Shaw University, Raleigh, North Carolina Project ARES (Advanced Regenerative Environmental Systems): A Materials-by-Design Research and Workforce Development Platform for Environmental Control and Surface Infrastructure
Howard University, Washington LumSHRS: Lunar monolithic Spatial Heterodyne Raman Spectrometer for Minirover In-Situ and Standoff Remote Sensing
Prairie View A&M University, Prairie View, Texas Functionally Graded Interfaces for Directed-Energy-Deposition Repair of Copper-to-Superalloy Propulsion Hardware: An Integrated AI/ML Design-to-Validation Research Capability at Prairie View A&M University
University of New Mexico, Albuquerque POWER-Artemis: Extreme-Environment Batteries and Fuel Cells for Sustained Moon and Mars Operations
Fayetteville State University, North Carolina From Documents to Models: Method-Compliant Generative AI for Bootstrapping Model-Based Systems Engineering in NASA’s Artemis Enterprise (Doc2Model)
NASA’s Office of STEM Engagement fosters an ecosystem across education, industry, and government to cultivate a well‑prepared talent pool, while the agency’s Research and Technology Mission Directorate develops the transformative space technologies that enable future NASA missions and ensure U.S. leadership in aerospace. Together, they accelerate mission readiness by aligning cutting edge technological innovation with the workforce needed to carry it forward.
Registration is open for the 2026 NASA Space Apps Challenge, a two-day global event on Saturday, Nov. 14 and Sunday, Nov. 15, where teams work to create solutions inspired by NASA’s most ambitious exploration goals and making use of the agency’s free and open data. The annual challenge, often called a hackathon, is an intensive, collaborative problem-solving experience where participants tackle real-world challenges created by NASA subject matter experts.
This year’s Space Apps Challenge collectively supports three major focus areas: returning humans to the Moon, preparing for missions deeper into the solar system, and expanding understanding of the universe. Participants do not have to be programmers. Students, scientists, engineers, designers, storytellers, technologists, and space enthusiasts of all ages and experience levels can contribute their skills.
“At NASA, science is for everyone, and we’re inviting the next generation to help tackle some of humanity’s most critical challenges in space through the NASA Space Apps Challenge,” said Nicky Fox, associate administrator, Science Mission Directorate, NASA Headquarters in Washington. “Everything in NASA Science is interconnected, and this year, students from around the world can use NASA’s powerful data sets to help us build the ultimate interplanetary survival guide – supporting the science that will enable astronauts to thrive on the Moon and, eventually, Mars, while also inspiring ideas that improve everyday life on Earth and in space for the benefit of all.”
Supporting lunar exploration, Artemis planning
NASA continues to advance plans for a sustained human presence on the Moon through the Artemis program and Moon Base. Several of this year’s Space Apps challenges relate to analytical tools, operational considerations, and human‑system needs relevant to lunar missions. These include work related to surface operations at the Moon’s South Pole, the management of environmental constraints such as sunlight and communications windows, as well as approaches for evaluating the logistical and scientific demands of long‑duration lunar stays. Broader system‑level modeling challenges, such as those that simulate outpost operations or consider astronaut health and safety, mirror the complexity of planning for human activity on the lunar surface.
Strengthening readiness for Mars, deepspace
NASA’s exploration strategy includes continued robotic exploration of the outer solar system and preparing for future human missions to Mars. Several challenges involve operational concepts for Martian surface activities, integrating data from multiple Mars missions, or reflecting the mission‑design trade‑offs required for deep‑space exploration. Others address fundamental concerns for long‑duration travel, such as monitoring physiological and behavioral health indicators, or examining how engineering and scientific choices shape mission execution in environments far from Earth.
Some of these challenges also align with NASA’s broader exploration portfolio, which includes ongoing work on future missions to destinations such as Jupiter’s moon Europa and Saturn’s moon Titan. By simulating mission‑design decisions or evaluating environmental analogs on Earth, certain challenges offer frameworks related to how NASA prepares for complex operational scenarios throughout the solar system.
Enhancing access to astrophysics
NASA’s astrophysics missions contribute to understanding the structure and history of the universe. In 2026, this includes active missions like Spectro-Photometer for the History of the Universe, Epoch of Reionization and Ices Explorer (SPHEREx), which is conducting a full‑sky spectral survey, as well as the continued development and deployment of observatories designed to investigate cosmic evolution and exoplanet, which are planets outside our solar system, populations.
Challenges associated with these efforts focus on improving public access to mission data, designing tools that help visualize changes in the sky over time, and supporting broader engagement with the scientific products derived from these missions.
Broader impact across NASA’s mission landscape
Together, these challenges illustrate how NASA’s open data ecosystem enables gold standard science, by freely offering such a wide breadth of information and research. By engaging with the Space Apps event, the entire nation can interact with the kind of real‑world needs defined by the agency.
Registration is available at the NASA Space Apps Challenge. Participants can join in one of 500+ local events, join a team, and select the challenge that they are most interested in addressing during the November hackathon.
A NASA Dynamic Aviation A200 aircraft will conduct low-flying research flights over farmland near Transit, Texas, from Thursday, Oct. 22, through Monday, Nov. 9. These flights will measure gaseous and particulate emissions from animal feeding operations.
A photo of the Dynamic Aviation A200 aircraft, which will conduct low-flying research flights over farmland near Transit, Texas, to measure emissions in October and November 2026.
Dynamic Aviation
Agricultural emissions represent an important and understudied part of Earth’s land and atmosphere systems. The FarmFlux mission will deploy more than a dozen sensors to measure ozone, methane, ammonia, particulates, and other pollutants rising from crop lands and livestock farms and their interaction with the Earth’s atmosphere. The mission is jointly led by NASA’s Goddard Space Flight Center in Greenbelt, Maryland; Colorado State University; and Boston University.
Additional low-altitude research flights with a NASA P-3 Orion aircraft are scheduled for the March to July 2027 growing season in the Midwest and California’s Central Valley with a focus on cropland.
For more information about the FarmFlux mission, visit:
Power Up: Roll Out Solar Arrays Boost Space Station Power Supply
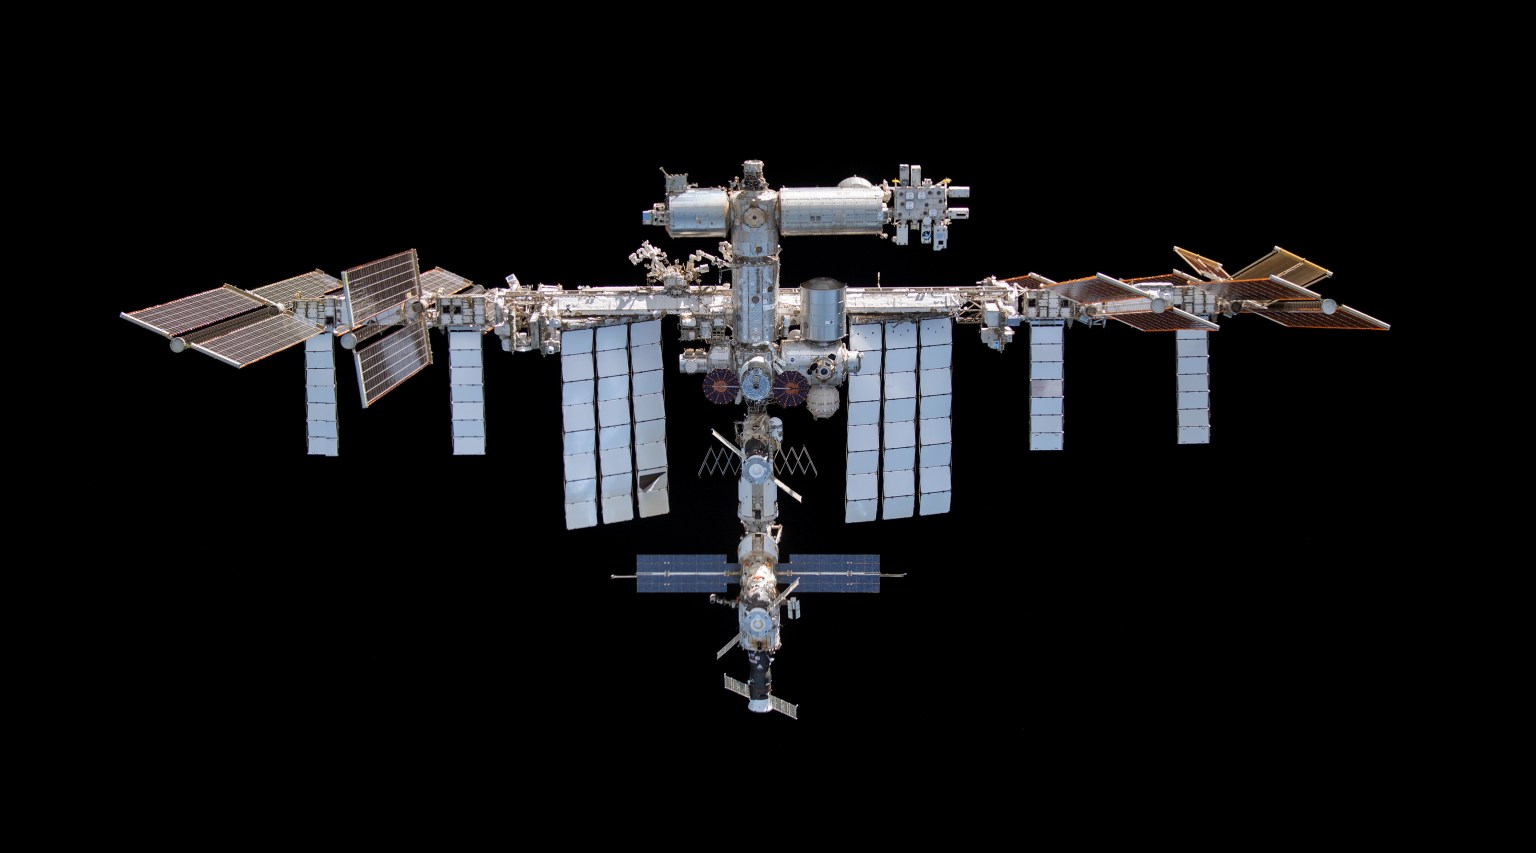
From the International Space Station’s unique position 250 miles above Earth, the Sun is a vital source of energy. Solar power supports the station’s life support systems, daily activities, and hundreds of research investigations that improve life on Earth and prepare humans for deep space exploration. Over the past five years, NASA augmented the station’s power generation and distribution capability with next-generation International Space Station Roll Out Solar Arrays (IROSAs).
An International Space Station Roll Out Solar Array deploys in 2022.
NASA
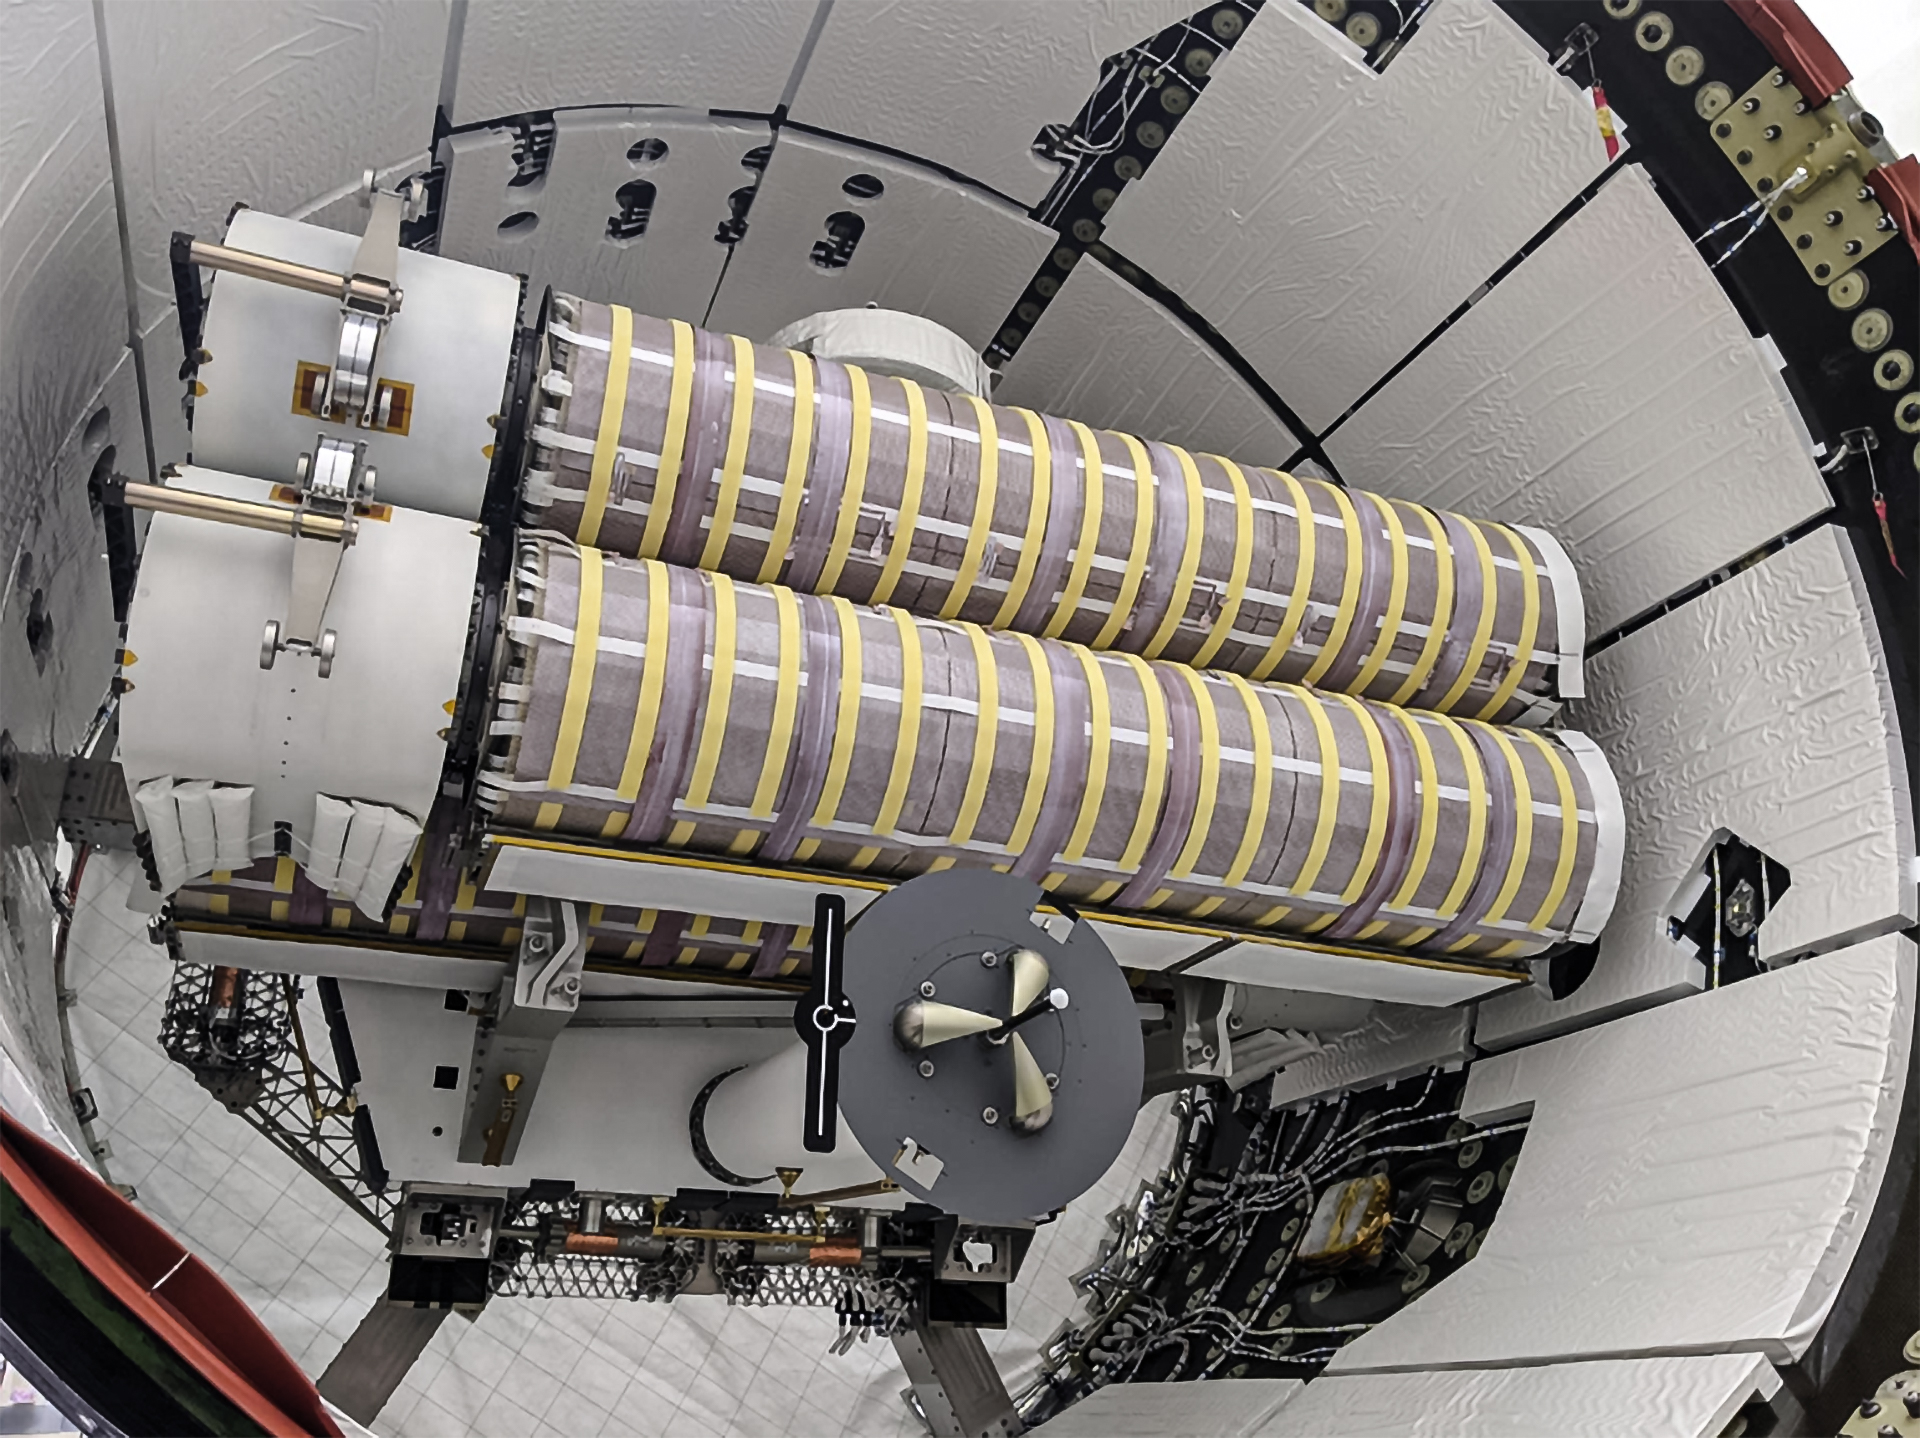
In 2017, a technology demonstration conducted aboard the space station tested the effectiveness of the arrays. The lightweight, compact design launches as a cylinder and unfurls like a yoga mat after installation. This advanced design reduces mass and volume at launch and uses an autonomous, self-deploying system that minimizes risks during rollout.
Sunlight flares across the International Space Station’s solar arrays.
NASA
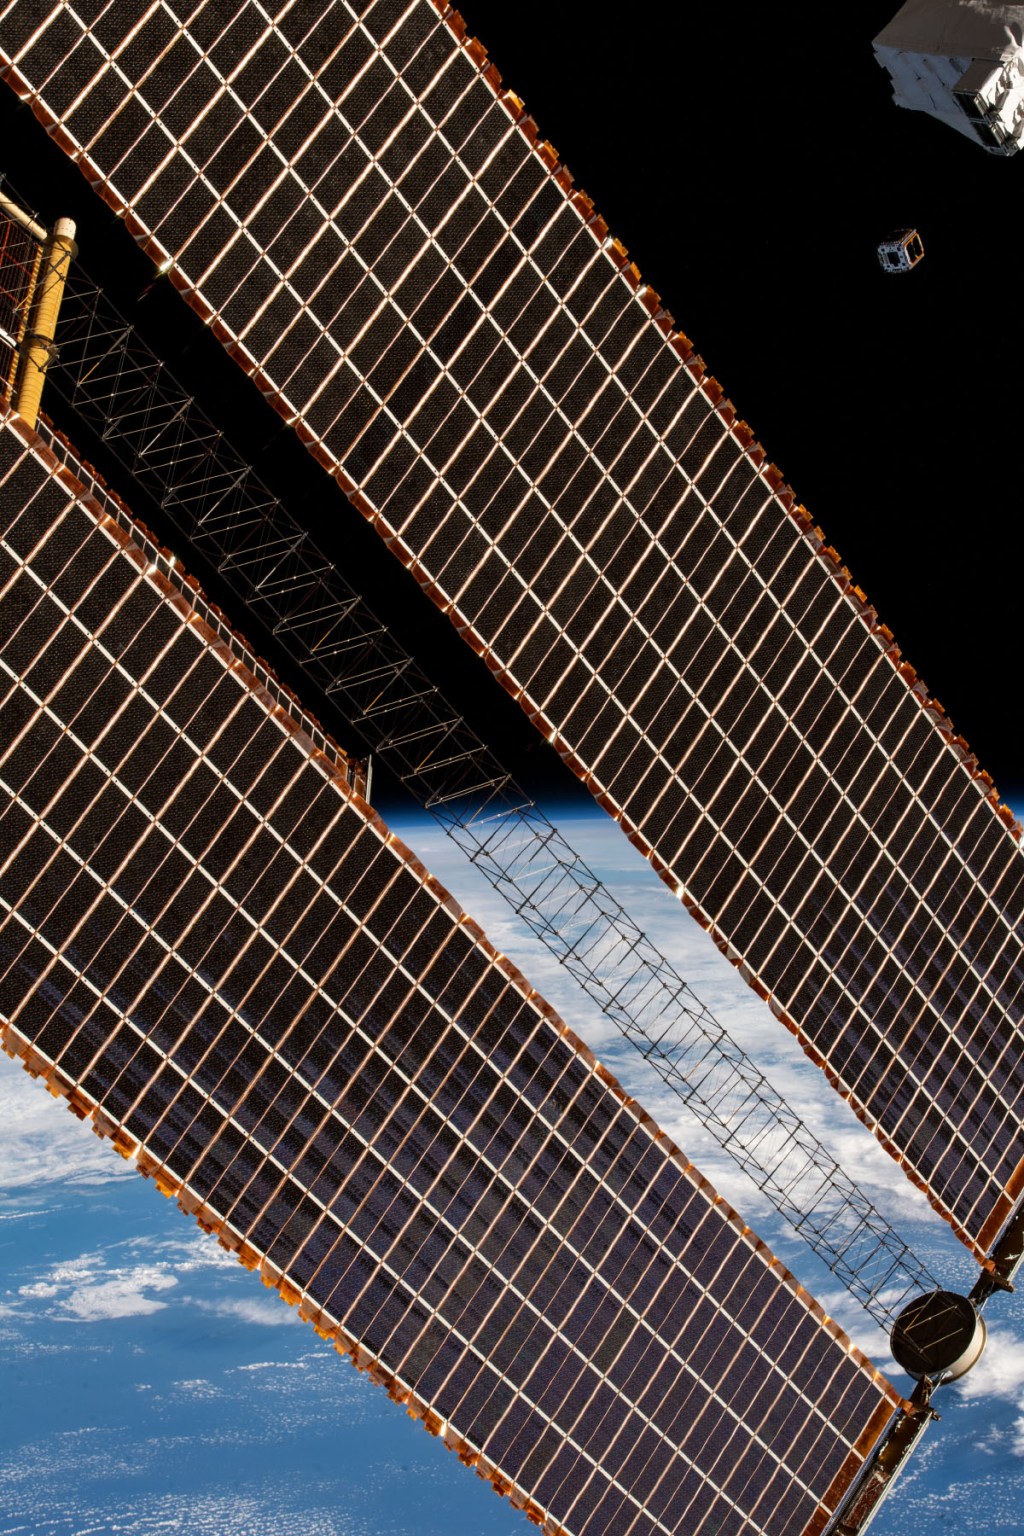
The technology is also scalable to meet mission requirements. The IROSAs are about half the size of the station’s legacy arrays. Despite being smaller, the arrays are capable of producing about 28 kilowatts of additional power.
The first two International Space Station Roll Out Solar Arrays loaded in a SpaceX Dragon’s trunk before delivery to the orbiting laboratory during the company’s 22nd commercial resupply services mission for NASA in 2021.
SpaceX
Six IROSAs were installed outside of the space station between 2021 and 2023. In 2023, power projections prompted a request for another set of IROSAs, which launched in Dragon spacecraft’s trunk during the SpaceX 35th commercial resupply services mission to space station for NASA. Together, the eight IROSAs will increase power by more than 160kW for research and operations.
NASA astronauts perform a spacewalk to install an International Space Station Roll Out Solar Array with the assistance of the Canadarm2 robotic arm in 2022.
NASA
With the full upgrade in place, the space station’s revitalized power system not only supports NASA’s legacy in low Earth orbit but also helps advance technology that will extend the agency’s reach into the solar system. From planetary defense demonstrations, like the Double Asteroid Redirection Test, to future human exploration efforts, the space station is an essential testbed for the technologies needed for expeditions beyond Earth’s orbit.
This visualization compares three ocean data products, sea surface temperature anomaly, apparent visible wavelength, and sea surface height anomaly, over the same months in 2025 and 2026. Signals of El Niño in each map are highlighted with pop-up labels.
Credits: NASA’s Scientific Visualization Studio
A phenomenon rarer than a solar eclipse and more powerful than any single storm system is unfolding this fall, and NASA is tracking it closely.
El Niño is a natural climate pattern that emerges roughly every two to seven years marked by warmer-than-normal water temperatures in parts of the equatorial Pacific. NASA scientists are keeping watch as it flips trade winds, redistributes ocean heat, scrambles rain patterns, and raises sea surface height across parts of the Pacific.
As of October, the National Oceanic and Atmospheric Administration (NOAA) has said that there’s an 83% chance that the strongest El Niño since 1950 is currently unfolding. People around the world, including farmers, firefighters, and coastal communities, are already experiencing the effects in different ways.
Follow along with these maps as NASA tracks El Niño from its epicenter in the equatorial Pacific Ocean.
Sea surface height in flux
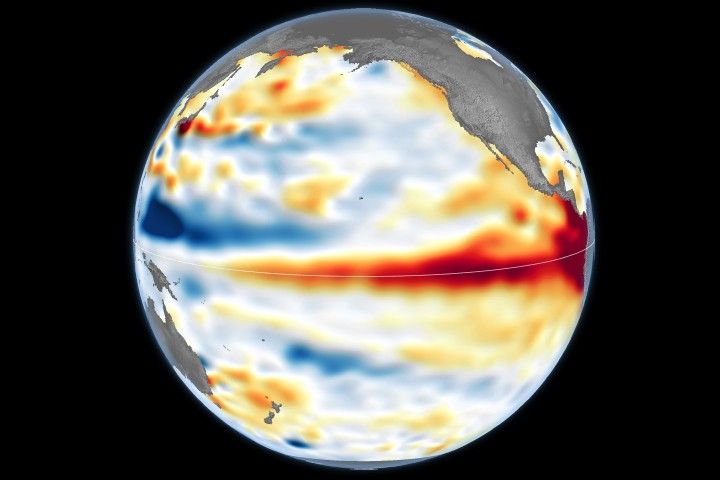
Lower-than-normal sea level conditions appear blue, and higher areas are orange and red in this map, which compares the ocean in 2025 (a weak La Niña year) and 2026. The map was created using altimetry data from the Sentinel-6 satellites, which measure water height for the entire ocean every 10 days, down to fractions of an inch.
Credit: NASA’s Scientific Visualization Studio
One of the first clues appeared in satellite imagery in January 2026, when a swell of warm water called a Kelvin wave was spotted near Micronesia in the western Pacific. Kelvin waves are slow-moving pulses of water thousands of miles long. Like underwater freeways, they transfer heat from west to east across the Pacific. The warm water heats the air directly above it, making it rise. The change in air pressures weakens or even reverses the trade winds that typically blow in the opposing direction, from the Americas toward Asia, causing sea levels in the eastern Pacific to rise further, and waters to warm even more. This chain reaction signifies the start of an El Niño.
The map above shows that by early April, those Kelvin waves had reached the eastern Pacific, and sea surface temperatures had begun to warm. Warm water expands in volume, elevating local sea levels in some areas by as much as 1 to 1.3 feet (30 to 40 centimeters). The higher-than-normal water can be seen sloshing toward South America then moving up the coast to California. Sea levels that are six to eight inches (15 to 20 centimeters) lower than normal are visible around Indonesia and northern Australia.
“Kelvin waves are like the heartbeat of El Niño,” said Josh Willis, project scientist for sea level missions at NASA’s Jet Propulsion Laboratory in Southern California. “And our sea level satellites let us peer into the ocean and watch every beat.”
Scientists have used satellite altimetry to track the height of the ocean with ultraprecision since 1993. That unbroken data record continues today with the Sentinel-6 satellites. State-of-the-art radar altimeters aboard these satellites survey millions of square miles of ocean in a single day, complementing NOAA’s fleet of ocean sensors and buoys drifting and diving through the water below.
Warming Pacific waters
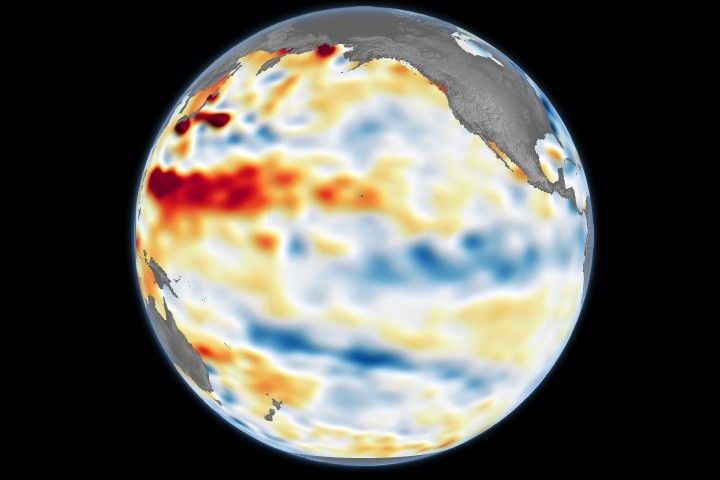
The map above compares sea surface temperatures in 2025 (a weak La Niña year) and 2026. Data are acquired from satellite instruments, buoys, and ship sensors.
Credit: NASA’s Scientific Visualization Studio
Warmer-than-normal seawater is one of the best-known indicators of El Niño. Already, sea surface temperatures in the eastern Pacific are about 3 degrees Fahrenheit (1.7 degrees Celsius) warmer than the long-term average and could jump another fraction of a degree in the coming months, Willis said.
Satellites carrying microwave and infrared radiometers can see through and around clouds to measure heat energy at the sea surface. Satellites in 2026 mapped the band of warmer-than-normal water as it expanded throughout the spring. The band, seen in dark red, stretches for millions of square miles from the heart of the Pacific to the coast of South America. Ocean temperatures can influence weather patterns around the world. Air above the water’s surface carries heat and moisture into the atmosphere, seeding rainstorms and rearranging weather patterns across the globe.
Ocean gets bluer
The map above compares Apparent Visible Wavelength from 2025 (a weak La Niña year) and 2026. Apparent Visible Wavelength is a data product from NASA’s PACE satellite utilizing ocean color data from the Ocean Color Instrument.
Credit: NASA’s Scientific Visualization Studio
El Niño’s warm waters also change the color of the ocean. A NASA satellite is tracking these subtle shifts in hues, as equatorial Pacific waters have become measurably more blue over the last several months.
“Some people think of water as being just blue, but it’s amazing the multitude of colors the ocean can be,” said Matthew Kehrli, a lead research scientist for the PACE (Plankton, Aerosol, Cloud, ocean Ecosystem) satellite team at NASA’s Goddard Space Flight Center in Greenbelt, Maryland.
This spectrum is in part thanks to microscopic plants called phytoplankton, which form the basis of the marine food web. There are thousands of different species of phytoplankton, which come in shades like teal, brown, or green. This year, in areas of the Pacific Ocean along the equator that are typically lush with phytoplankton and greener as a result, these hues are waning.
This is an expected effect of El Niño. Phytoplankton thrive in cool, nutrient-rich waters, but during an El Niño, the weakening trade winds reduce the upwelling of nutrient-rich deep water to the ocean surface. With limited food supply, phytoplankton abundance drops. This decline can trigger cascading effects across the marine food web, forcing other marine life to relocate to new feeding grounds.
This year’s El Niño is the first since PACE launched in 2024, providing new views of the phenomenon. The Ocean Color Instrument aboard PACE observes the ocean in hyperspectral color — across several hundred different wavelengths of visible, near-infrared, and ultraviolet light — monitoring phytoplankton and other ocean-color changes in near-real time. With PACE data, researchers calculate the average color of the ocean, simplifying spectra of light into a single number, known as apparent visible wavelength.
The 2026 map above shows the green area along the equator in the western Pacific Ocean shrink as a bluer shade fills in, indicating fewer phytoplankton. In contrast, the map from 2025 shows how the green-hued section stays steady over time.
“You have expectations of what you would think would happen,” Kehrli said. “But to visually see the results with the data products that you’re working with in real time is gratifying.”
NASA scientists will continue to monitor the signs and impacts of this El Niño with its fleet of Earth-observing satellites.
“El Niño touches almost all of us in some way every time it occurs,” Willis said. “While many have seen what it can do, we look to the ocean to understand why.”