Thomas Heyward Jr. and Thomas Lynch Jr. represented South Carolina at the Second Continental Congress and signed the Declaration of Independence on July 4, 1776.
Source: www.war.gov
Thomas Heyward Jr. and Thomas Lynch Jr. represented South Carolina at the Second Continental Congress and signed the Declaration of Independence on July 4, 1776.
Source: www.war.gov
In a prime demonstration of joint force agility and resource optimization, the Navy and Army partnered to rapidly repurpose divested MQ-8C Fire Scout unmanned helicopters, transforming excess inventory into dynamic test assets.
Source: www.war.gov
At Fort Campbell, Kentucky, the Screaming Eagles Combatives Team and the 3rd Brigade Combat Team’s fight night events do more than teach soldiers how to fight. They’re building camaraderie, developing confidence and giving soldiers a reason to stay in the Army.
Source: www.war.gov
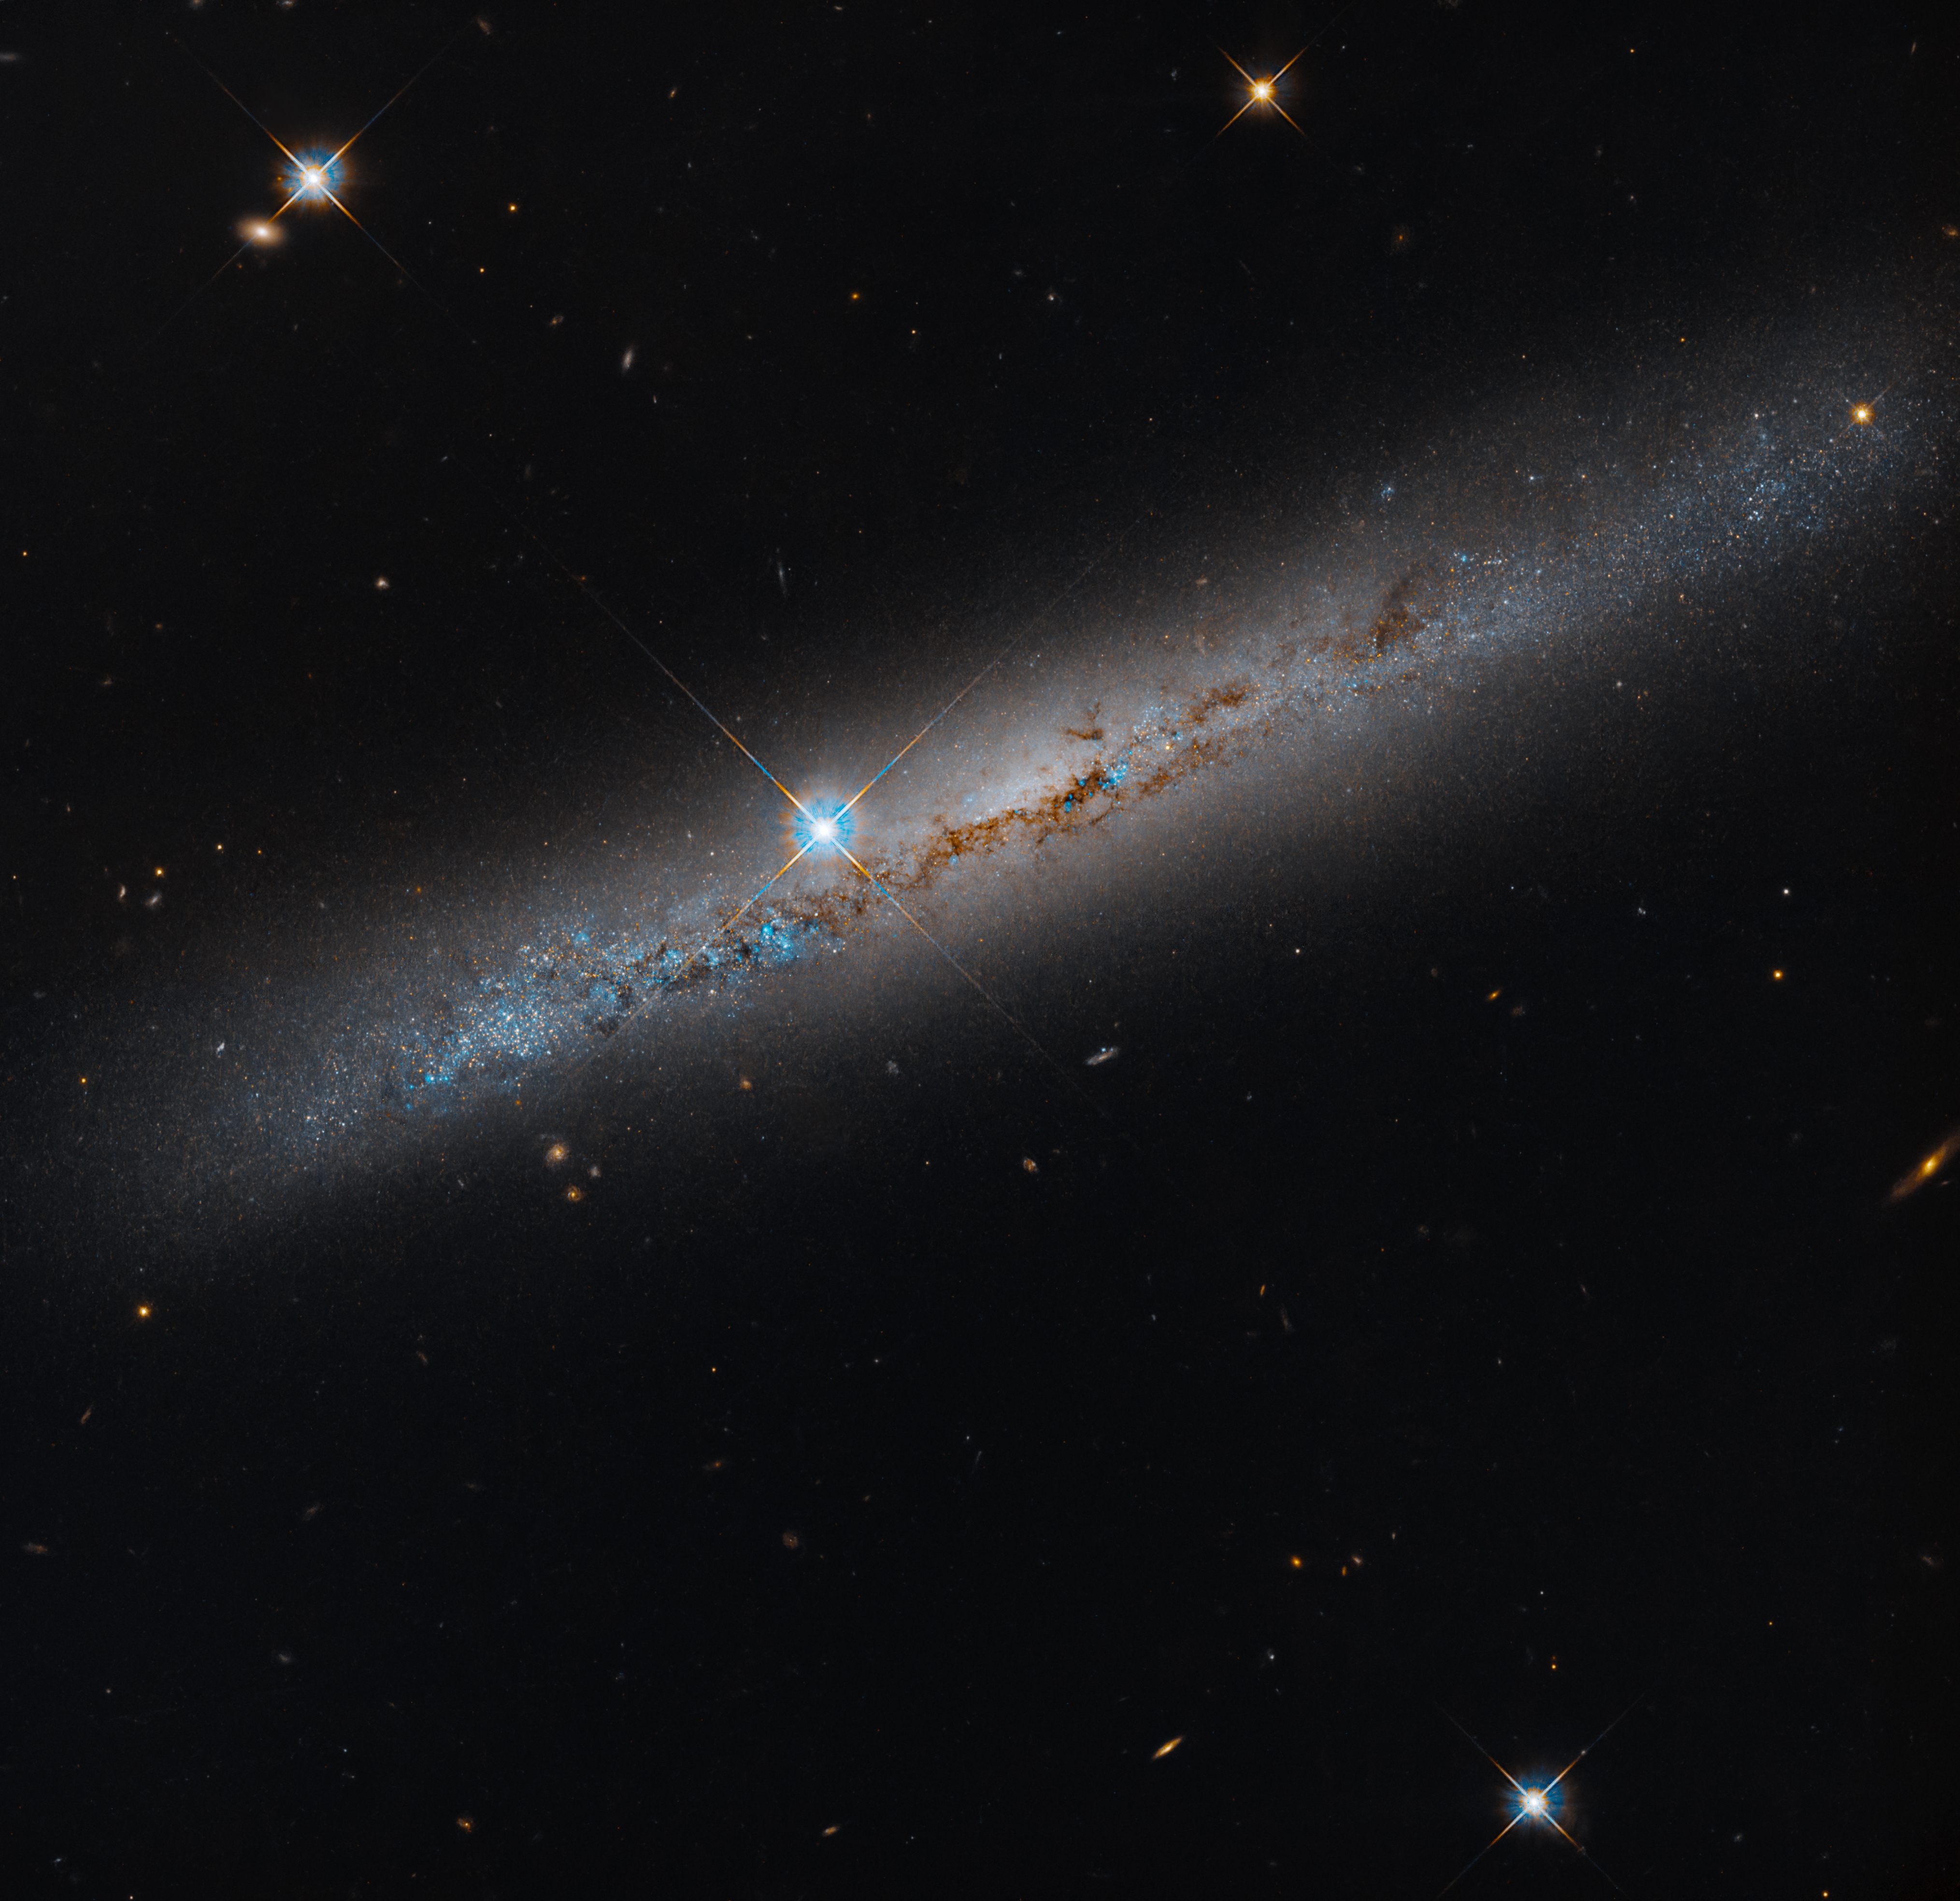
This NASA Hubble Space Telescope image released on Oct. 16, 2026, features the edge-on, intermediate spiral galaxy NGC 1827, located roughly 37 million light-years away in the constellation Columba, the Dove. Hubble captured the image as part of a survey looking at 260 satellite galaxies around 22 Milky Way-like host galaxies within a radius of about 32 million light-years from Earth. Low-mass galaxies like the ones in this Hubble observing program provide a way to test the predictions of cosmological models on small scales, which struggle to match observations.
Image credit: NASA, ESA, Michael Jones (California Institute of Technology); Image Processing: Gladys Kober (NASA/Catholic University of America)
Source: www.nasa.gov
Members of the media are invited to join NASA at the 2026 von Braun Space Exploration Symposium from Monday, Oct. 26, to Wednesday, Oct. 28, at the University of Alabama in Huntsville.
This year’s symposium is focused on humanity’s return to the Moon, sustainable lunar infrastructure, advanced space propulsion, and the evolving space workforce.
Panels include discussions on Artemis II and III, space propulsion flash talks, building utilities and infrastructure for sustainable lunar operations, Moon base supply chain resilience, space nuclear technology, navigating the new NASA workforce, and engineering the future, featuring keynotes and awards presentations.
NASA speakers include:
To request an interview with NASA speakers during the event, media must contact Lance D. Davis, [email protected], and Joel Wallace, [email protected]. Media interested in participating in-person or online must contact the American Astronomical Society to register.
Organized by the American Astronautical Society in collaboration with NASA’s Marshall Space Flight Center in Huntsville, Alabama, the annual event gathers leaders from government, industry, policy, and academia to discuss the current landscape of space exploration and help chart a path forward.
For more information on NASA Marshall, visit:
-end-
Lance D. Davis
Marshall Space Flight Center, Huntsville, Ala.
256-640-9065
[email protected]
Source: www.nasa.gov
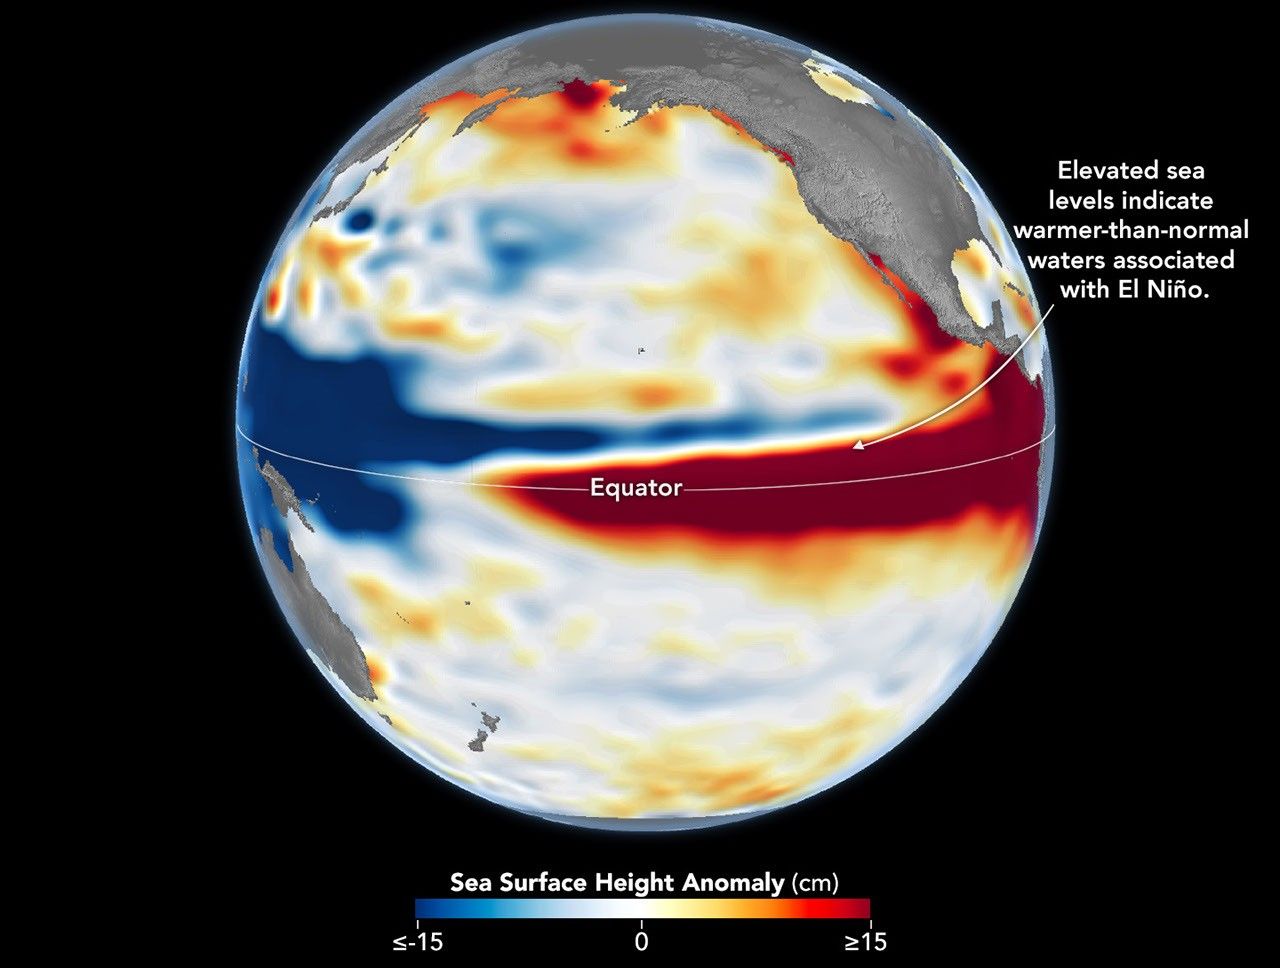
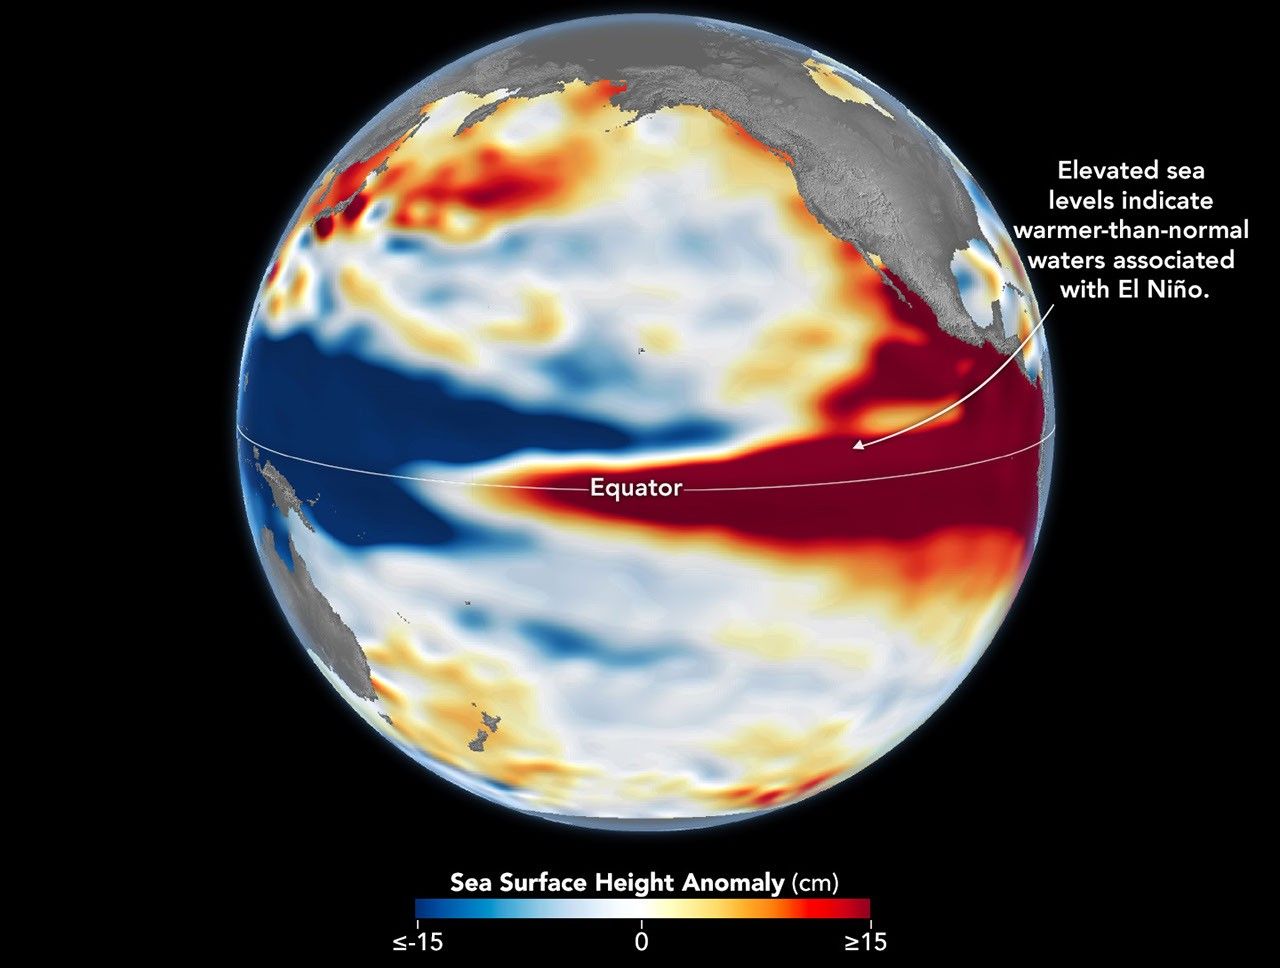


October 13, 1997 – October 12, 2026
El Niño is part of a natural climate pattern that occurs roughly every two to seven years, bringing warmer-than-normal water to parts of the equatorial Pacific. The most recent very strong El Niño events, in 1997-98 and 2015-16, upended weather patterns. Impacts spanned the planet, from fires in Indonesia and the Amazon, to crop failures due to drought in southern Africa, to heavy rain and coastal flooding in Southern California. The current El Niño rivals these past heavyweights.
Every El Niño grows from a feedback loop between the atmosphere and the ocean. Trade winds normally keep warm water piled up in the western Pacific, where it stands higher than in the east. When those winds weaken, that warm water begins to pulse eastward, which further weakens and sometimes reverses the winds, allowing even more warm water to move east. The cycle intensifies as waters continue to warm and pile up in the central and eastern Pacific.
But each El Niño has its own character, shaped by where in the Pacific the warmth builds and how the atmosphere responds. “The search for the ‘typical’ El Niño is very elusive,” said Josh Willis, project scientist for sea level missions at NASA’s Jet Propulsion Laboratory (JPL). “They’re all different in terms of where they land and how their impacts play out.”
Altimetry satellites can track those differences by measuring the height of the sea surface. Because water expands as it warms, higher-than-normal sea levels in the central and eastern equatorial Pacific signal the buildup of heat associated with El Niño. The maps above depict sea surface height anomalies across the Pacific Ocean on October 13, 1997 (left), and on October 12, 2026 (right). Data are from the TOPEX/Poseidon satellite and the Sentinel-6 Michael Freilich satellite, respectively, and were processed by scientists at JPL.
Shades of red indicate where sea levels were higher than average. Normal sea level conditions appear white, and lower areas are blue. Signals related to seasonal cycles and long-term trends have been removed to highlight sea level anomalies associated with El Niño and other short-term natural phenomena.
“What’s unique about altimetry is that we have a 35-year record from nearly identical satellites flying almost the same ground track, with each mission overlapping the next,” Willis said. “That lets us look back in time and compare this El Niño to what happened in 1997. And right now, this one is on track to be even bigger.”
Compared with the 1997-98 event, El Niño in 2026 came on much more suddenly. But as of October, the two events appear similar in character—the tilt of sea level (low in the west and high in the east) and high, warm water extending all the way to South America—so Willis thinks the impacts could be similar as well. In 1997-98, that meant, for instance, lots of rain in California and across the southern tier of the U.S.
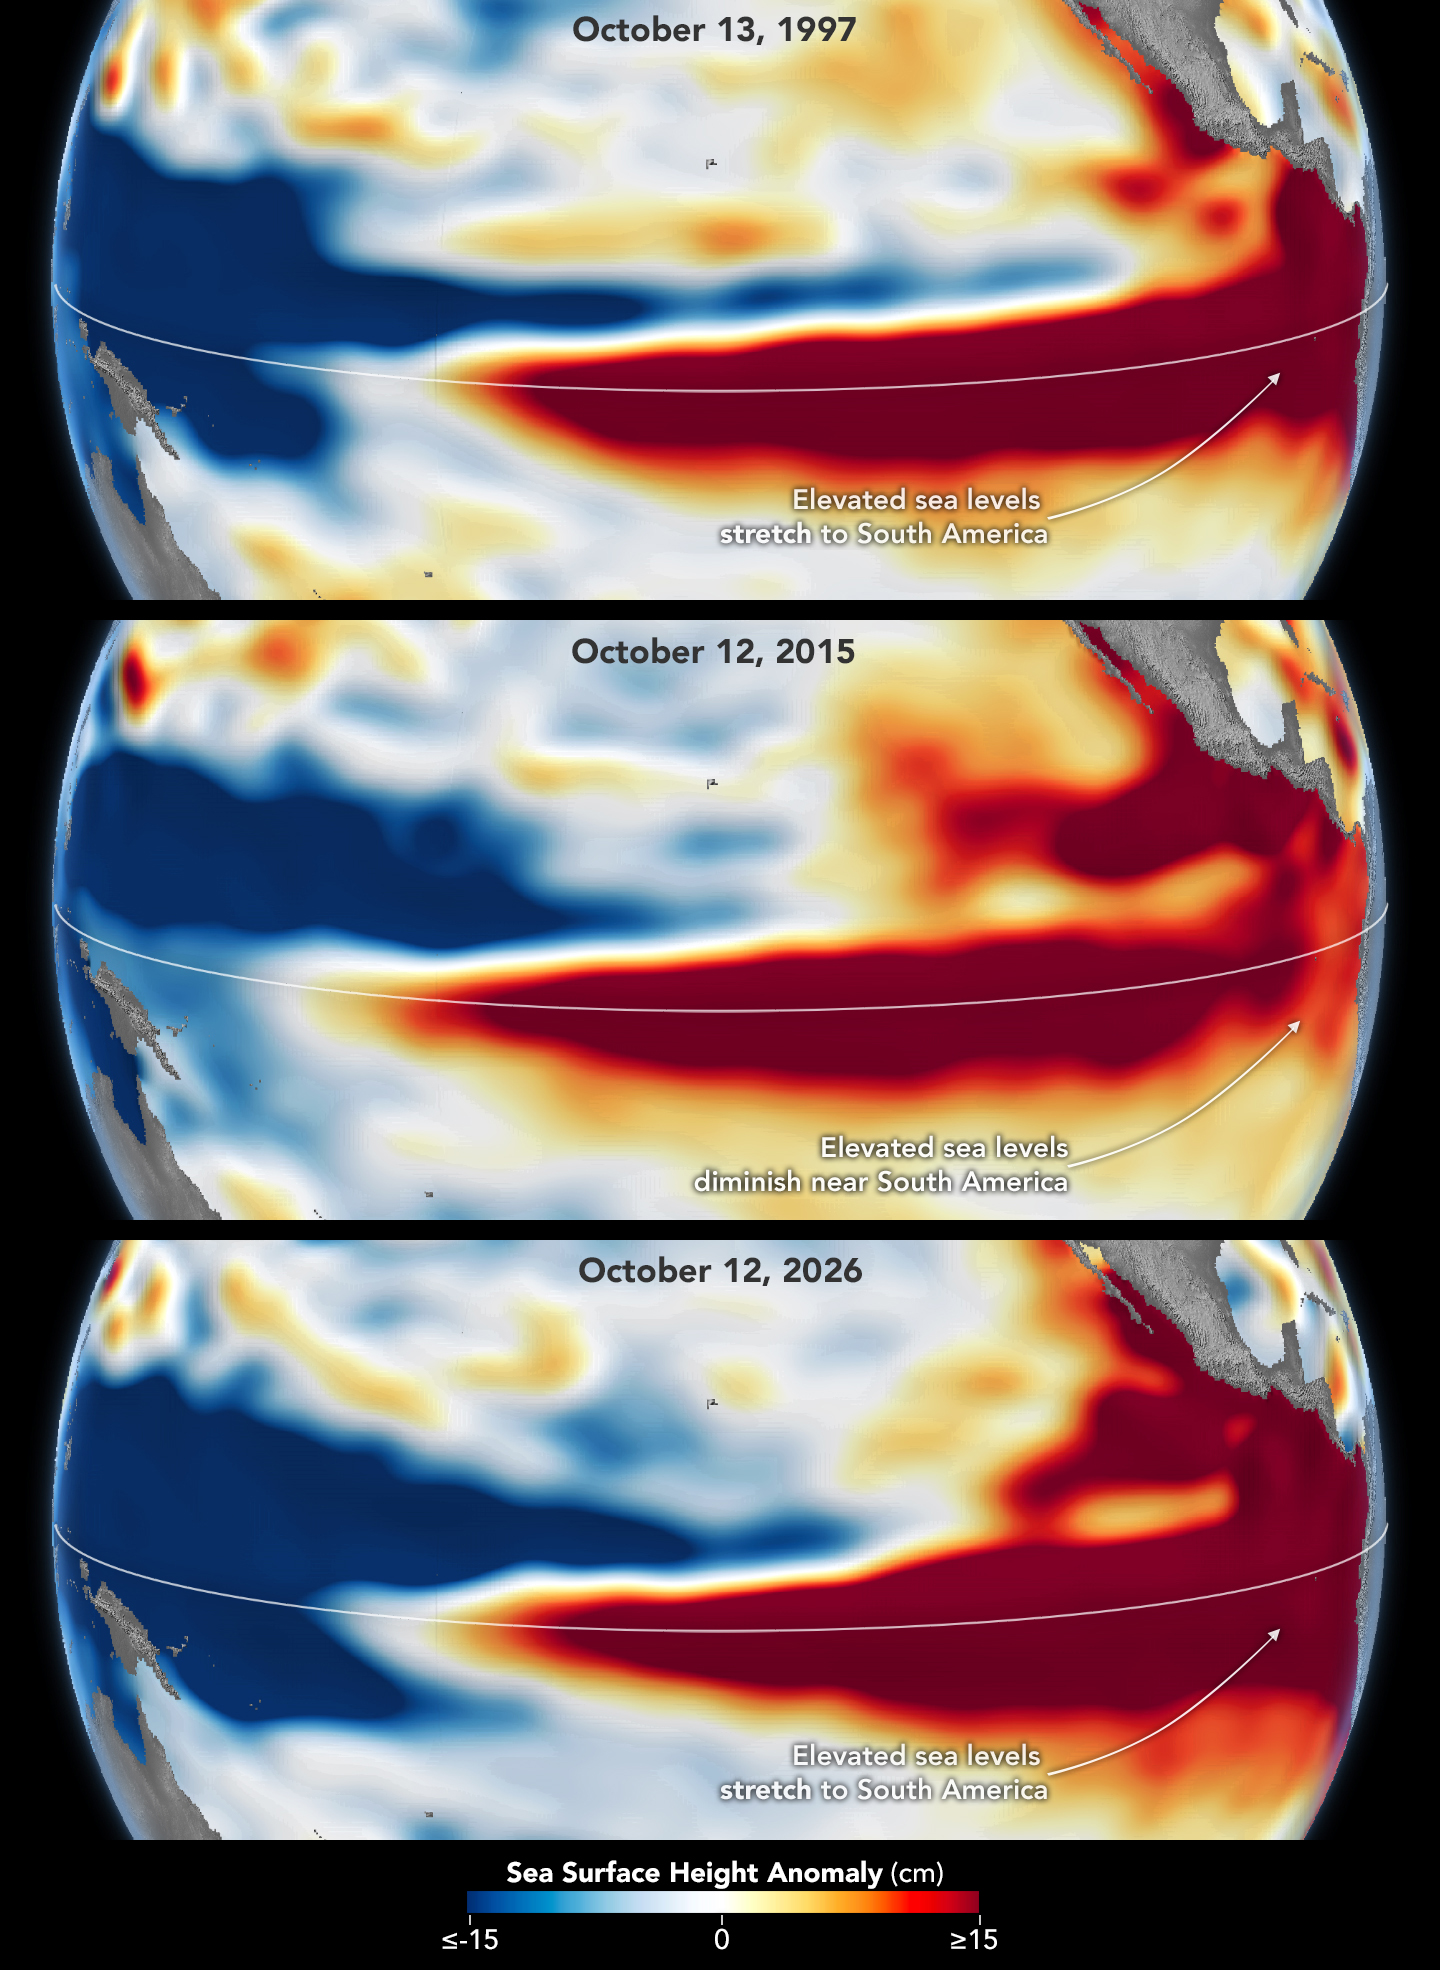
The 2015-16 El Niño was another heavy hitter but differed in its character. Sea surface height anomalies on October 12, 2015, based on altimetry data from the Jason-2 satellite, are shown above in context with maps from around the same time in 1997 and 2026. In 2015, the exceptionally warm, high water along the equator didn’t push up against South America to the extent it did in the other years. Rainfall impacts that winter concentrated more over Central America and the southeastern U.S., with significant flooding in Mexico.
NOAA’s El Niño outlook on October 8, 2026, called for an 83 percent chance of a strong-to-very strong El Niño through the first three months of 2027. But exactly how the impacts will play out in winter 2026-27 and beyond remains to be seen. Willis noted that El Niño’s influence propagates through a chaotic atmosphere, and the signal can get muddled as it extends beyond the tropics. “There’s always a bit of a dice roll here,” Willis said. “Just because this El Niño looks like 1997 doesn’t mean it will be exactly the same—it’s just our best guess at the moment.”
NASA Earth Observatory maps by Lauren Dauphin, using NASA-SSH altimetry data provided by Josh Willis, Severine Fournier, and Kevin Marlis, NASA/JPL-Caltech. Story by Kathryn Hansen.
Stay up-to-date with the latest content from NASA as we explore the universe and discover more about our home planet.
Satellite observations of sea surface height indicated that the 2026 event continued to strengthen in early June.

The ocean’s ebbs and flows reveal dynamic tidal flats and a well-traveled shipping route along the coast of Germany.

Satellite measurements of chlorophyll at the sea surface signal shifts in the ocean’s nutrient supplies in mid-2026.
Source: science.nasa.gov
APOD
Astronomy Picture of the Day
Discover the cosmos! Each day a different image or photograph of our fascinating universe is featured, along with a brief explanation written by a professional astronomer.

Explanation: Looking toward the north from Mullion, New South Wales, Australia, the Andromeda Galaxy never gets more than a few degrees above the horizon. During the southern hemisphere spring, Andromeda is highest in the sky around midnight though. And in this telephoto scene from October 10/11, multiple exposures were used to reveal the spiral galaxy in tantalizing detail as it climbed above rolling Australian hills. Also known as M31, the Andromeda Galaxy is one of the brightest objects in the Messier catalog, but is only visible to the unaided eye as a small, faint, fuzzy patch. Digitally tracked and stacked frames were combined with a foreground shot in the deep astro-image composite to reveal the galaxy’s greater extent in planet Earth’s night. In the springtime night skyscape,the closest large spiral galaxy spans nearly 6 full moons.
Tomorrow’s picture: pixels in space
| Date | October 23, 2026 |
|---|---|
| Credit & Copyright: | Lucy Yunxi Hu |
| Authors & editors: | Jerry Bonnell, Cecilia Chirenti, Robert Nemiroff, Keighley Rockcliffe |
| A service of: |
ASD at NASA / GSFC, NASA Science Activation & Michigan Tech. U. |
Source: science.nasa.gov
3 min read
NASA is helping to foster long-term energy security in Virginia.
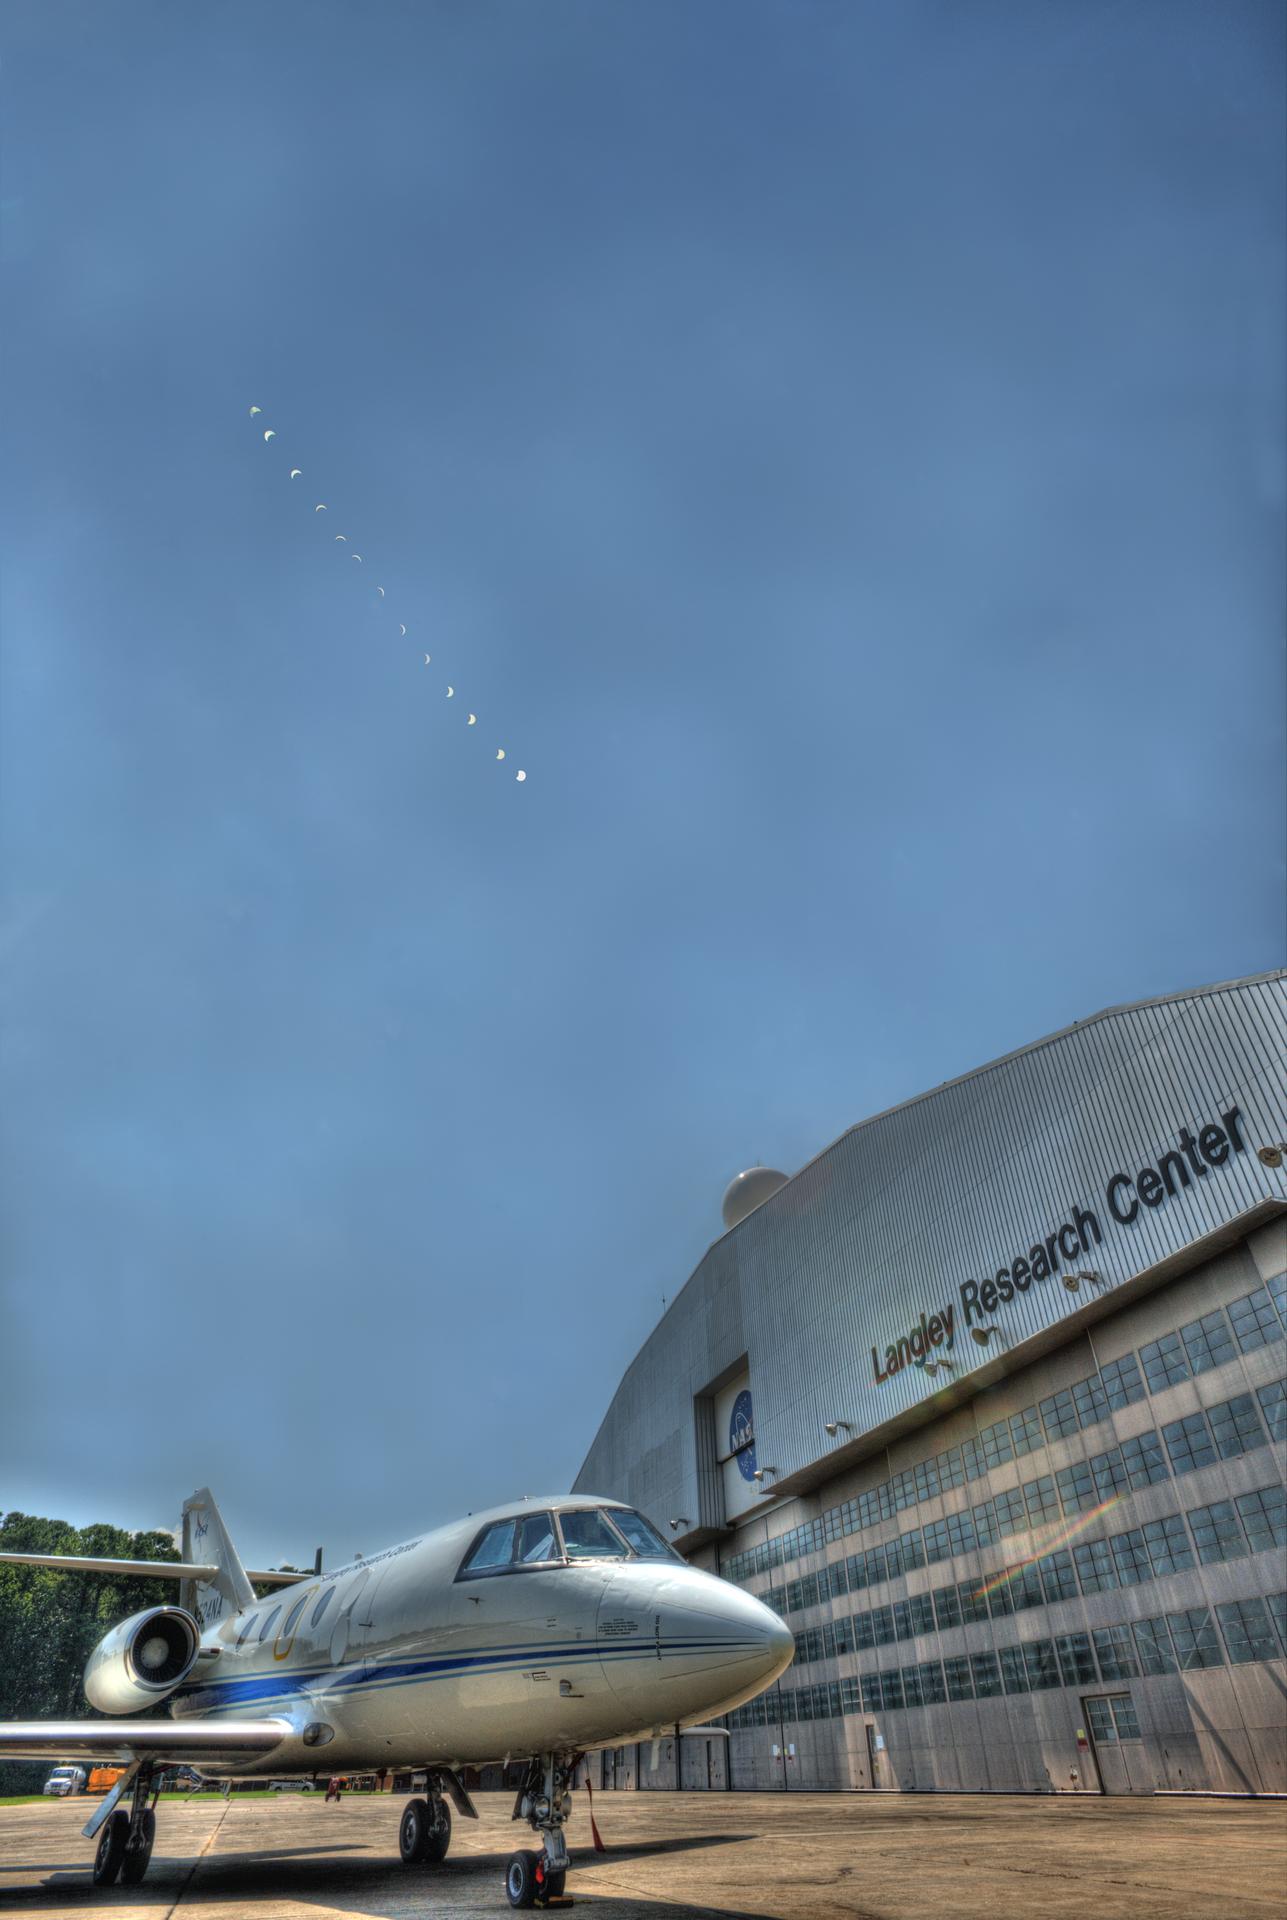
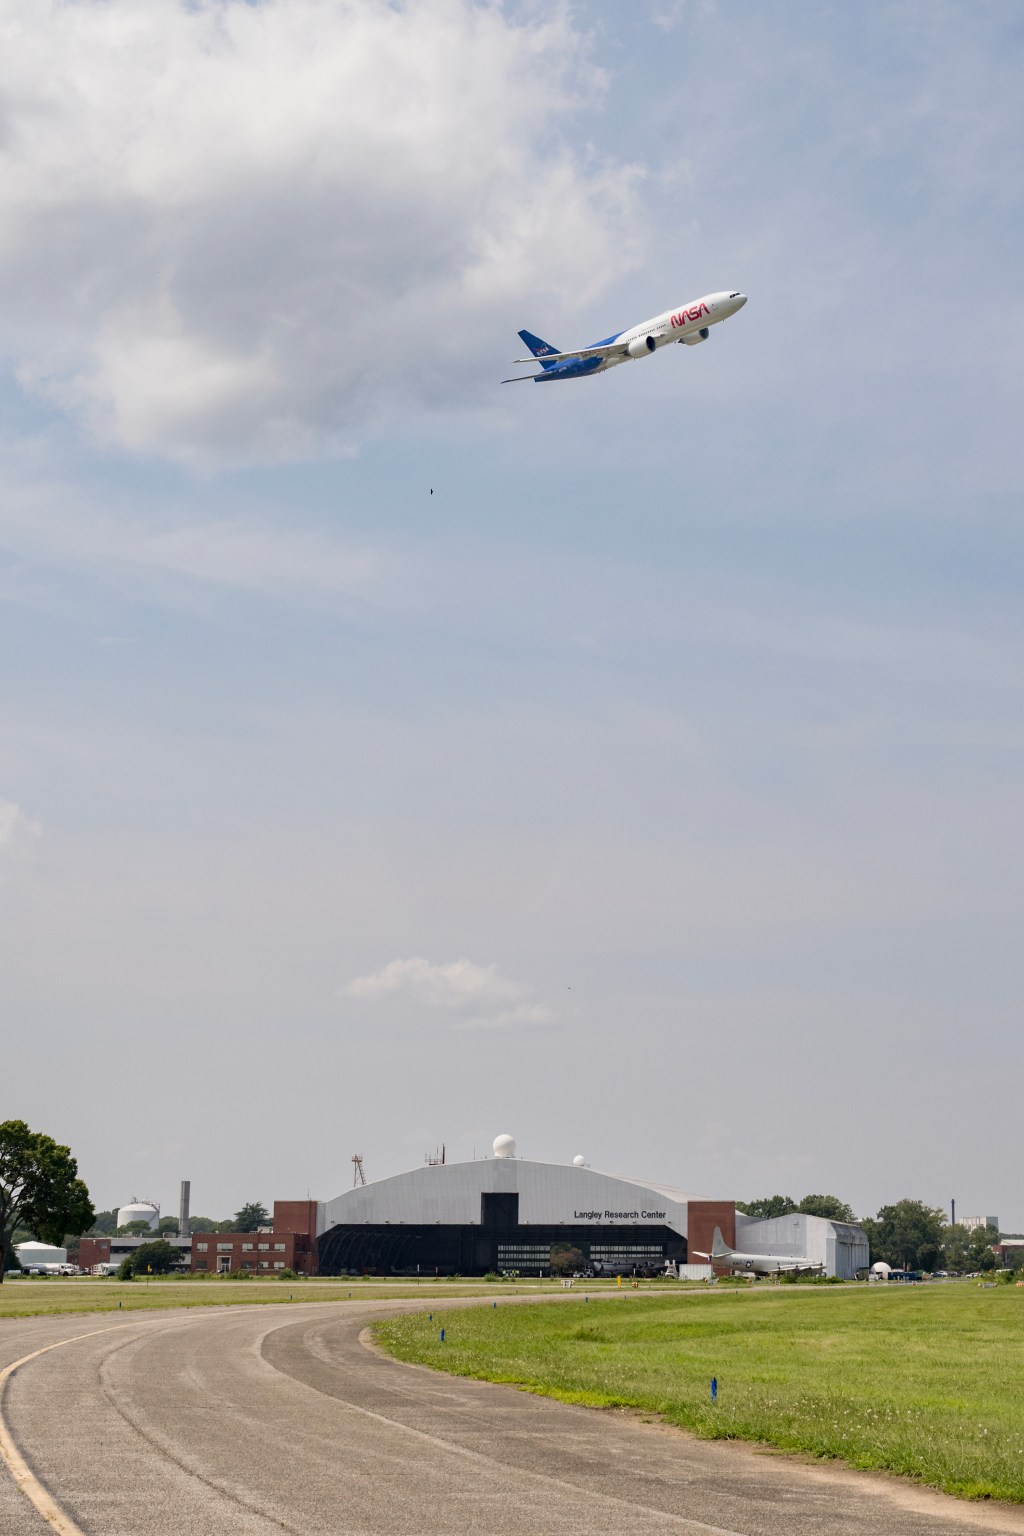
NASA’s Langley Research Center in Hampton, Virginia, is partnering with the Virginia Department of Energy to support informed decisions for effective energy generation, delivery and use by providing solar, meteorological, and future weather risk datasets for energy system modeling and planning purposes.
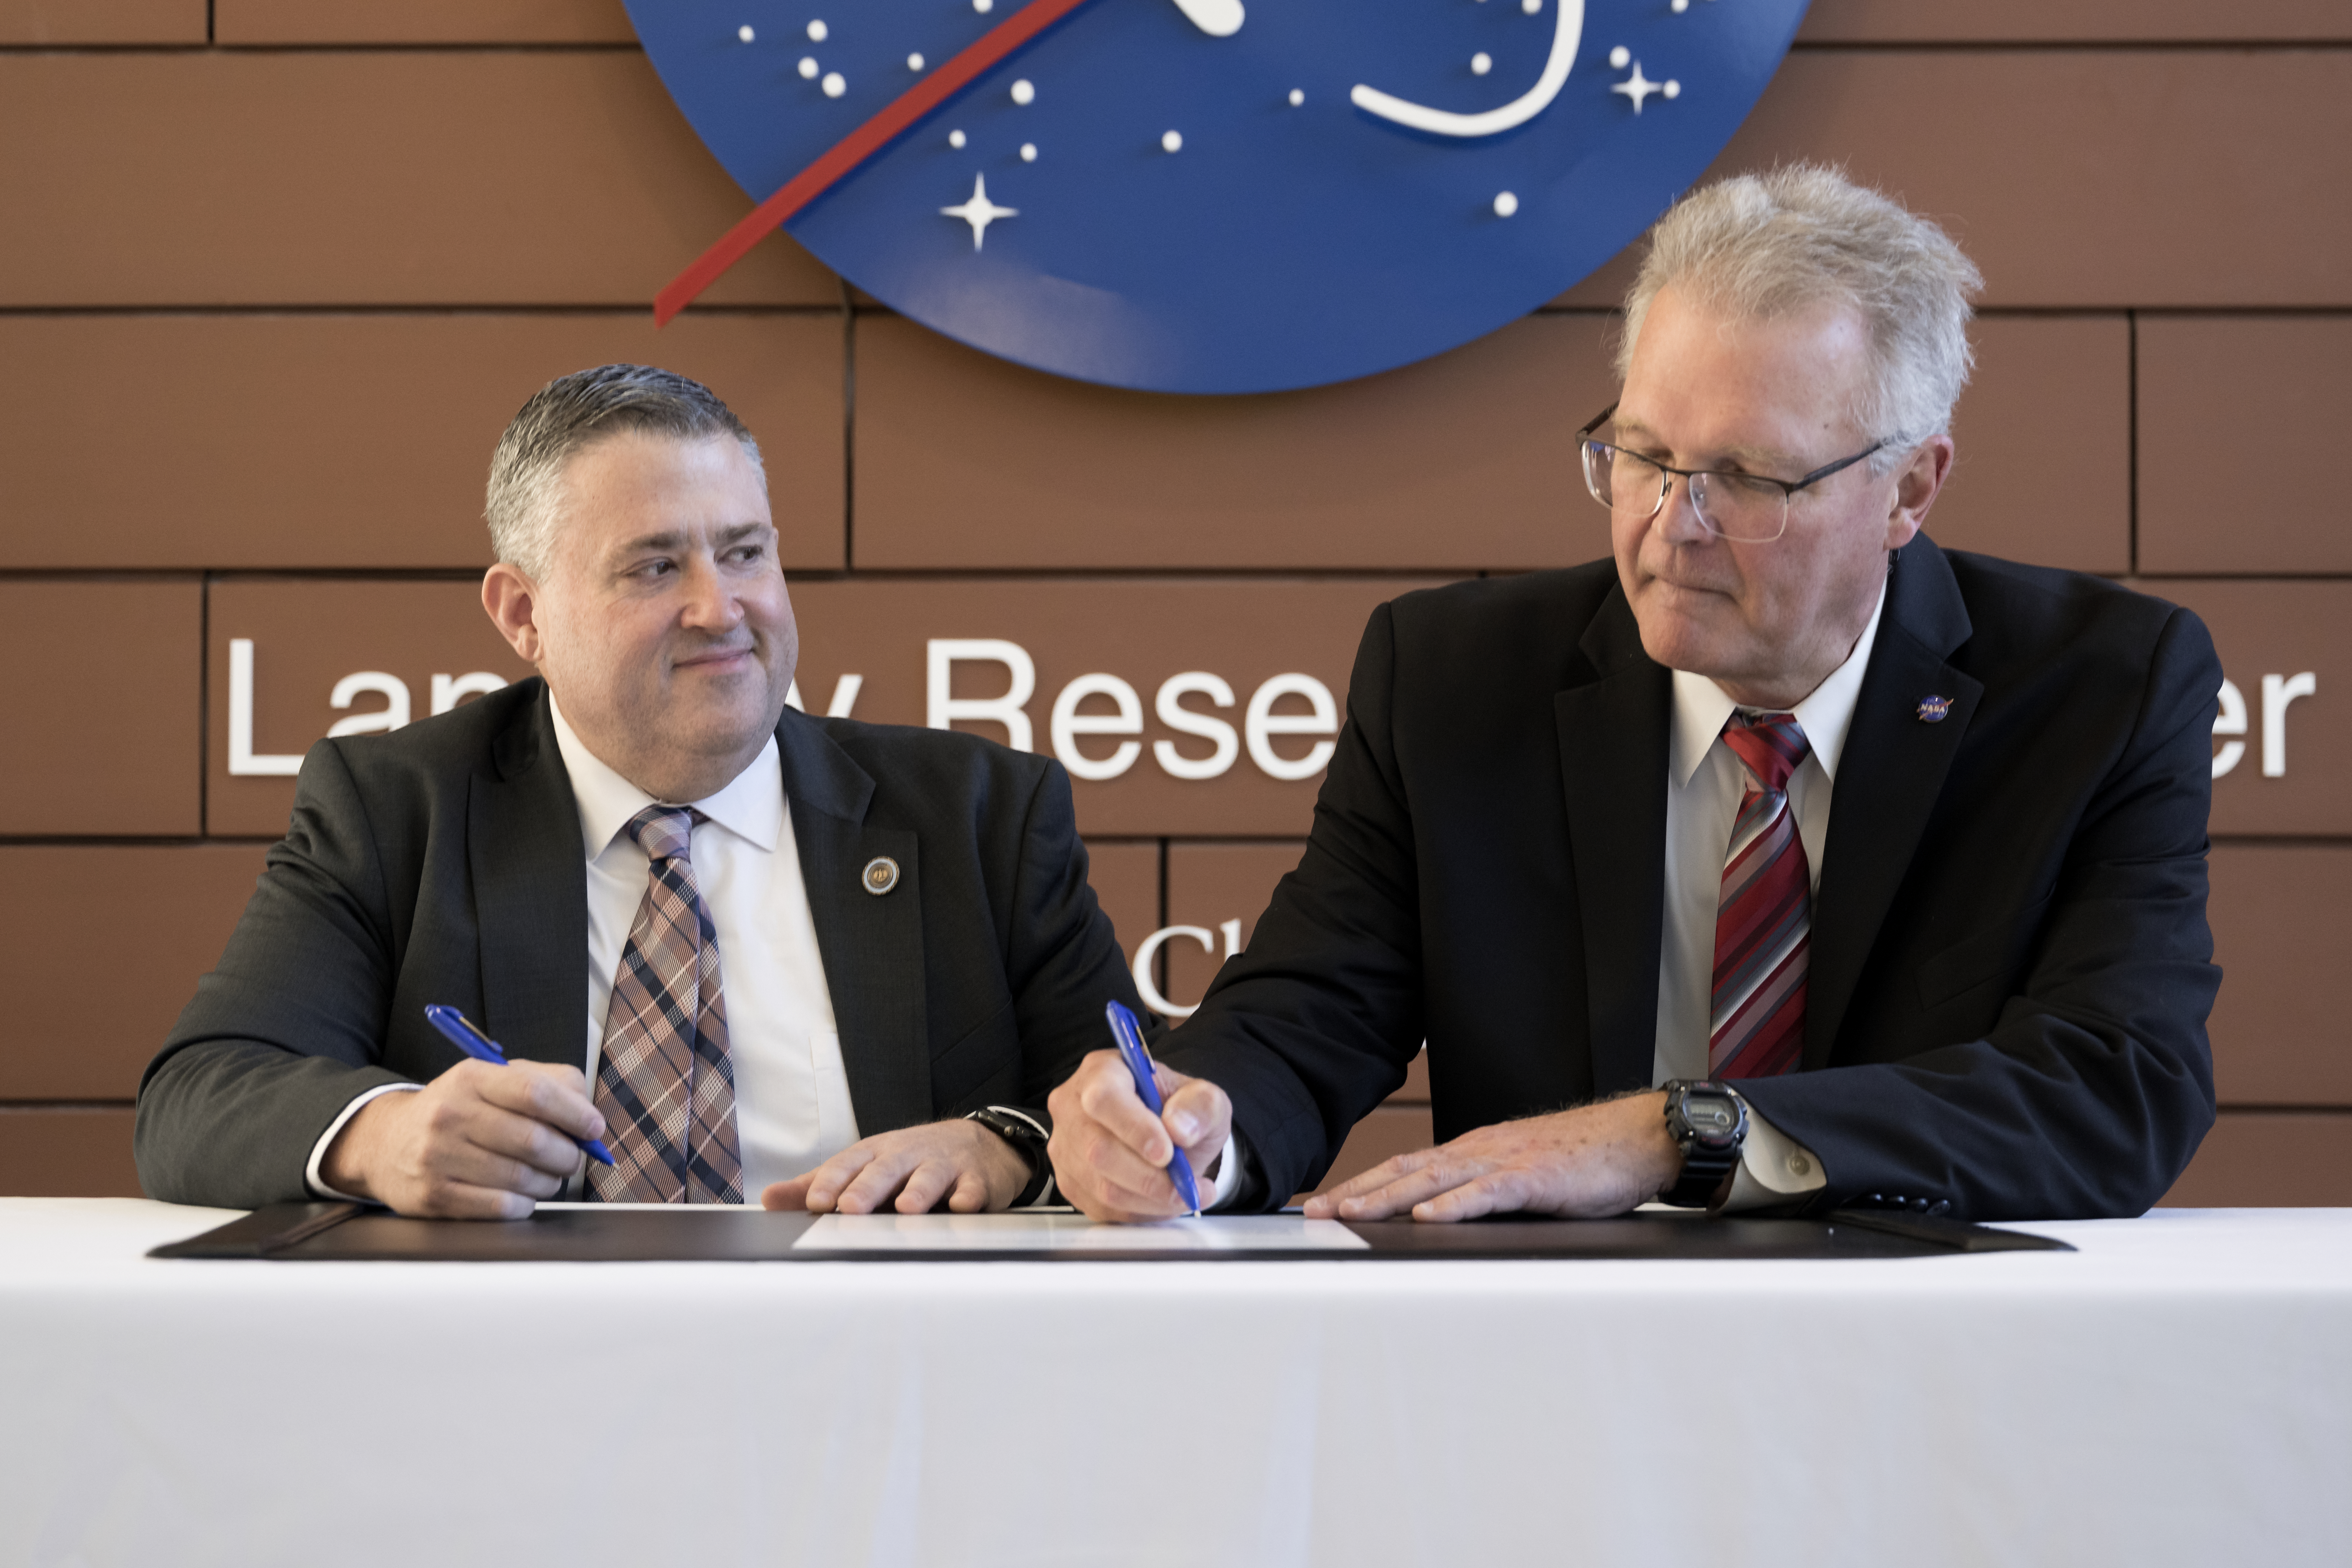
Under a new Space Act Agreement announced during a ceremony Friday, the partnership will use NASA expertise in atmospheric sciences to assist Virginia Energy in support of resiliency studies, resource analysis, and long-term energy planning.
“NASA Langley relishes the opportunity to put our unique science data into the hands of those who want to improve people’s lives,” said NASA Langley Deputy Director Allen Kilgore. “This collaboration with Virginia Energy will benefit the citizens of Virginia and provide stronger energy security for the Commonwealth.”
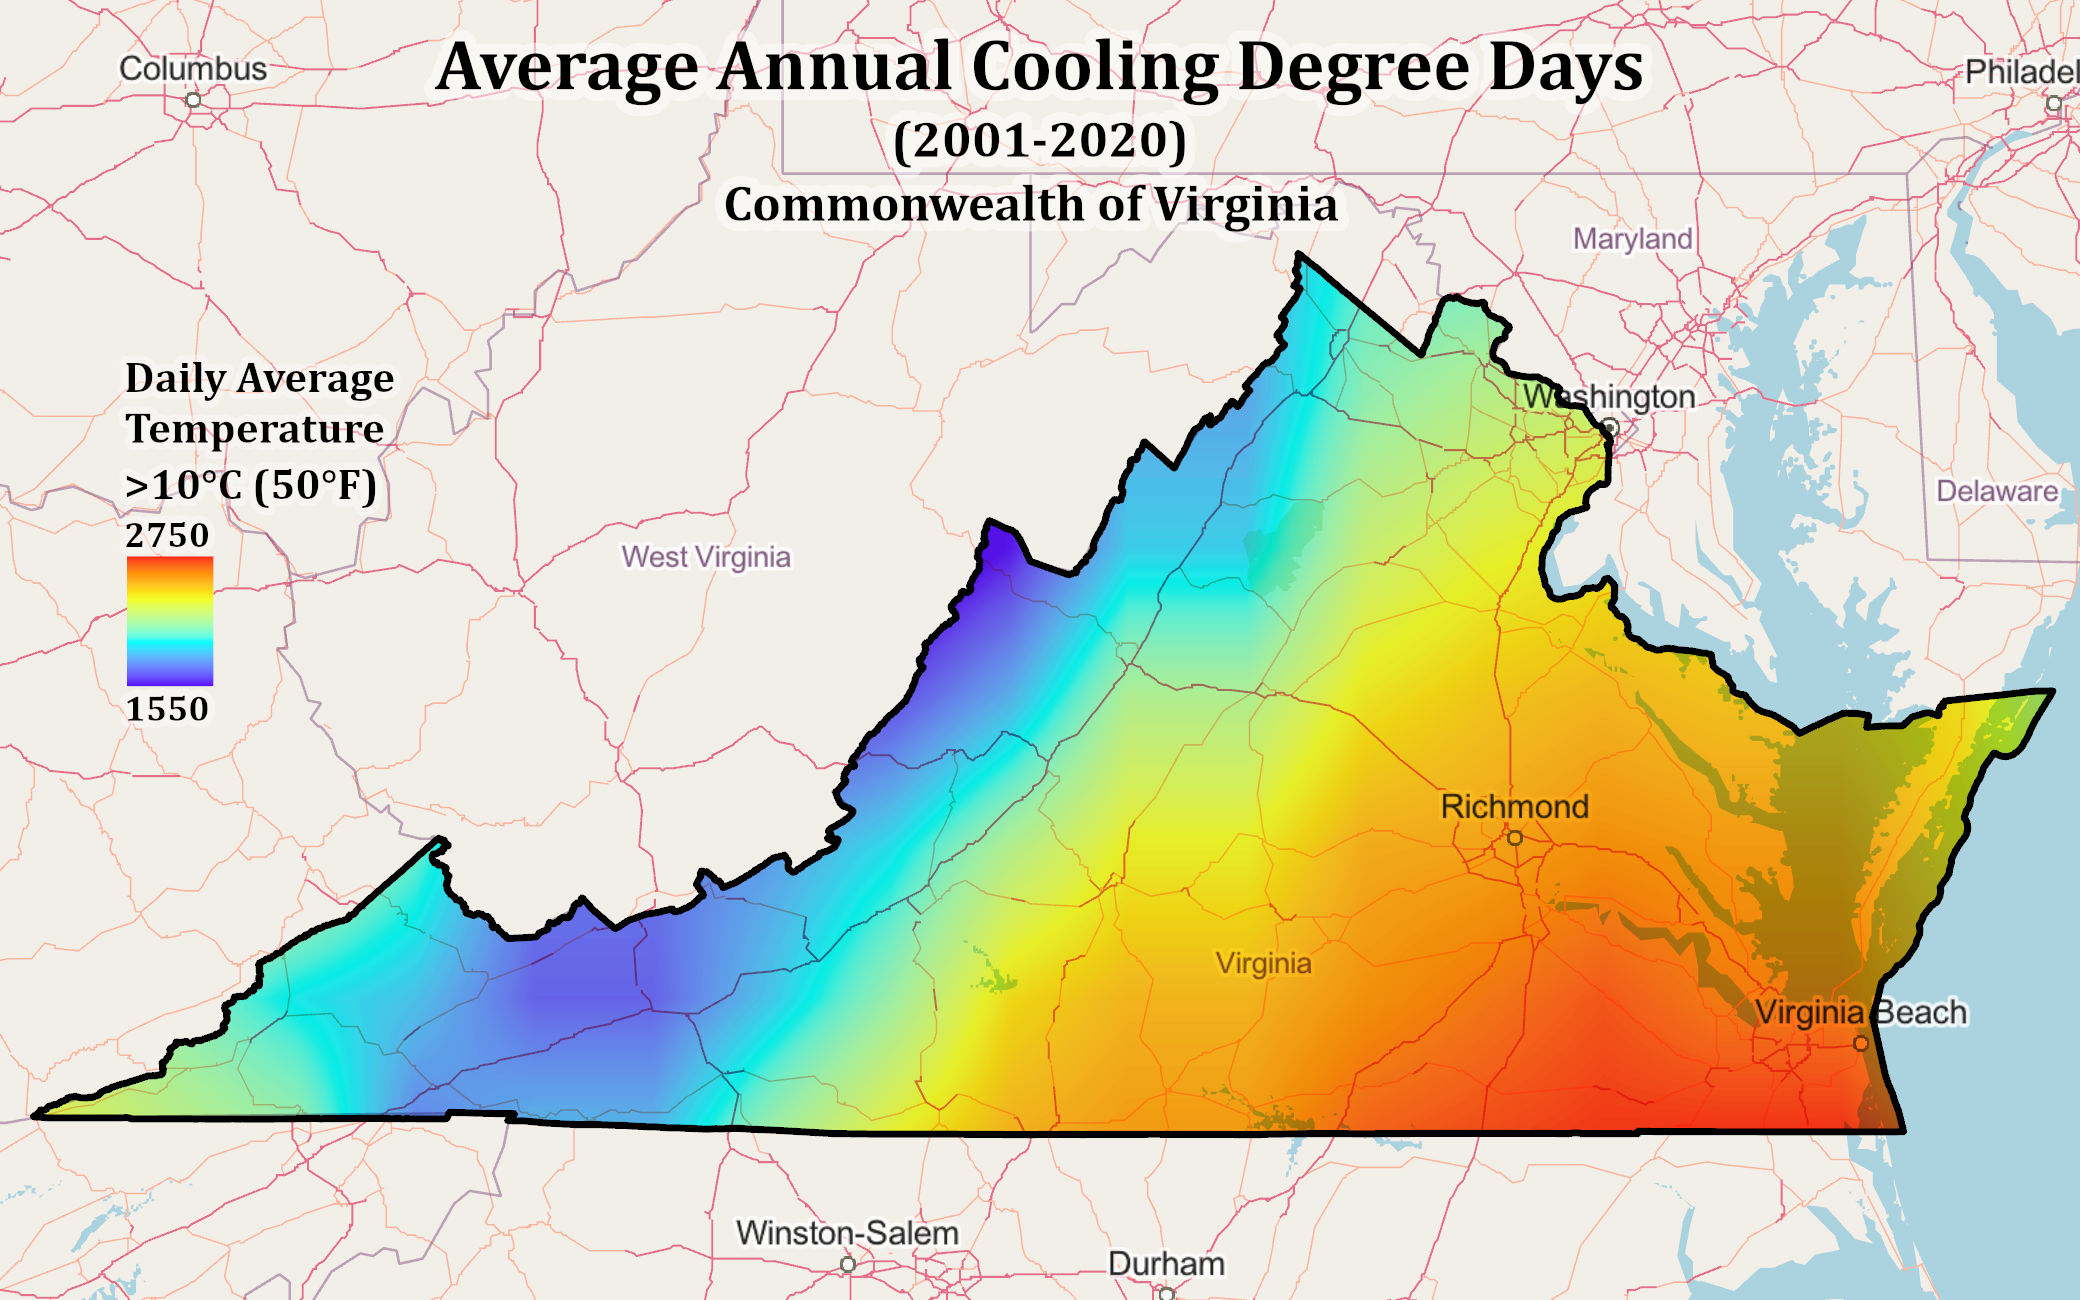
This agreement will help state officials plan for current and potential extreme weather conditions in Virginia and assess implications for electricity demand, energy generation, and system stress. Information can be directly incorporated into energy policy, planning, and operational decisions.
By helping Virginians better anticipate energy demands, prepare for extreme weather, and understand factors affecting electricity generation, this partnership will support a more reliable and resilient energy system.
“Sound energy planning depends on models that reflect real-world conditions,” said Virginia Energy Director Vince Maiden. “This collaboration will help us better understand how weather affects electricity supply and demand, identify vulnerabilities, and weigh resource tradeoffs with greater confidence.”
The partnership will infuse relevant NASA Prediction of Worldwide Energy Resources (POWER) data products into Virginia Energy’s modeling and analysis system. The POWER information supports energy generation system designs and prediction of energy production using validated data products from NASA’s Earth Science to Action program. Those key NASA products represent research and development across NASA including Langley, Goddard Space Flight Center in Greenbelt, Maryland, and Ames Research Center in California’s Silicon Valley.
Through a digital pipeline, Virginia Energy can connect to Langley’s POWER web platform to download specific datasets and put them directly into their modeling tools. NASA’s POWER team members will work with Virginia Energy researchers to streamline the exchange, adjust formats, and evaluate the need for additional data.
This new partnership was fostered through NASA Langley’s Strategic Partnerships Office that connects industry, academia, and other government agencies with center facilities, capabilities, specialized test environments, and technical expertise to bring ideas to life.
For more information on strategic partnerships at NASA Langley, visit:
https://www.nasa.gov/centers-and-facilities/langley/explore-langley-partnerships/
Source: www.nasa.gov
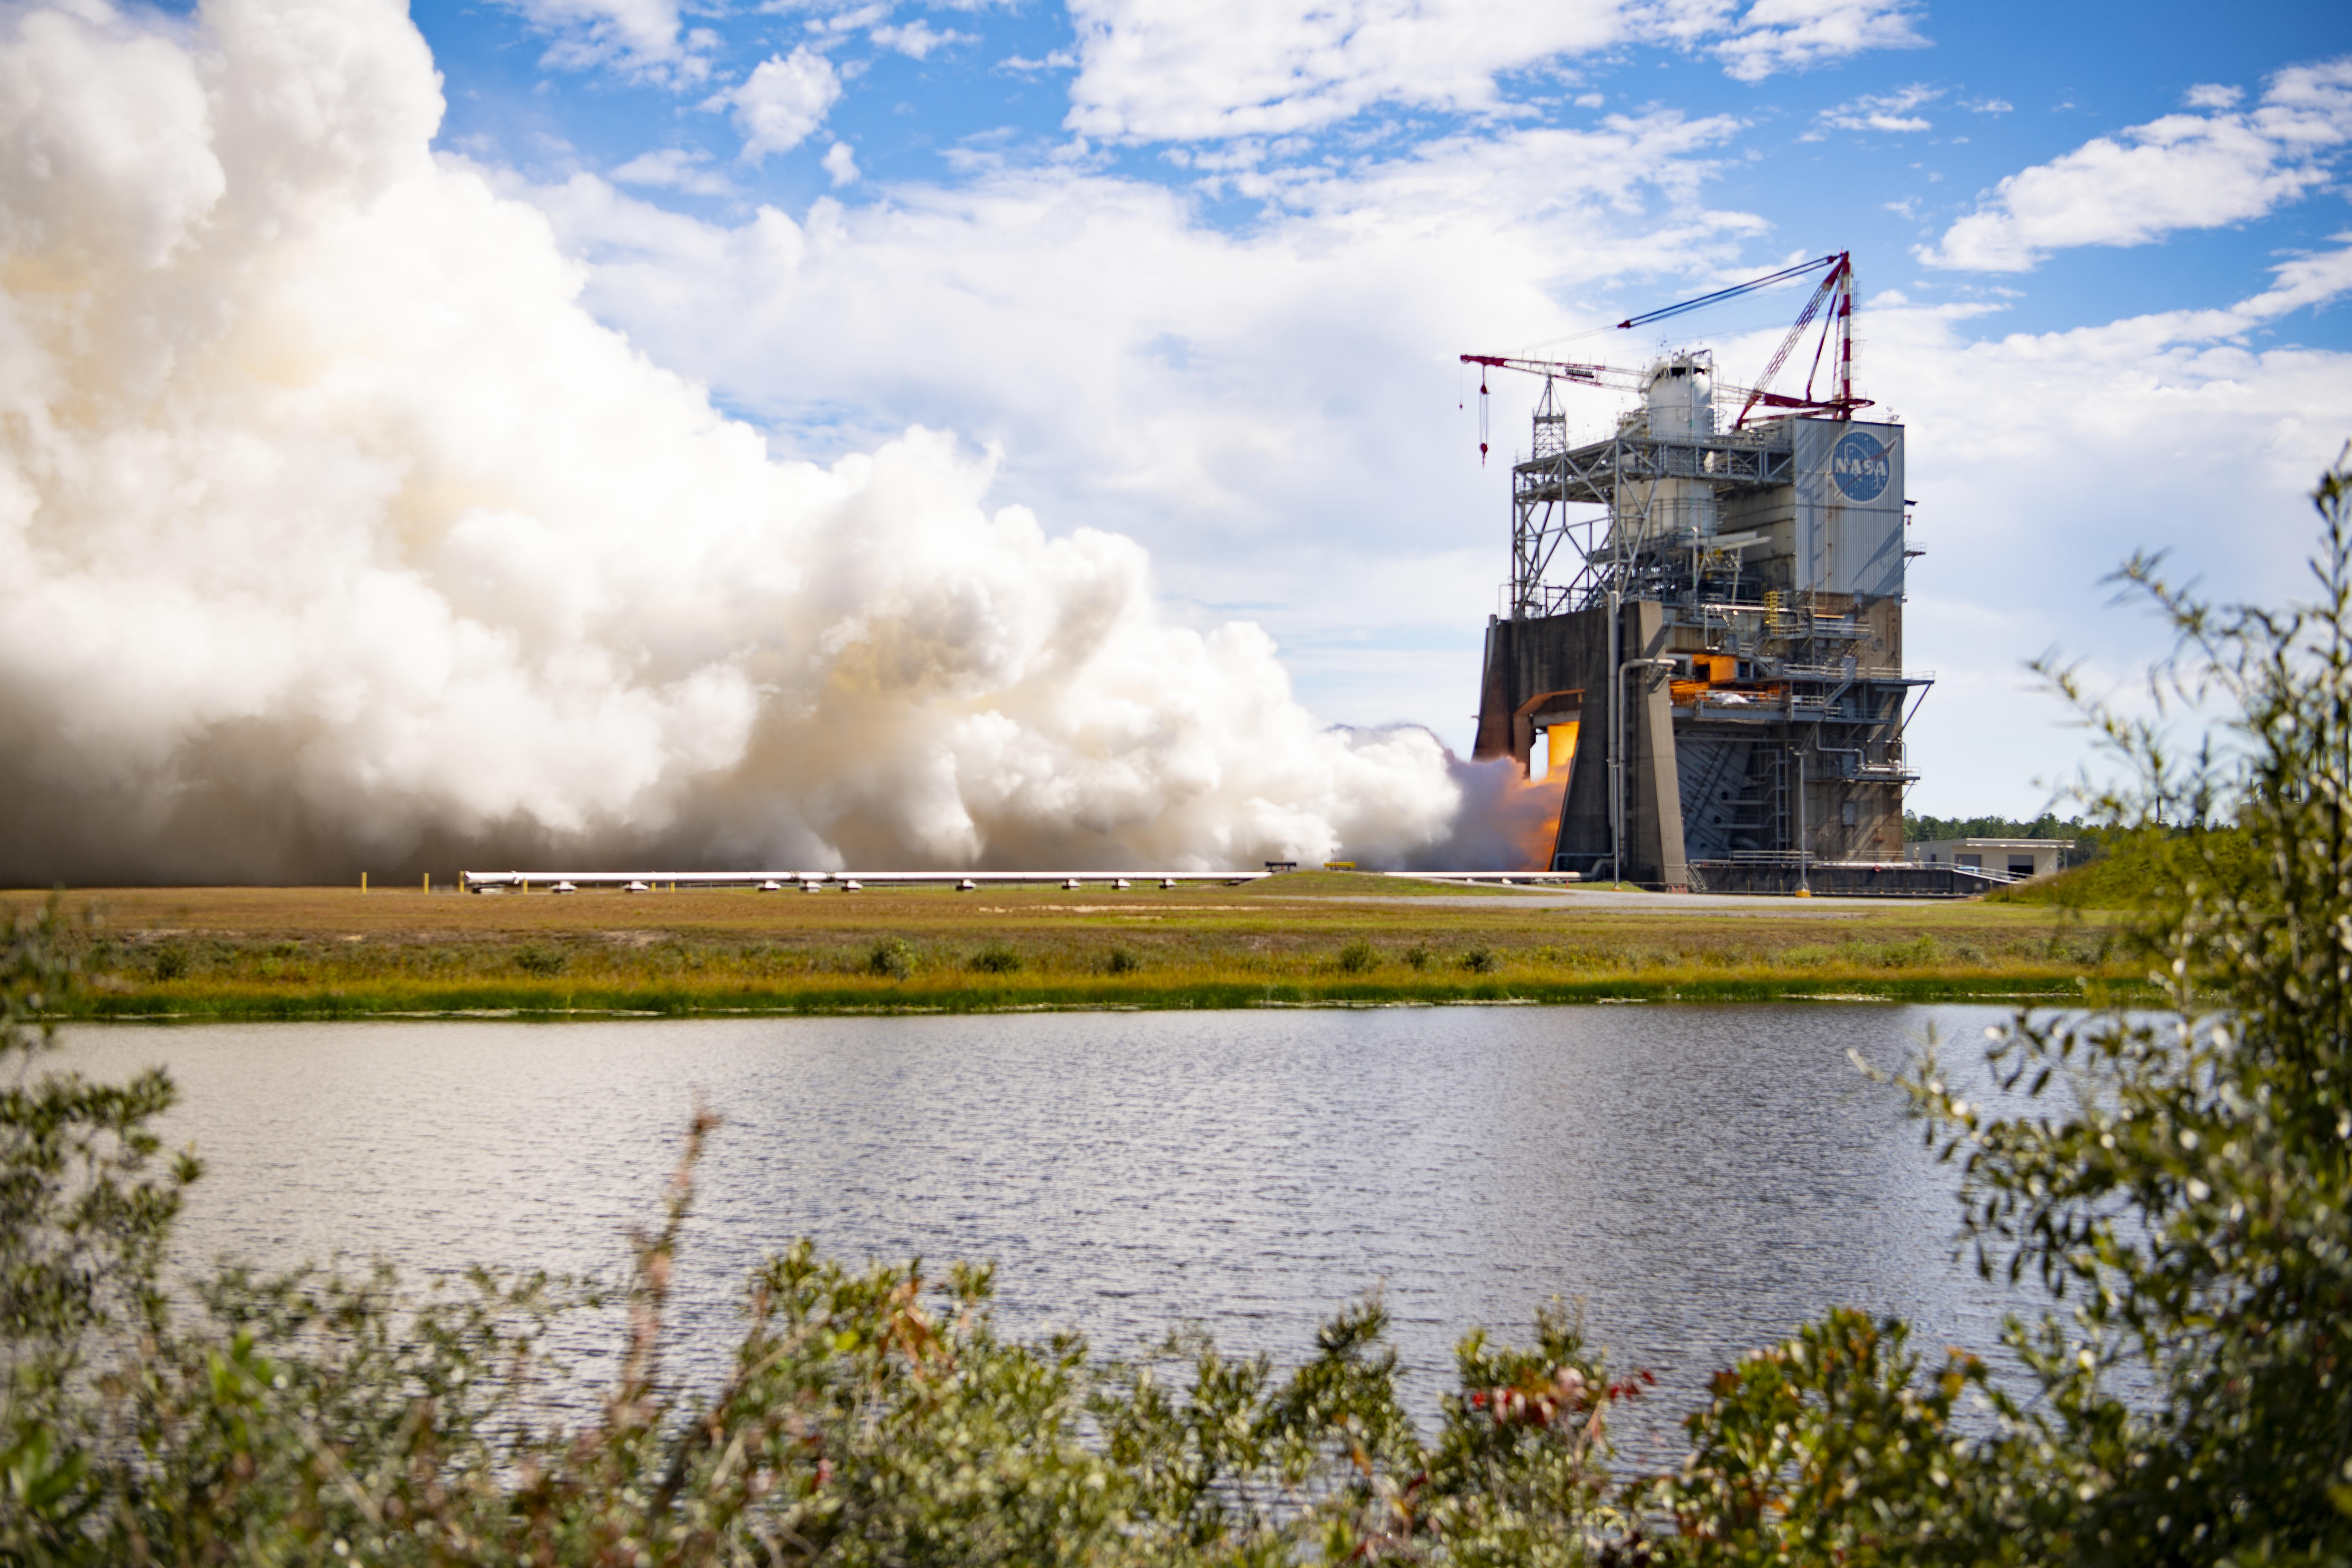
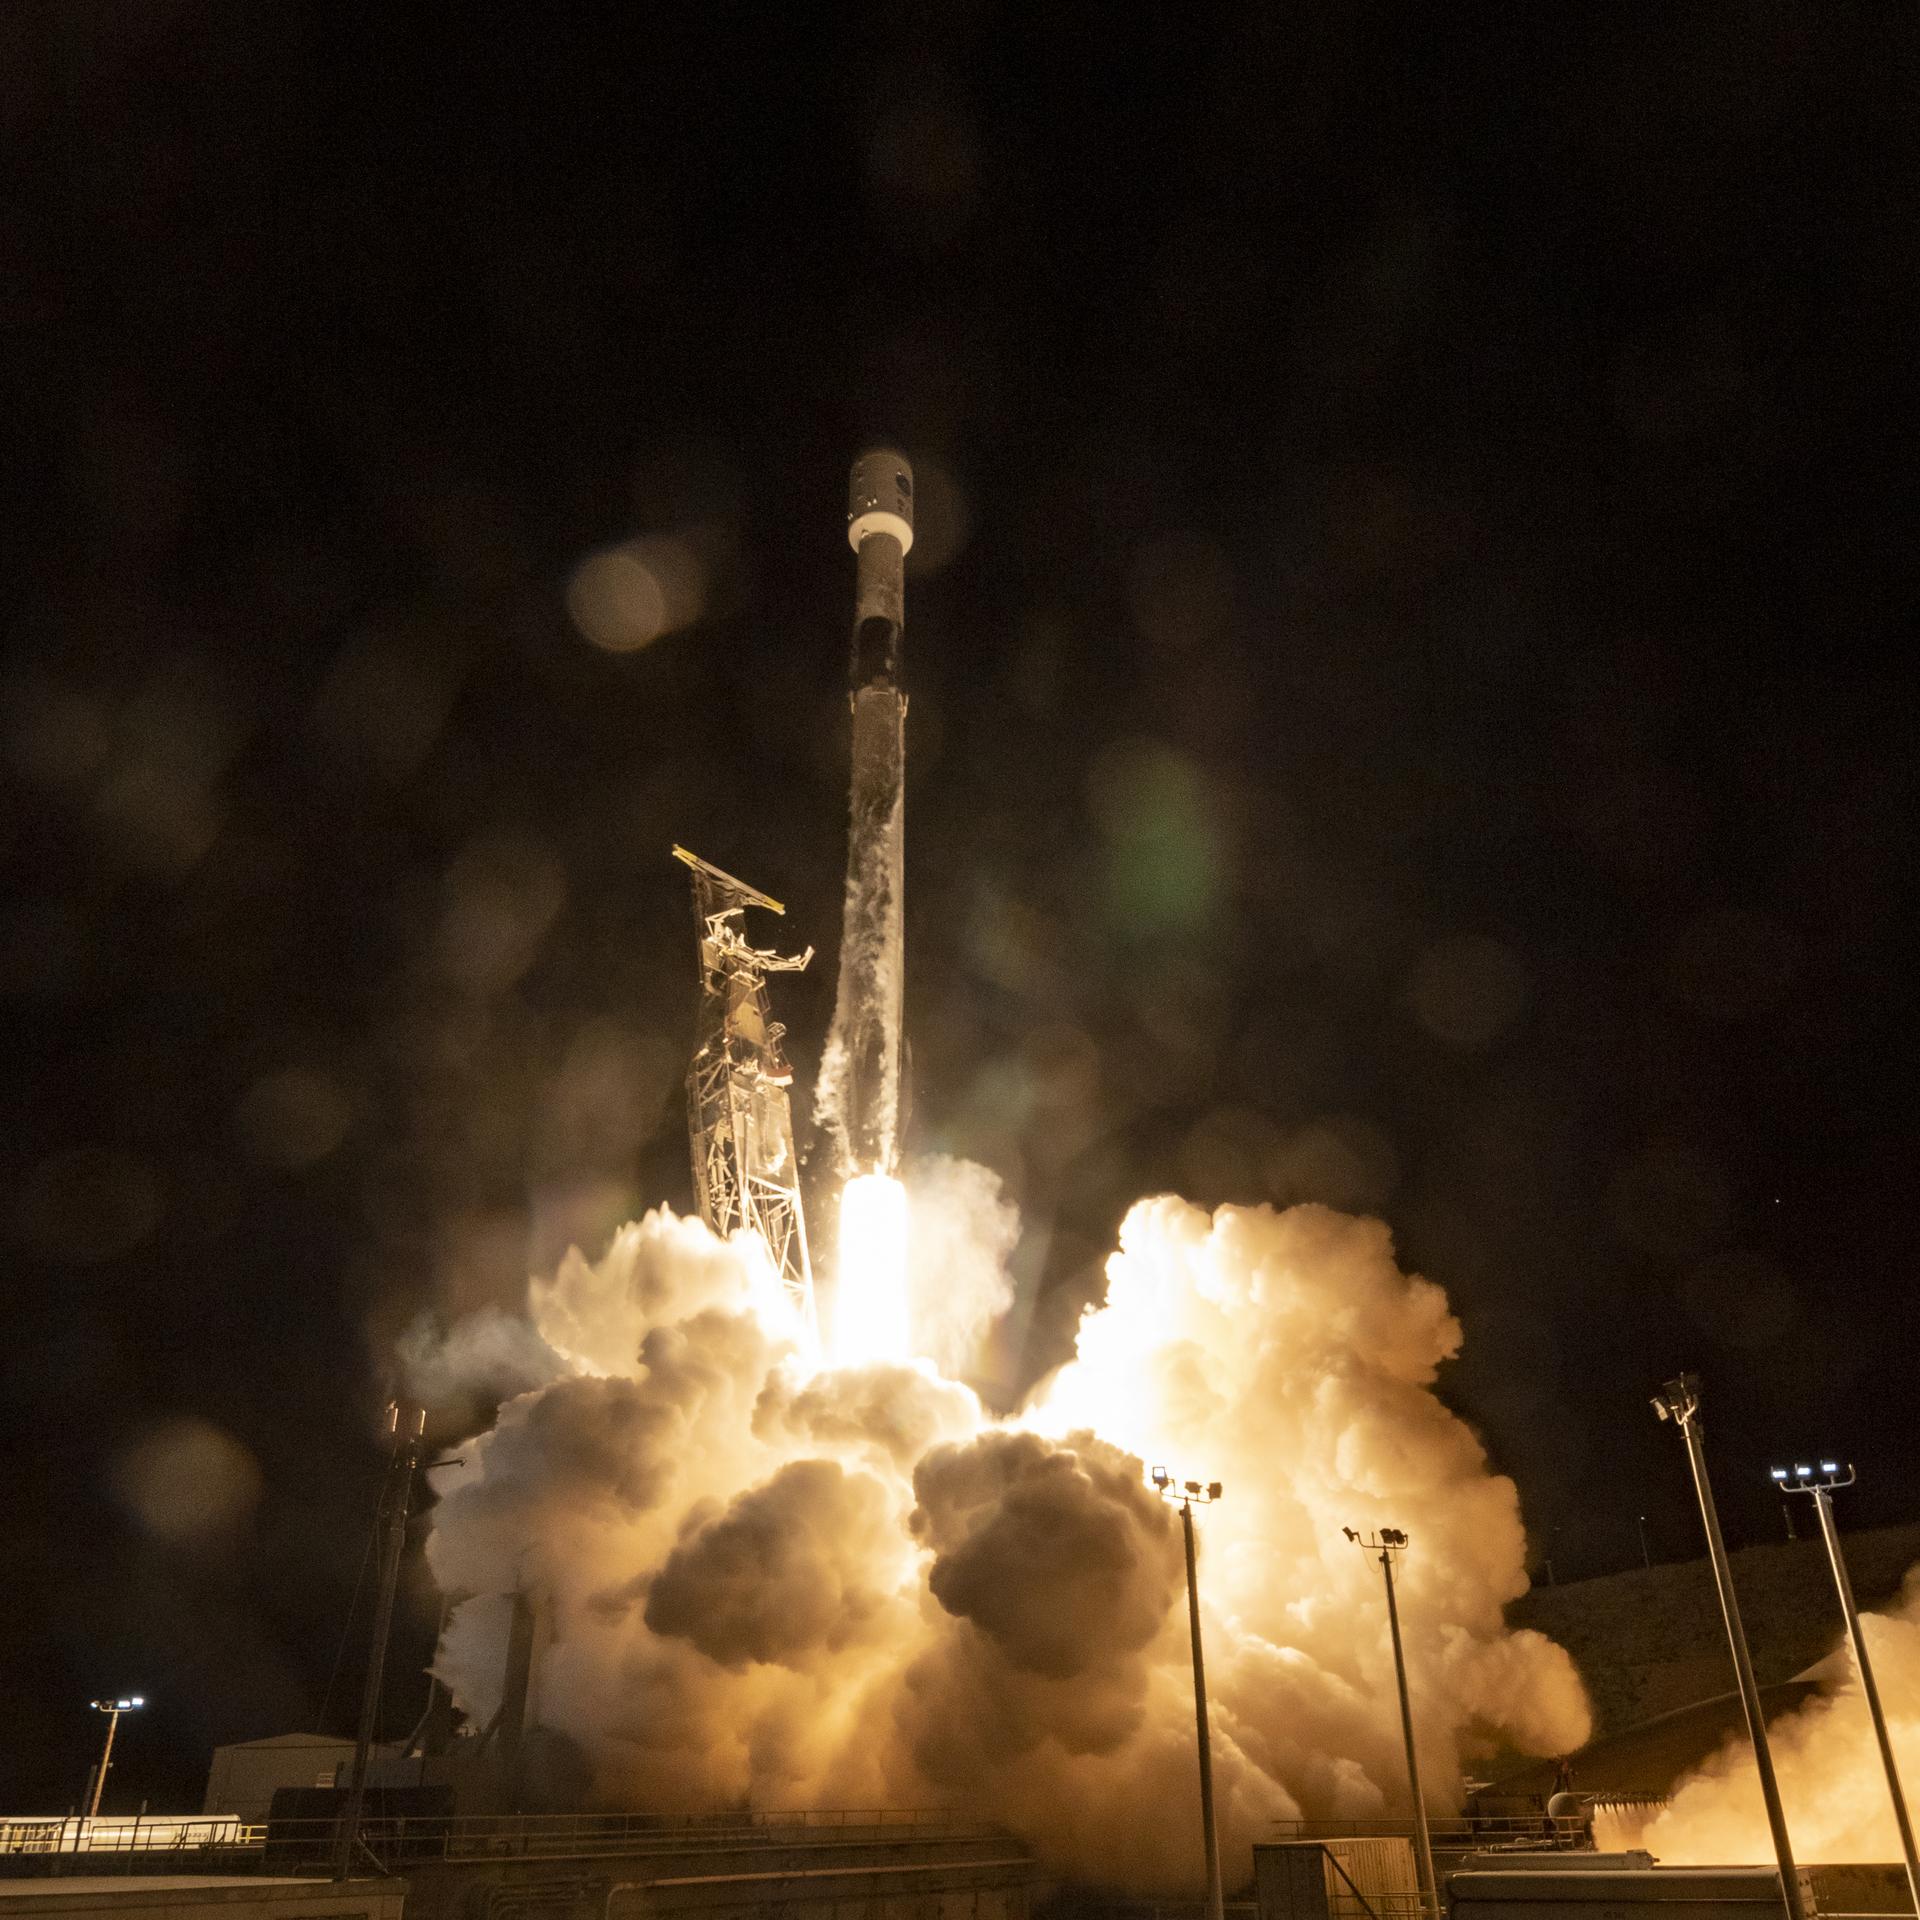
Teams at NASA’s Stennis Space Center near Bay St. Louis, Mississippi tested RS-25 engine No. 10001 on Oct. 21, 2026. The hot fire test lasted for almost eight-and-a-half minutes (500 seconds), the same amount of time RS-25 engines fire during launch of NASA’s SLS (Space Launch System) rocket, with a 111% power level. For each Artemis mission, four RS-25 engines produce up to 2 million pounds of combined thrust to help launch the SLS rocket.
Prior to use, all RS-25 engines are proven flightworthy at NASA Stennis. While this developmental engine will not be used in flight, the hot fire test provides NASA and NASA’s prime engine contractor L3Harris Technologies with the capability to capture critical data to improve engine performance and reliability.
Image credit: NASA/Danny Nowlin
Source: www.nasa.gov