El Niño Then and Now


october 13, 1997
october 12, 2026

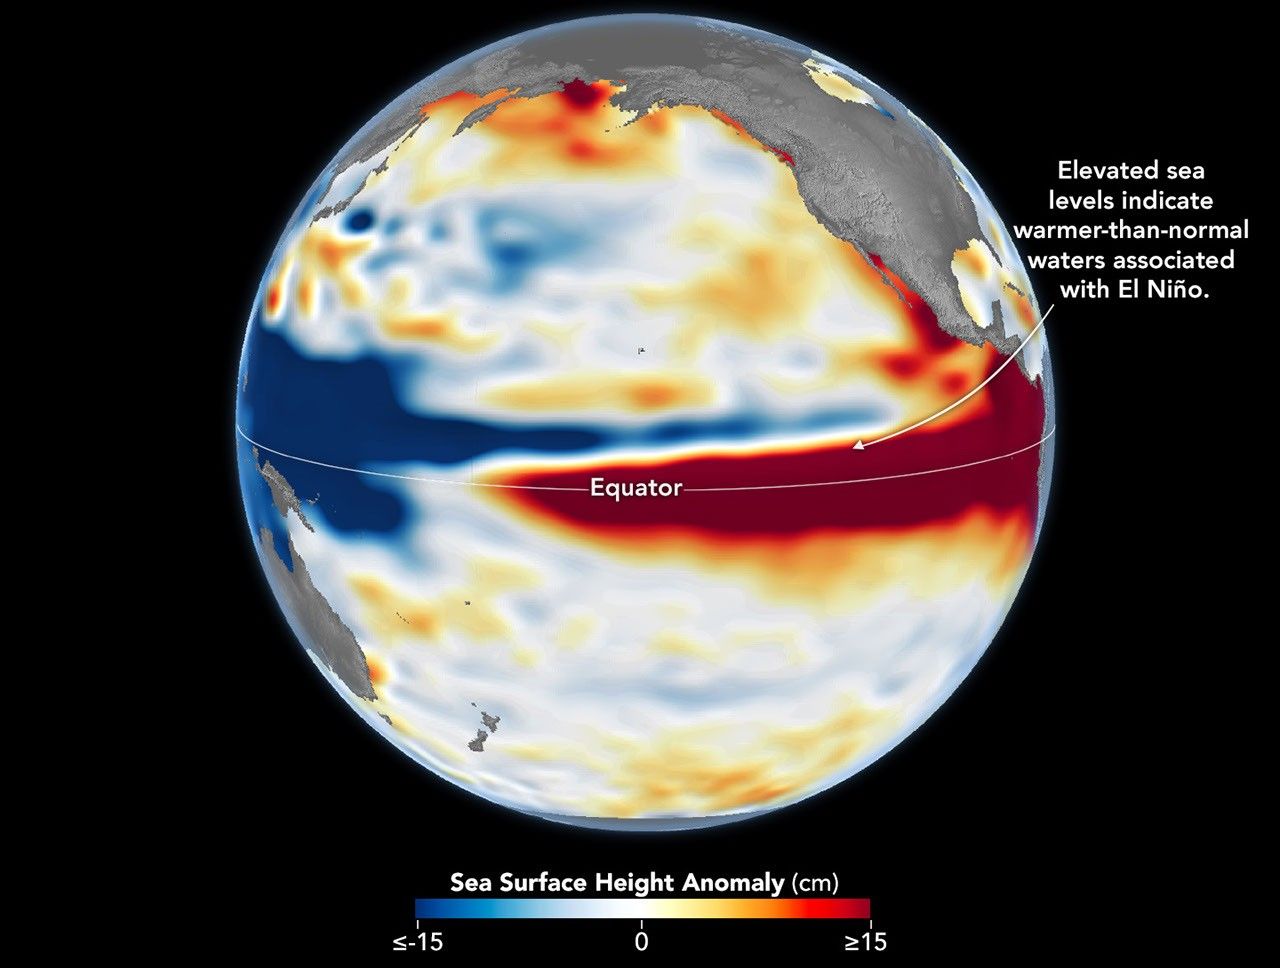
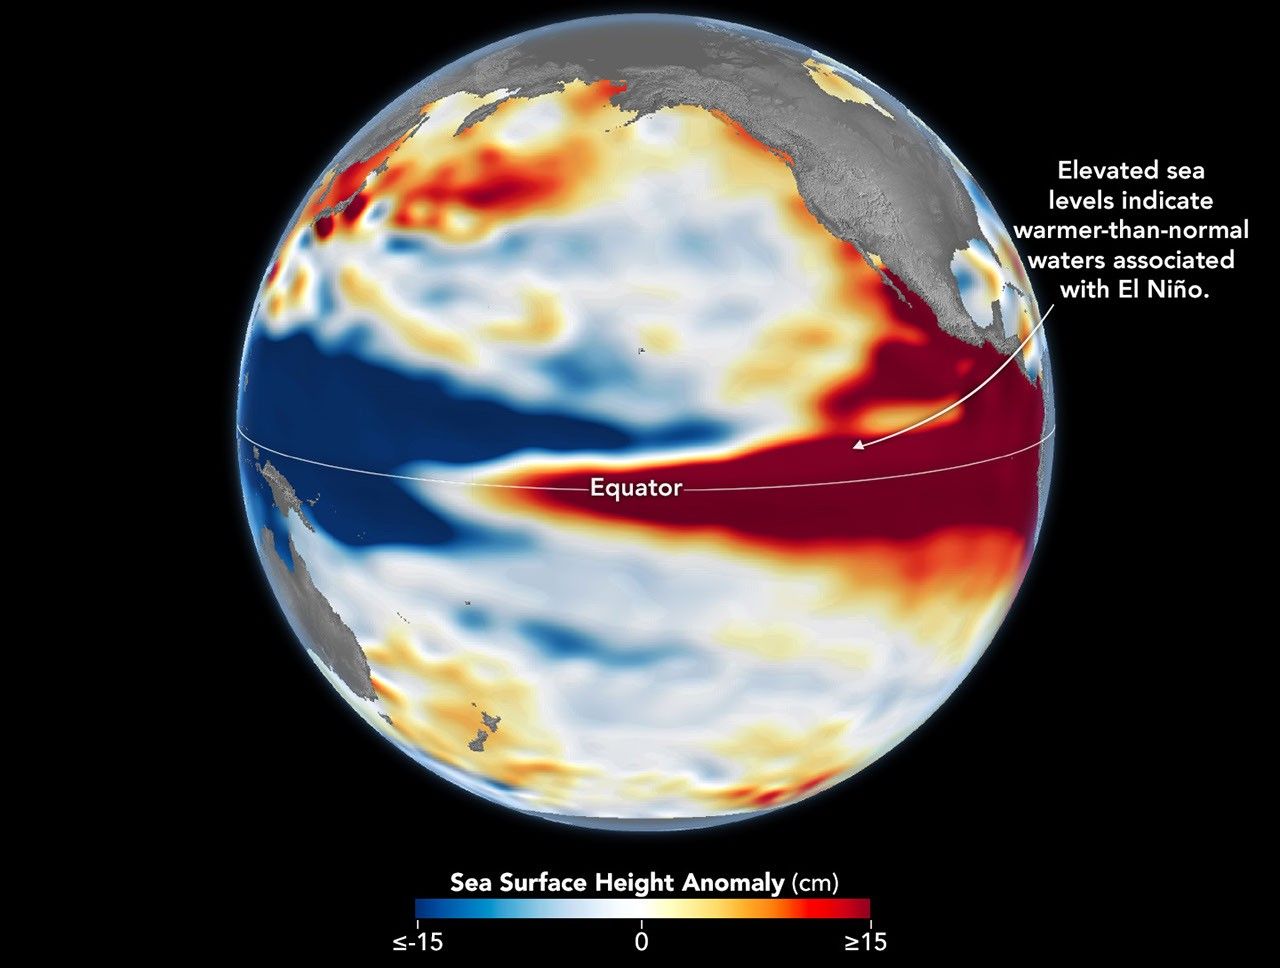
Side-by-side maps of the Pacific Ocean compare sea surface height anomalies in October 1997 (left) and October 2026 (right). In both, red areas of higher-than-normal sea surface height stretch across the central and eastern Pacific and reach South America.
Sea levels are higher than normal across the central and eastern equatorial Pacific in October 2026 (right), a hallmark of El Niño. The pattern closely resembles October 1997 (left), during another one of the strongest El Niño events in the satellite altimetry record.
NASA Earth Observatory / Lauren Dauphin


october 13, 1997

october 12, 2026

October 13, 1997 – October 12, 2026


Sea levels are higher than normal across the central and eastern equatorial Pacific in October 2026 (right), a hallmark of El Niño. The pattern closely resembles October 1997 (left), during another one of the strongest El Niño events in the satellite altimetry record. Maps by NASA Earth Observatory/Lauren Dauphin using altimetry data provided by NASA/JPL-Caltech.

El Niño is part of a natural climate pattern that occurs roughly every two to seven years, bringing warmer-than-normal water to parts of the equatorial Pacific. The most recent very strong El Niño events, in 1997-98 and 2015-16, upended weather patterns. Impacts spanned the planet, from fires in Indonesia and the Amazon, to crop failures due to drought in southern Africa, to heavy rain and coastal flooding in Southern California. The current El Niño rivals these past heavyweights.

Every El Niño grows from a feedback loop between the atmosphere and the ocean. Trade winds normally keep warm water piled up in the western Pacific, where it stands higher than in the east. When those winds weaken, that warm water begins to pulse eastward, which further weakens and sometimes reverses the winds, allowing even more warm water to move east. The cycle intensifies as waters continue to warm and pile up in the central and eastern Pacific.

But each El Niño has its own character, shaped by where in the Pacific the warmth builds and how the atmosphere responds. “The search for the ‘typical’ El Niño is very elusive,” said Josh Willis, project scientist for sea level missions at NASA’s Jet Propulsion Laboratory (JPL). “They’re all different in terms of where they land and how their impacts play out.”

Altimetry satellites can track those differences by measuring the height of the sea surface. Because water expands as it warms, higher-than-normal sea levels in the central and eastern equatorial Pacific signal the buildup of heat associated with El Niño. The maps above depict sea surface height anomalies across the Pacific Ocean on October 13, 1997 (left), and on October 12, 2026 (right). Data are from the TOPEX/Poseidon satellite and the Sentinel-6 Michael Freilich satellite, respectively, and were processed by scientists at JPL.

Shades of red indicate where sea levels were higher than average. Normal sea level conditions appear white, and lower areas are blue. Signals related to seasonal cycles and long-term trends have been removed to highlight sea level anomalies associated with El Niño and other short-term natural phenomena.

“What’s unique about altimetry is that we have a 35-year record from nearly identical satellites flying almost the same ground track, with each mission overlapping the next,” Willis said. “That lets us look back in time and compare this El Niño to what happened in 1997. And right now, this one is on track to be even bigger.”

Compared with the 1997-98 event, El Niño in 2026 came on much more suddenly. But as of October, the two events appear similar in character—the tilt of sea level (low in the west and high in the east) and high, warm water extending all the way to South America—so Willis thinks the impacts could be similar as well. In 1997-98, that meant, for instance, lots of rain in California and across the southern tier of the U.S.
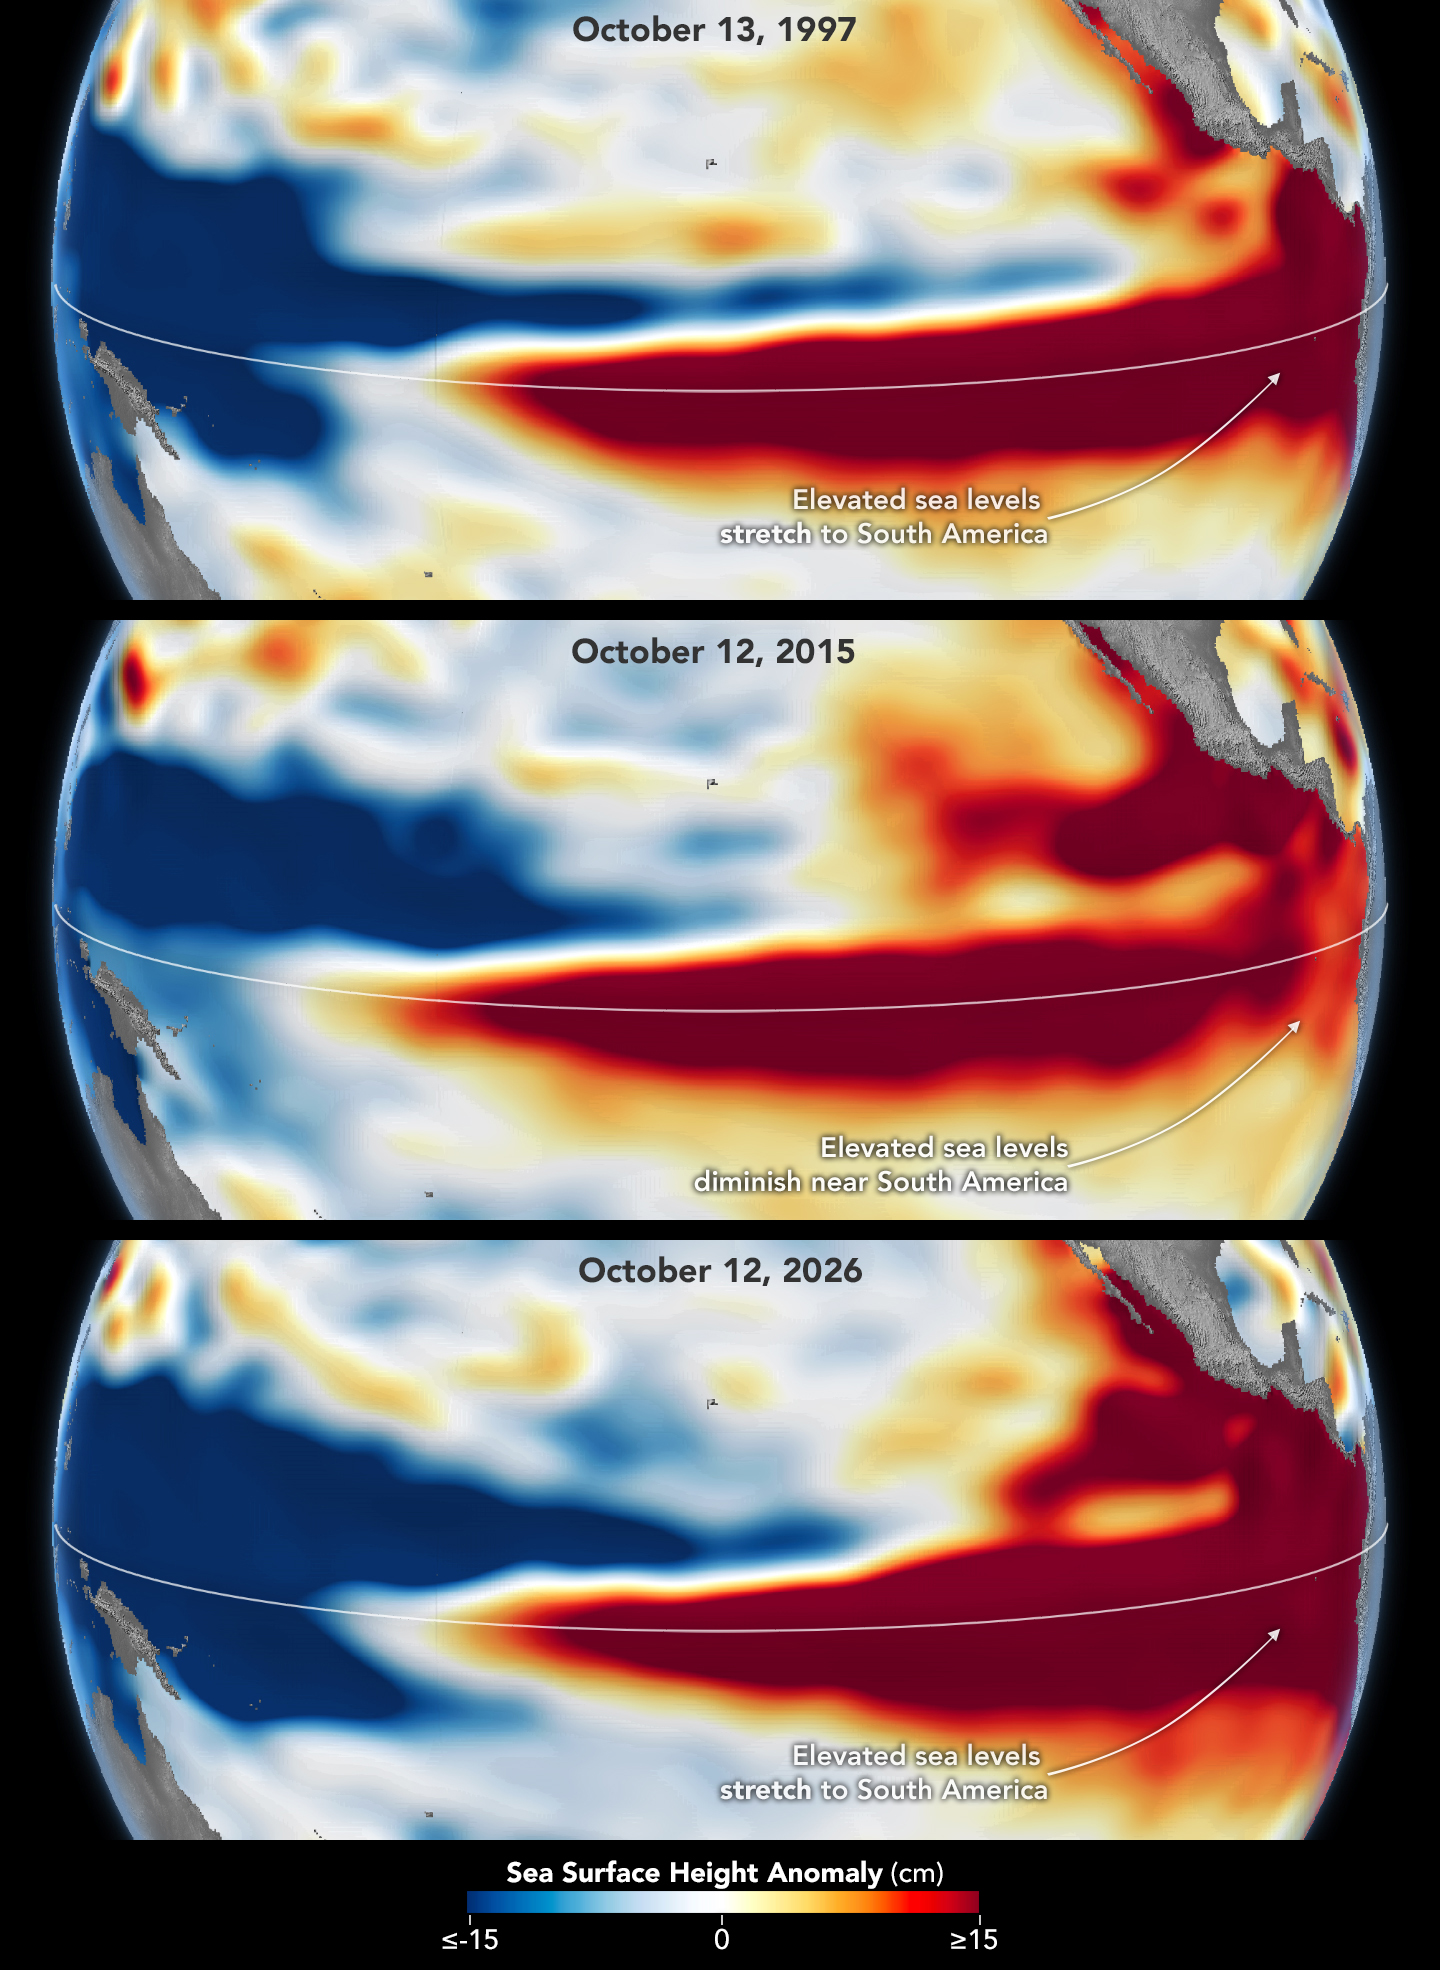
Three stacked maps of the Pacific Ocean compare sea surface height anomalies in October 1997 (top), October 2015 (middle), and October 2026 (bottom). In 1997 and 2026, dark red areas of exceptionally high sea surface height extend across the eastern Pacific and pile up against the coast of South America. In 2015, the dark red stays farther offshore and does not reach the coast.
The 2015-16 El Niño was also very strong, as elevated sea levels in October 2015 (middle) show. But its pattern differed from those in October 1997 (top) and October 2026 (bottom): less of the elevated water reached the coast of South America, which contributed to different weather patterns that year.

The 2015-16 El Niño was another heavy hitter but differed in its character. Sea surface height anomalies on October 12, 2015, based on altimetry data from the Jason-2 satellite, are shown above in context with maps from around the same time in 1997 and 2026. In 2015, the exceptionally warm, high water along the equator didn’t push up against South America to the extent it did in the other years. Rainfall impacts that winter concentrated more over Central America and the southeastern U.S., with significant flooding in Mexico.

NOAA’s El Niño outlook on October 8, 2026, called for an 83 percent chance of a strong-to-very strong El Niño through the first three months of 2027. But exactly how the impacts will play out in winter 2026-27 and beyond remains to be seen. Willis noted that El Niño’s influence propagates through a chaotic atmosphere, and the signal can get muddled as it extends beyond the tropics. “There’s always a bit of a dice roll here,” Willis said. “Just because this El Niño looks like 1997 doesn’t mean it will be exactly the same—it’s just our best guess at the moment.”

NASA Earth Observatory maps by Lauren Dauphin, using NASA-SSH altimetry data provided by Josh Willis, Severine Fournier, and Kevin Marlis, NASA/JPL-Caltech. Story by Kathryn Hansen.

References & Resources

You may also be interested in:

Stay up-to-date with the latest content from NASA as we explore the universe and discover more about our home planet.
El Niño Is Underway

4 min read

Satellite observations of sea surface height indicated that the 2026 event continued to strengthen in early June.
Article

How the Tide Turns at the Mouth of the Elbe

4 min read

The ocean’s ebbs and flows reveal dynamic tidal flats and a well-traveled shipping route along the coast of Germany.

Article

El Niño Alters Marine Life in the Pacific

5 min read

Satellite measurements of chlorophyll at the sea surface signal shifts in the ocean’s nutrient supplies in mid-2026.

Article

Source: science.nasa.gov

APOD: 2026 October 23 – Andromeda in Southern Spring

APOD

Astronomy Picture of the Day

Discover the cosmos! Each day a different image or photograph of our fascinating universe is featured, along with a brief explanation written by a professional astronomer.

The Andromeda galaxy above rolling hills.

Andromeda in Southern Spring

Explanation: Looking toward the north from Mullion, New South Wales, Australia, the Andromeda Galaxy never gets more than a few degrees above the horizon. During the southern hemisphere spring, Andromeda is highest in the sky around midnight though. And in this telephoto scene from October 10/11, multiple exposures were used to reveal the spiral galaxy in tantalizing detail as it climbed above rolling Australian hills. Also known as M31, the Andromeda Galaxy is one of the brightest objects in the Messier catalog, but is only visible to the unaided eye as a small, faint, fuzzy patch. Digitally tracked and stacked frames were combined with a foreground shot in the deep astro-image composite to reveal the galaxy’s greater extent in planet Earth’s night. In the springtime night skyscape,the closest large spiral galaxy spans nearly 6 full moons.

Tomorrow’s picture: pixels in space

Date October 23, 2026
Credit & Copyright: Lucy Yunxi Hu
Authors & editors: Jerry Bonnell, Cecilia Chirenti, Robert Nemiroff, Keighley Rockcliffe
A service of: ASD at NASA / GSFC,
NASA Science Activation & Michigan Tech. U.

Source: science.nasa.gov
NASA, Virginia Launch Power Partnership for Energy Security

3 min read

Preparations for Next Moonwalk Simulations Underway (and Underwater)

NASA is helping to foster long-term energy security in Virginia. 

NASA’s Langley Research Center in Hampton, Virginia, is partnering with the Virginia Department of Energy to support informed decisions for effective energy generation, delivery and use by providing solar, meteorological, and future weather risk datasets for energy system modeling and planning purposes.

Under a new Space Act Agreement announced during a ceremony Friday, the partnership will use NASA expertise in atmospheric sciences to assist Virginia Energy in support of resiliency studies, resource analysis, and long-term energy planning.

“NASA Langley relishes the opportunity to put our unique science data into the hands of those who want to improve people’s lives,” said NASA Langley Deputy Director Allen Kilgore. “This collaboration with Virginia Energy will benefit the citizens of Virginia and provide stronger energy security for the Commonwealth.”

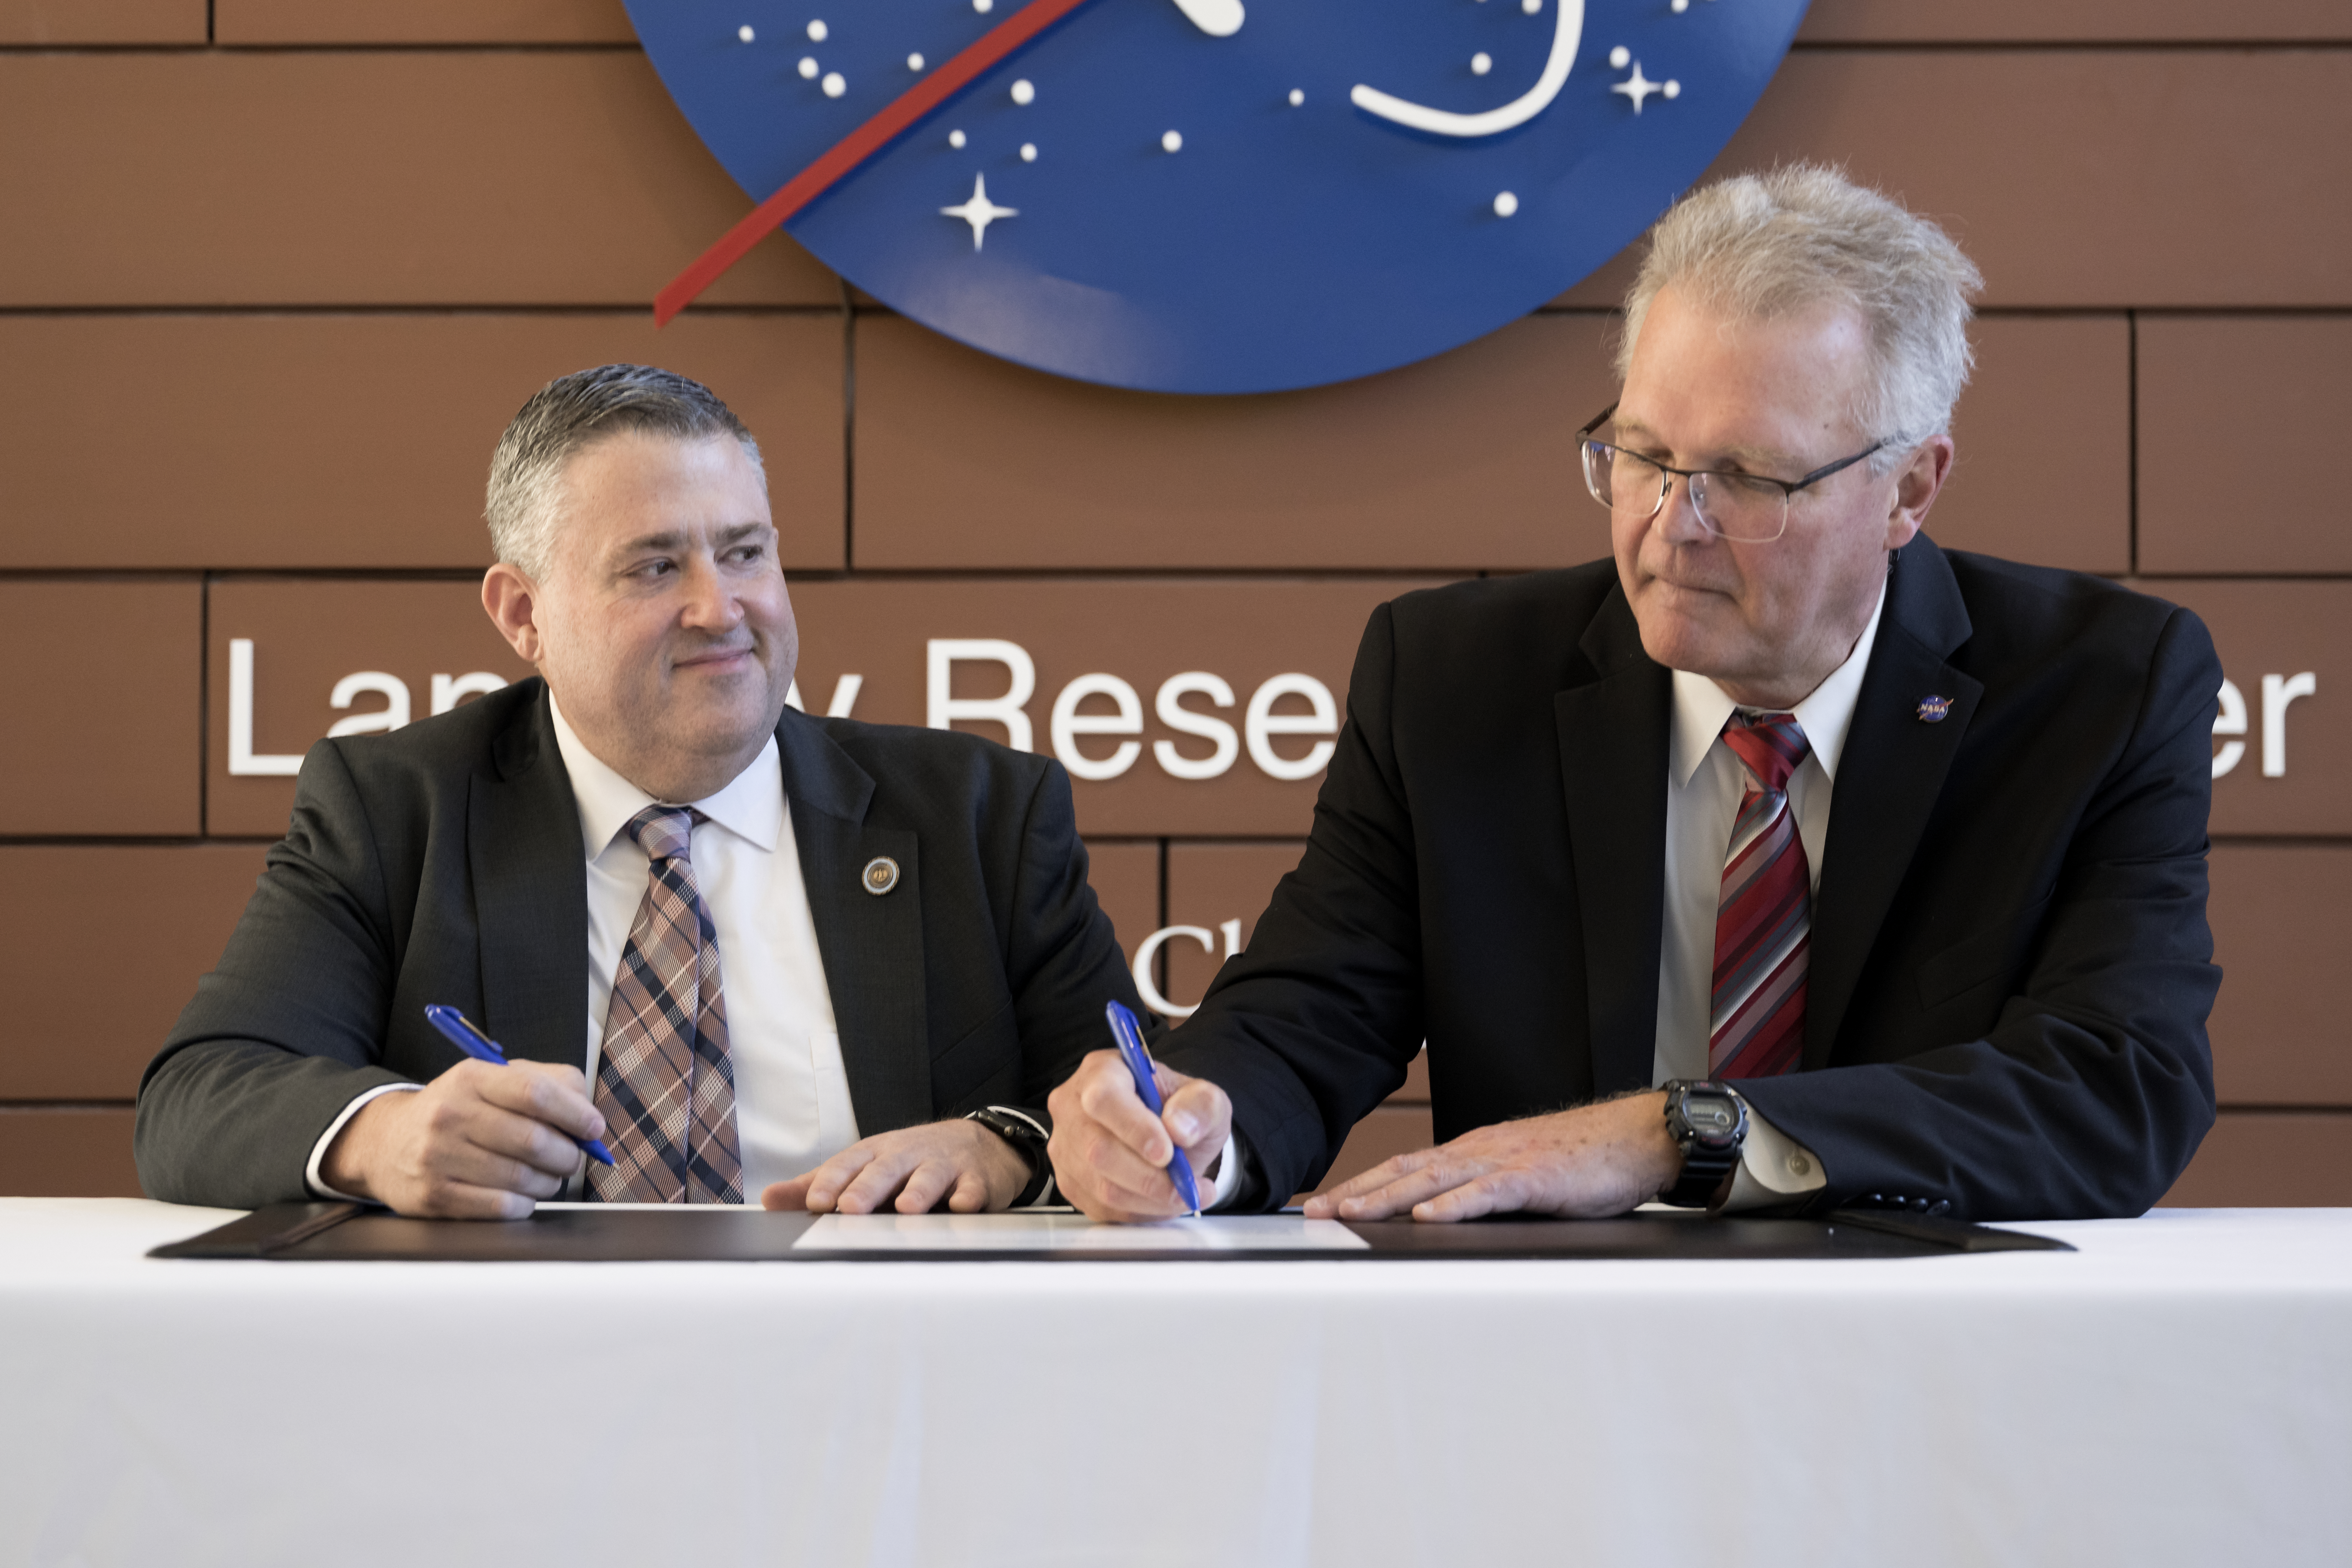
The image shows two men in suits looking down and signing a document on a table. The background wall shows the NASA logo and lettering that spells Langley Research Center.
NASA Langley Deputy Director Allen Kilgore and Virginia Energy Director Vince Maiden sign a new Space Act Agreement during a ceremony announcing the partnership at NASA Langley in Hampton, VA. NASA will provide atmospheric science information to Virginia Energy in support of long-term energy planning.
NASA/Mark Knopp

This agreement will help state officials plan for current and potential extreme weather conditions in Virginia and assess implications for electricity demand, energy generation, and system stress. Information can be directly incorporated into energy policy, planning, and operational decisions.

By helping Virginians better anticipate energy demands, prepare for extreme weather, and understand factors affecting electricity generation, this partnership will support a more reliable and resilient energy system.

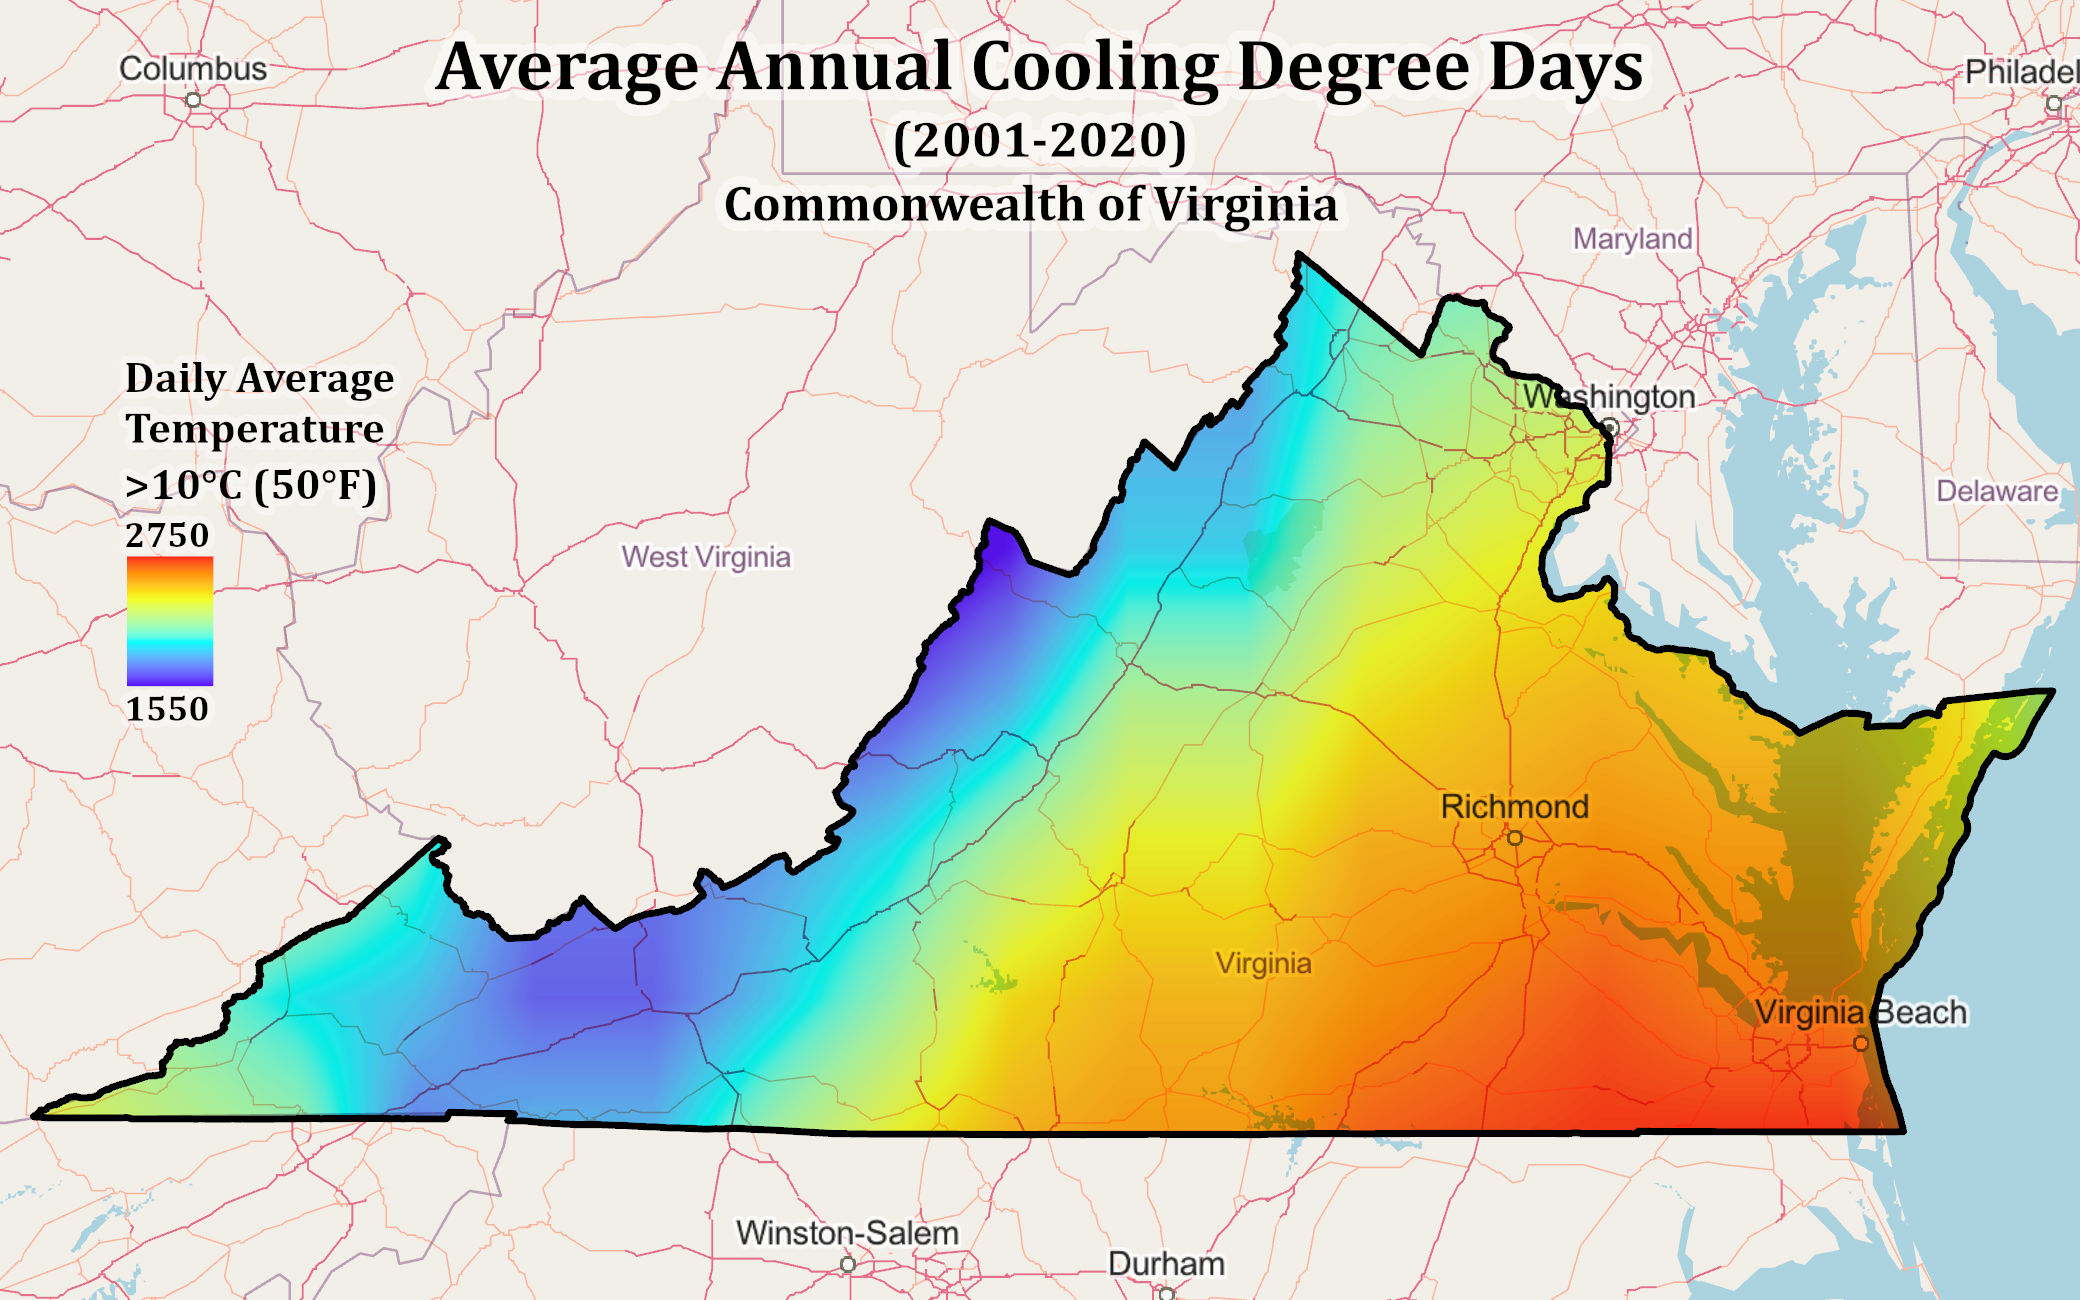
The image shows a graphic map of the state of Virginia with a spectrum of colors across the state that symbolize daily average temperatures from 2001-2020.
NASA POWER data show where cooling demand is highest across Virginia. The map uses cooling degree days, a measure of how often daily average temperatures exceed 50°F (10°C), averaged from 2001 to 2020. These customized energy metrics will help Virginia Energy better understand energy demand and inform future energy planning across the state.
NASA/POWER

“Sound energy planning depends on models that reflect real-world conditions,” said Virginia Energy Director Vince Maiden. “This collaboration will help us better understand how weather affects electricity supply and demand, identify vulnerabilities, and weigh resource tradeoffs with greater confidence.”

The partnership will infuse relevant NASA Prediction of Worldwide Energy Resources (POWER) data products into Virginia Energy’s modeling and analysis system. The POWER information supports energy generation system designs and prediction of energy production using validated data products from NASA’s Earth Science to Action program. Those key NASA products represent research and development across NASA including Langley, Goddard Space Flight Center in Greenbelt, Maryland, and Ames Research Center in California’s Silicon Valley.

Through a digital pipeline, Virginia Energy can connect to Langley’s POWER web platform to download specific datasets and put them directly into their modeling tools. NASA’s POWER team members will work with Virginia Energy researchers to streamline the exchange, adjust formats, and evaluate the need for additional data.

This new partnership was fostered through NASA Langley’s Strategic Partnerships Office that connects industry, academia, and other government agencies with center facilities, capabilities, specialized test environments, and technical expertise to bring ideas to life.

For more information on strategic partnerships at NASA Langley, visit:

https://www.nasa.gov/centers-and-facilities/langley/explore-langley-partnerships/

Details

Last Updated

Oct 23, 2026

Related Terms

Source: www.nasa.gov

RS-25 Engine Tests at NASA Stennis

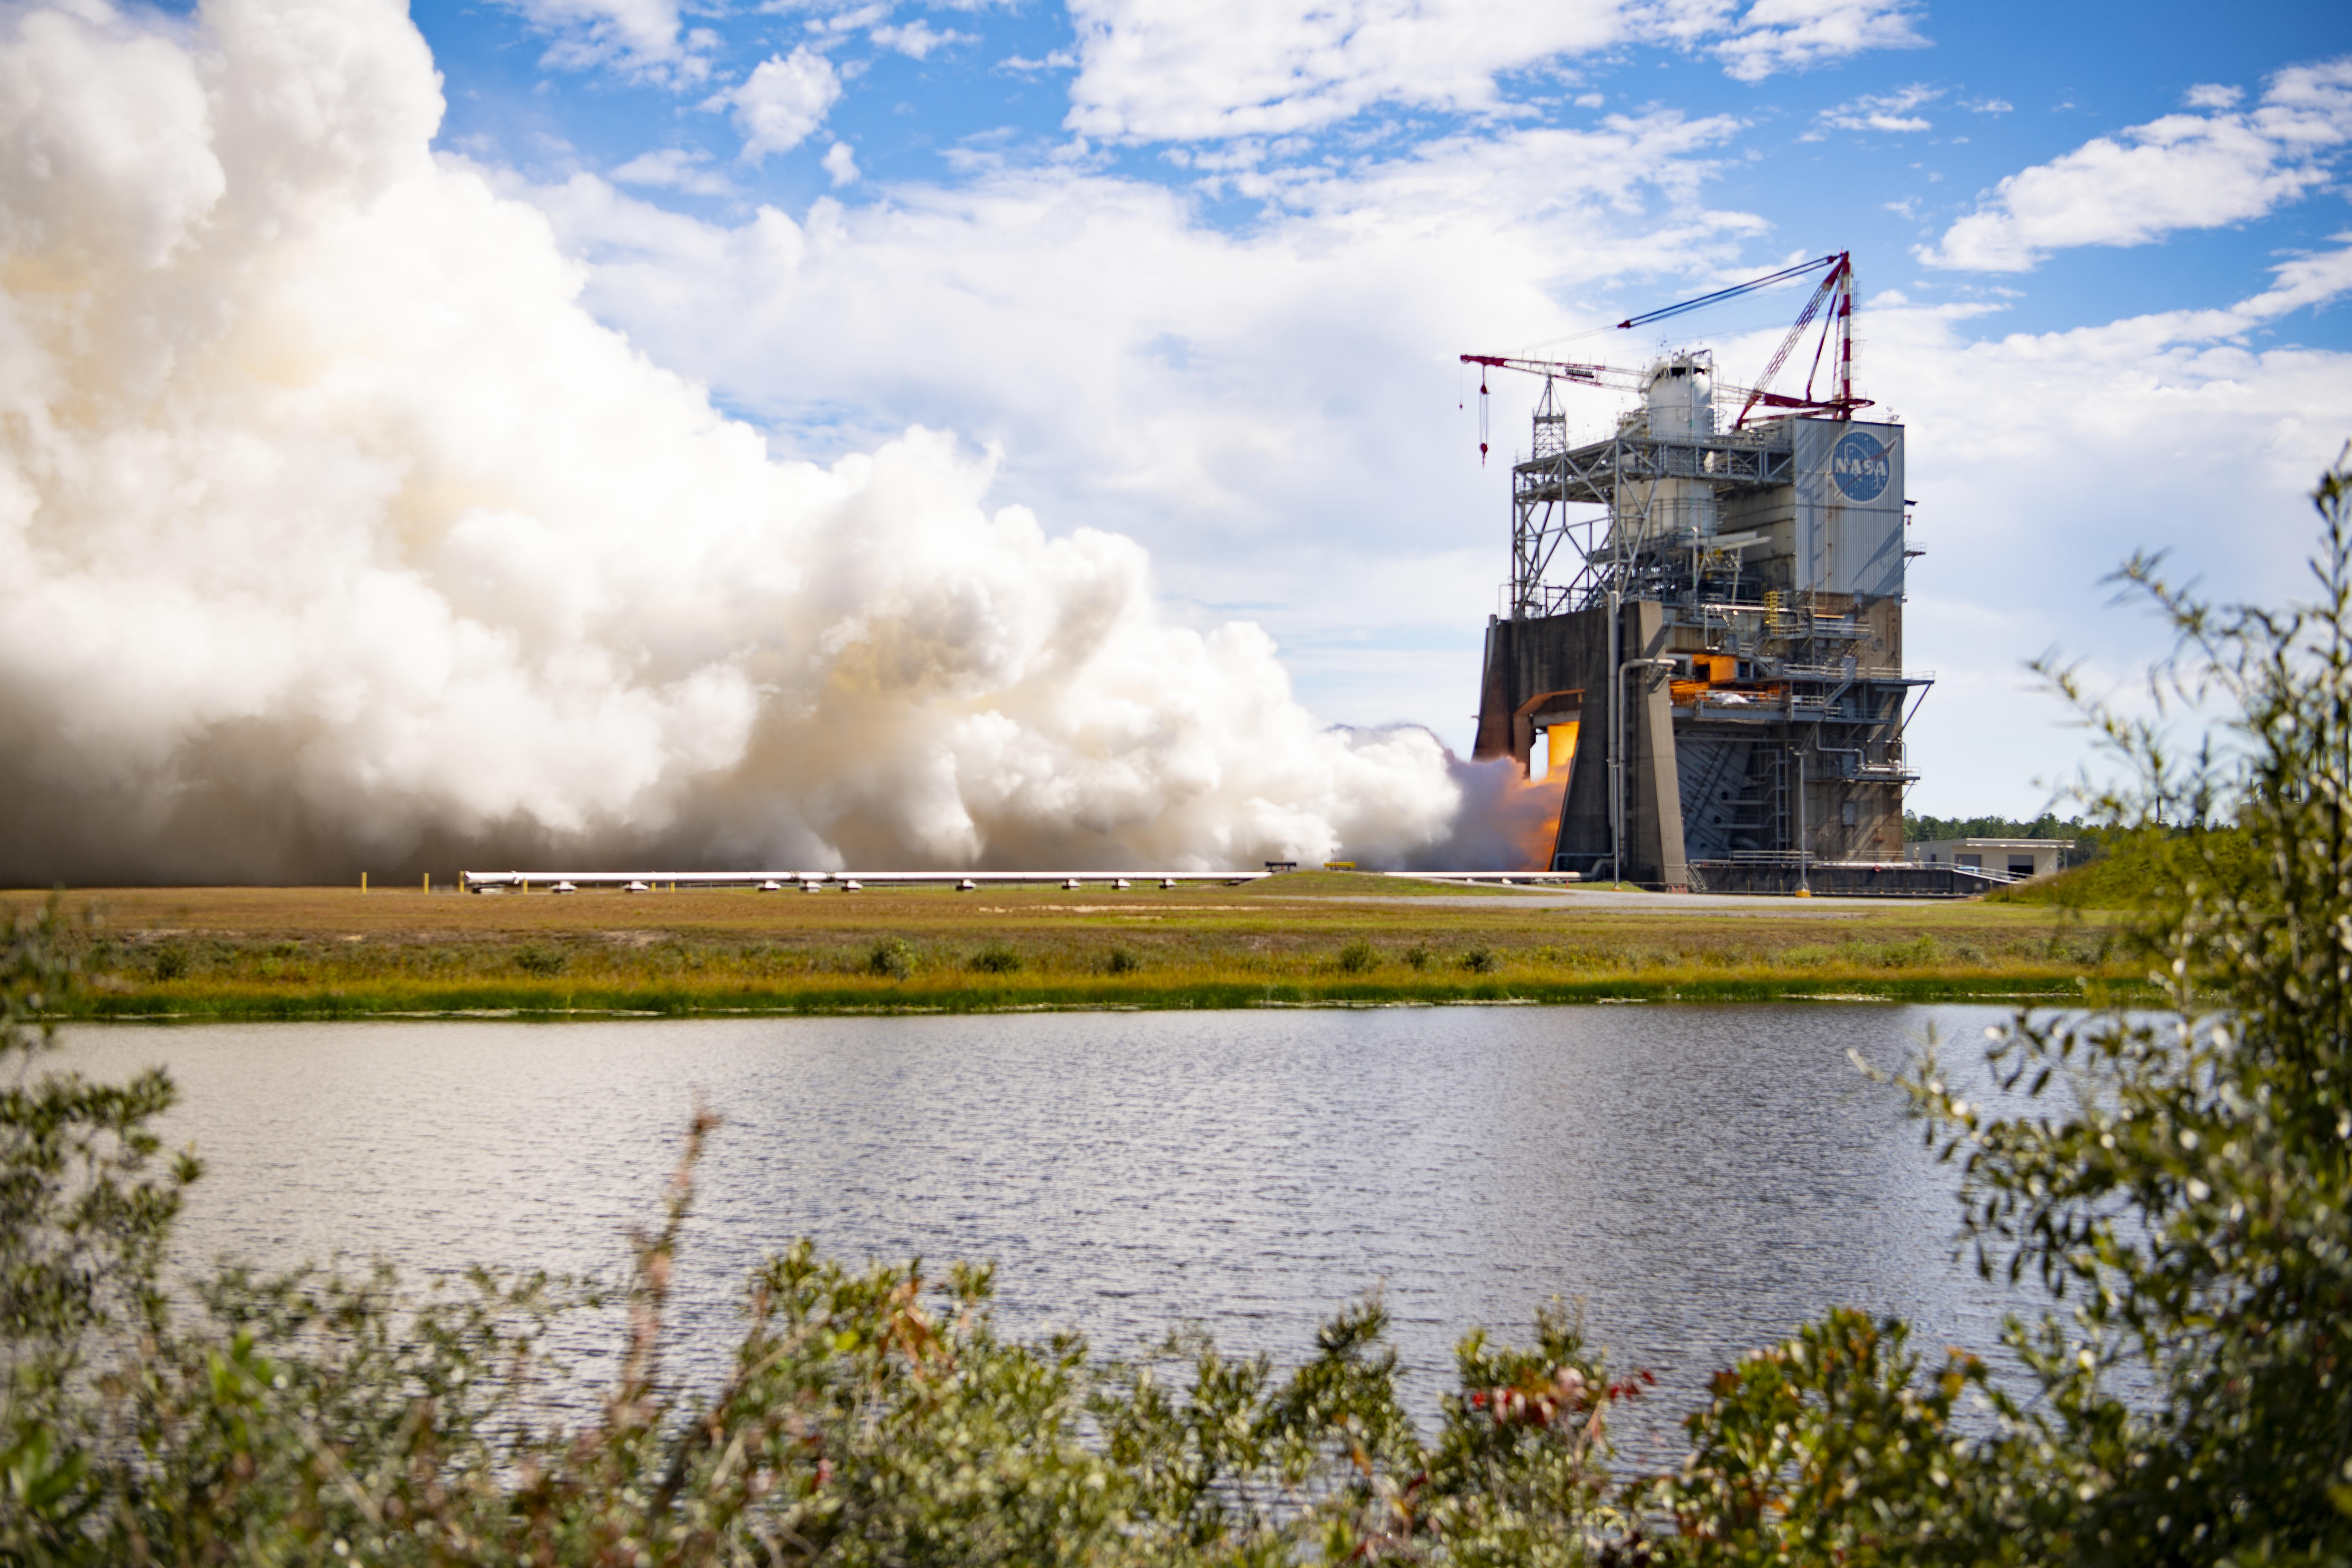
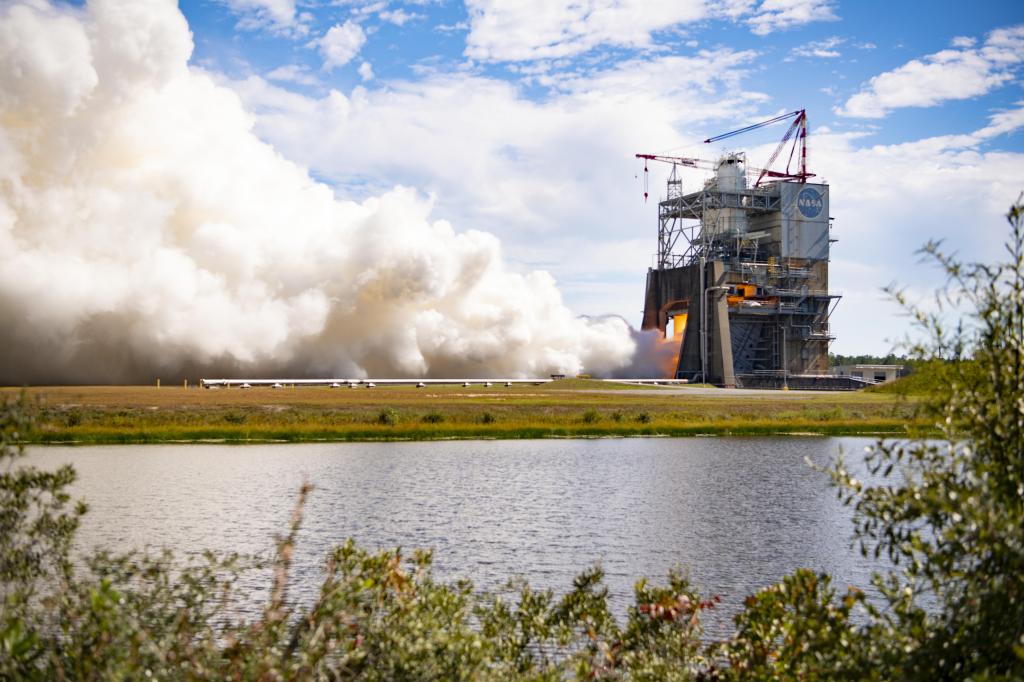
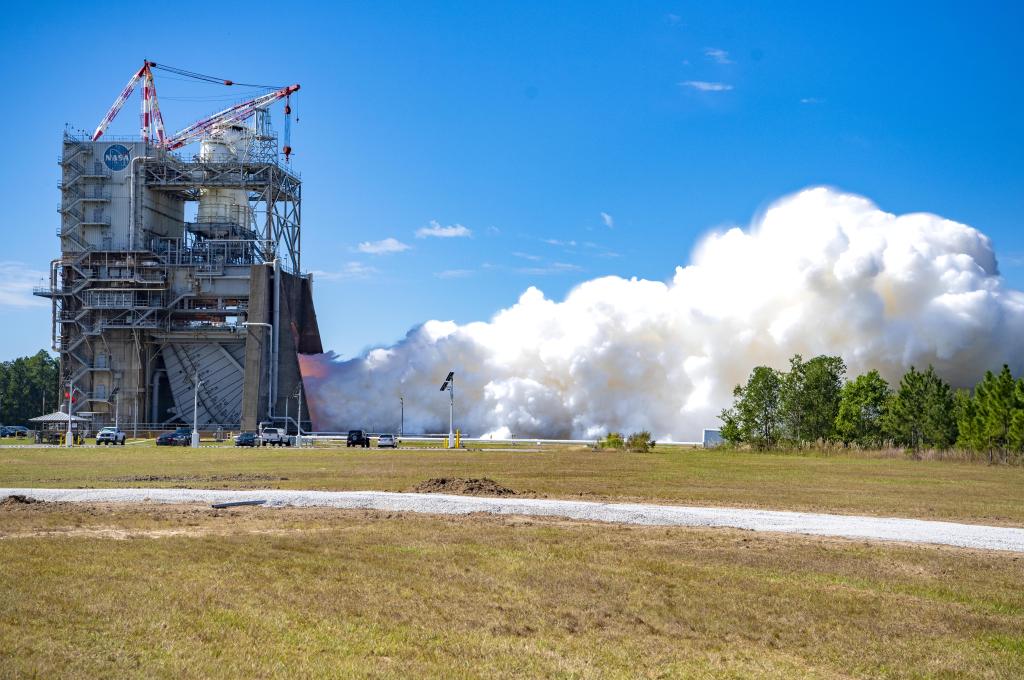
A massive cloud of white vapor billows out from a structure where an RS-25 engine is firing. The flames are just barely visible through the structure. In the foreground is a body of water.
NASA/Danny Nowlin

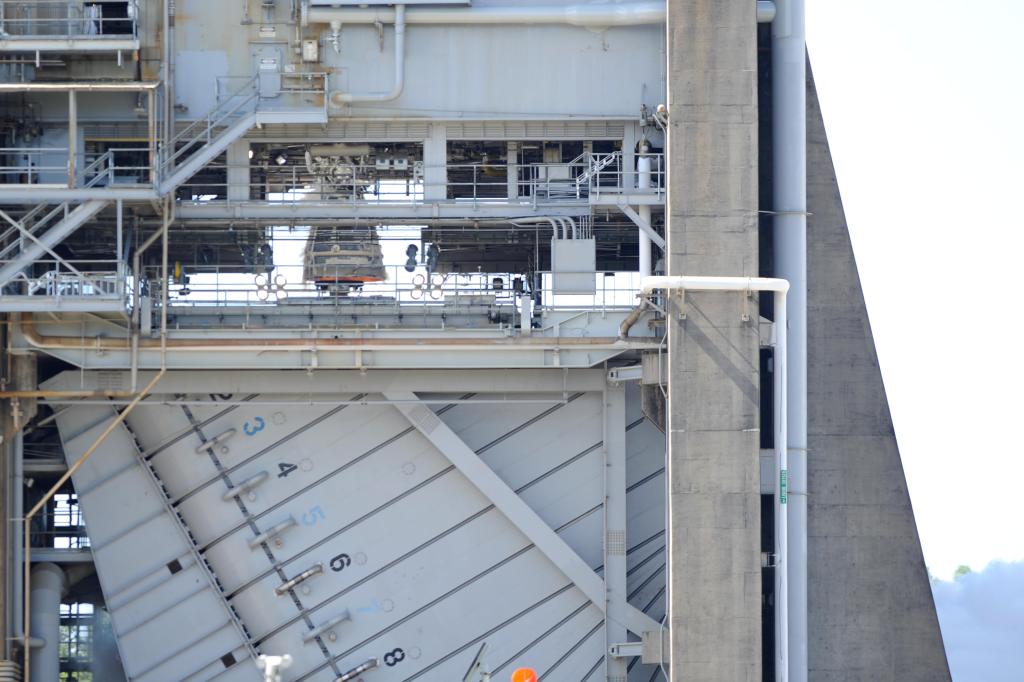
Teams at NASA’s Stennis Space Center near Bay St. Louis, Mississippi tested RS-25 engine No. 10001 on Oct. 21, 2026. The hot fire test lasted for almost eight-and-a-half minutes (500 seconds), the same amount of time RS-25 engines fire during launch of NASA’s SLS (Space Launch System) rocket, with a 111% power level. For each Artemis mission, four RS-25 engines produce up to 2 million pounds of combined thrust to help launch the SLS rocket.

Prior to use, all RS-25 engines are proven flightworthy at NASA Stennis. While this developmental engine will not be used in flight, the hot fire test provides NASA and NASA’s prime engine contractor L3Harris Technologies with the capability to capture critical data to improve engine performance and reliability.

Image credit: NASA/Danny Nowlin

Source: www.nasa.gov

NASA Conducts RS-25 Engine Test in Support of Future Artemis Missions

2 min read

Preparations for Next Moonwalk Simulations Underway (and Underwater)

NASA tested RS-25 engine No. 10001 on Oct. 21 on the Fred Haise Test Stand at NASA’s Stennis Space Center near Bay St. Louis, Mississippi.

Test teams fired the developmental engine for almost eight-and-a-half minutes (500 seconds), the same amount of time RS-25 engines fire during launch of NASA’s SLS (Space Launch System) rocket.

During the test, operators also fired the engine up to the 111% power level, matching the thrust needed for new production engines to launch the SLS rocket and the Orion spacecraft to orbit.

The main objectives of the test were to acceptance test RS-25 flight components for future Artemis missions and validate the new thermal protection system, which protects the RS-25 engine nozzle from the thermal environment surrounding SLS during launch.

While this developmental engine will not be used in flight, the hot fire test provides NASA and NASA’s prime contractor L3Harris Technologies with the capability to capture critical data to improve engine performance and reliability.

Four RS-25 engines produce up to 2 million pounds of combined thrust to help launch the SLS rocket for each Artemis mission.

All RS-25 engines are tested and proven flightworthy at NASA Stennis prior to use. Tests are conducted by a team of operators from NASA, L3Harris, and Nova Space Solutions.

Source: www.nasa.gov

Faster to Science: A Letter to the Science Community

Dear NASA Science Community, 

NASA Science wants to deliver science faster, so we’re changing how we compete and select missions. On Monday, October 26, we will host a virtual NASA Science Town Hall, from NASA Headquarters, to explain our new Competition Model 2.0 (CM 2.0), and answer your questions. (Details below.)

We have heard you. We have listened. We know that the burden of bringing great ideas forward has been too heavy for too long. It has taken years to move mission concepts through the current two-step process. This has often come with contract management challenges, unpredictability, and not enough funding.  NASA is committed to doing better — and I’m excited to share with you how we’re making it happen. 

I am so pleased that NASA Administrator Jared Isaacman has empowered the Science Mission Directorate to take action and make our mission selection process move more smoothly, efficiently, and effectively. The Administrator has directed us to accelerate the delivery of science, reduce the time and resources spent on long competitive processes, and focus funding on the highest-priority missions across every NASA Science division as quickly and affordably as possible. Predictability in delivering incredible science will be at the forefront of what we do. 

We are committed to getting this right. Some of these changes will take time to fully implement. We will roll them out in stages, be thoughtful about them, and refine them with your input along the way. But time is also of the essence. By streamlining how missions are proposed, reviewed, and selected, we can make meaningful change right now. That streamlined approach is Competition Model 2.0, or CM2.0, and it is how we are answering the Administrator’s call to get you to science faster. 

A Better Way to Compete

CM2.0 starts from a simple idea: compete on the science first. Proposals will be science-focused and will not require detailed engineering plans, cost, and implementation work until they are truly needed to make a decision. This frees you to spend more of your time doing science and less of it proposing how to do science. 

Here is how we will streamline mission selection across our mission classes: 

Flagships (directed missions):

CM2.0 will not change how we manage our largest missions since that process has already been reformed. After the James Webb Space Telescope, NASA conducted the Large Mission Study which drew lessons from Webb and best practices from our most successful flagships into a single, documented approach for building large missions more efficiently. Flagships will continue to follow that approach, with NASA directing the overall mission to a lead NASA Center and it will then compete the science teams and instruments through targeted solicitations. 

Astro-Probes, New Frontiers, and Discovery:

These missions will move to a new, accelerated two-step competition:

  • Step 1 asks for just three things: a compelling science case, a science implementation plan, and a proof-of-concept mission design. That removes roughly half of the material currently required in an Announcement of Opportunity (AO) response. This allows the initial selection to focus on what matters most, the science. It also opens the door wider, because a strong idea is judged on its merits rather than on the size of the team behind it. Principal Investigators (PI) without a major university or commercial backing will get a fair consideration, and NASA PIs at any NASA Center remain eligible to respond.
  • Step 2 is a Mission Implementation Study carried out with either NASA’s two Science Centers of Excellence, the Goddard Space Flight Center, or the Jet Propulsion Laboratory (JPL). NASA SMD may award an implementation study (under the management of GSFC) for New Frontiers or Discovery to JHU/APL depending on the science selected. The mission implementation study bridges pre-Phase A and Phase A by evaluating scientific merit, science implementation merit, and mission implementation merit to ensure that risks are surfaced early on rather than hidden. Down-selection to a single mission happens partway through Phase A, and the selected mission completes Phase A and then arrives at KDP-B with a matured mission implementation design. Teams that are not selected are freed from carrying concepts through the rest of Phase A on their own. 

These updates in the mission selection process will reduce time from AO to step 2 selection by up to 45 percent. This means that the original 35-months timeline will be reduced to about 19.5 months, all while having a stronger, more mature mission at the time of selection.  

MIDEX and Earth Explorer

These missions follow the same two-step approach with an even broader field of implementing organizations, including universities and industry partners. Implementing organizations and partners will be evaluated on past performance on projects of similar complexity and cost prior to mission selection. PI-led teams can request pairing with either a Goddard or JPL implementation team at Step 1 selection, and NASA can provide Center support where it will help with procurement, contract management, or quick resolution of technical challenges. This will result again in an up to a 45 percent reduction in the selection timeline. 

SMEX, Missions of Opportunity, Earth Venture, Hosted Payloads, and Ride Shares

These missions will move to a single-step competition with a smaller review team and virtual site visits. They will also be open to a broad range of implementing organizations. The time to final selection will drop from about 32 months to about 19 months which is a reduction of up to 40 percent. Our smallest missions will be riding the momentum of a maturing commercial space economy and will move even faster. This means more missions, more often, with more incredible science at a lower cost.  

The Principles Guiding Us

Commercial Capabilities for Every Mission Type

The commercial space industry has never been stronger—and it’s only gaining momentum. Mission and implementation teams will be expected to adopt industry best practices and emerging commercial capabilities, including commercial buses, subsystems, and multi-mission operations — wherever they offer a technical or cost benefit. No mission class is too large or too complex to benefit from the commercial industry. We will keep assessing the commercial landscape at regular intervals, building on our recent Science as a Service Request for Information. 

Science Merit Opens the Door

By competing on science first, established teams and first-time teams stand on equal footing. The best idea wins. 

Cost and Schedule Discipline

Great science deserves great stewardship. Rigorous cost and schedule control remains mandatory across every mission class. Phase A estimates will inform complexity and scope trades. Therefore, breaches of control thresholds will carry real consequences of up to, and including, mission termination. That discipline is how we keep the pipeline flowing for everyone. 

NASA Centers Strengthen Missions

Our NASA Centers lead the world in spaceflight experience. Therefore, by appropriately directing work at Goddard and JPL, we will save taxpayer dollars, eliminate unnecessary competition among NASA Centers, encourage collaboration, and keep critical skills thriving across the agency. 

This is a moment of real opportunity. We have an administrator who is empowering us to move faster and a commercial market that is ready to help. We have NASA Centers with unmatched expertise, and a science community whose ideas expand and redefine the bounds of human achievement in the cosmos. CM2.0 brings those strengths together so that more great ideas become great missions, all while being faster and returning more science at an affordable price for the benefit of all. 

NASA leads the world in discovery and innovation, but none of that happens on its own. It happens because of you. You are the reason the list of what’s “impossible” keeps getting shorter. I am so proud of what this community has achieved, and what incredible science we will continue to discover together 

Thank you for your brilliance, your dedication, and your partnership. The best of NASA Science is still ahead of us, and I cannot wait to see where this journey takes us. 

With gratitude and excitement, 

Nicola Fox, associate administrator, Science Mission Directorate, NASA Headquarters 

NASA Science Leadership to Hold Town Hall Meeting 

NASA will host a community town hall from 2 to 3 p.m. EDT Monday, Oct. 26, featuring Dr. Nicola “Nicky” Fox, associate administrator for the agency’s Science Mission Directorate, and other NASA science leaders. Fox will provide an overview of NASA’s new Competition Model 2.0 (CM 2.0), followed by an opportunity for participants to ask questions. 

Members of the science community, academia, media, and the public are invited to join the virtual town hall at: 

https://events.gcc.teams.microsoft.com/event/7d9bba42-46cc-4f09-8fb5-95b57c88cf1f@7005d458-45be-48ae-8140-d43da96dd17b?source=copyLinkLegacyShareEventDialog

Participants may submit questions and vote on questions submitted by others at: 

https://nasa.cnf.io/sessions/eawk

Questions will be screened for spam and inappropriate content before appearing publicly. NASA science leaders will address as many questions as time allows. 

A recording of the town hall will be posted online following the event. 

Source: science.nasa.gov
Fires Char New Guinea

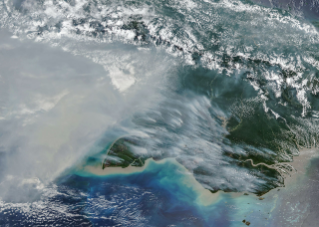
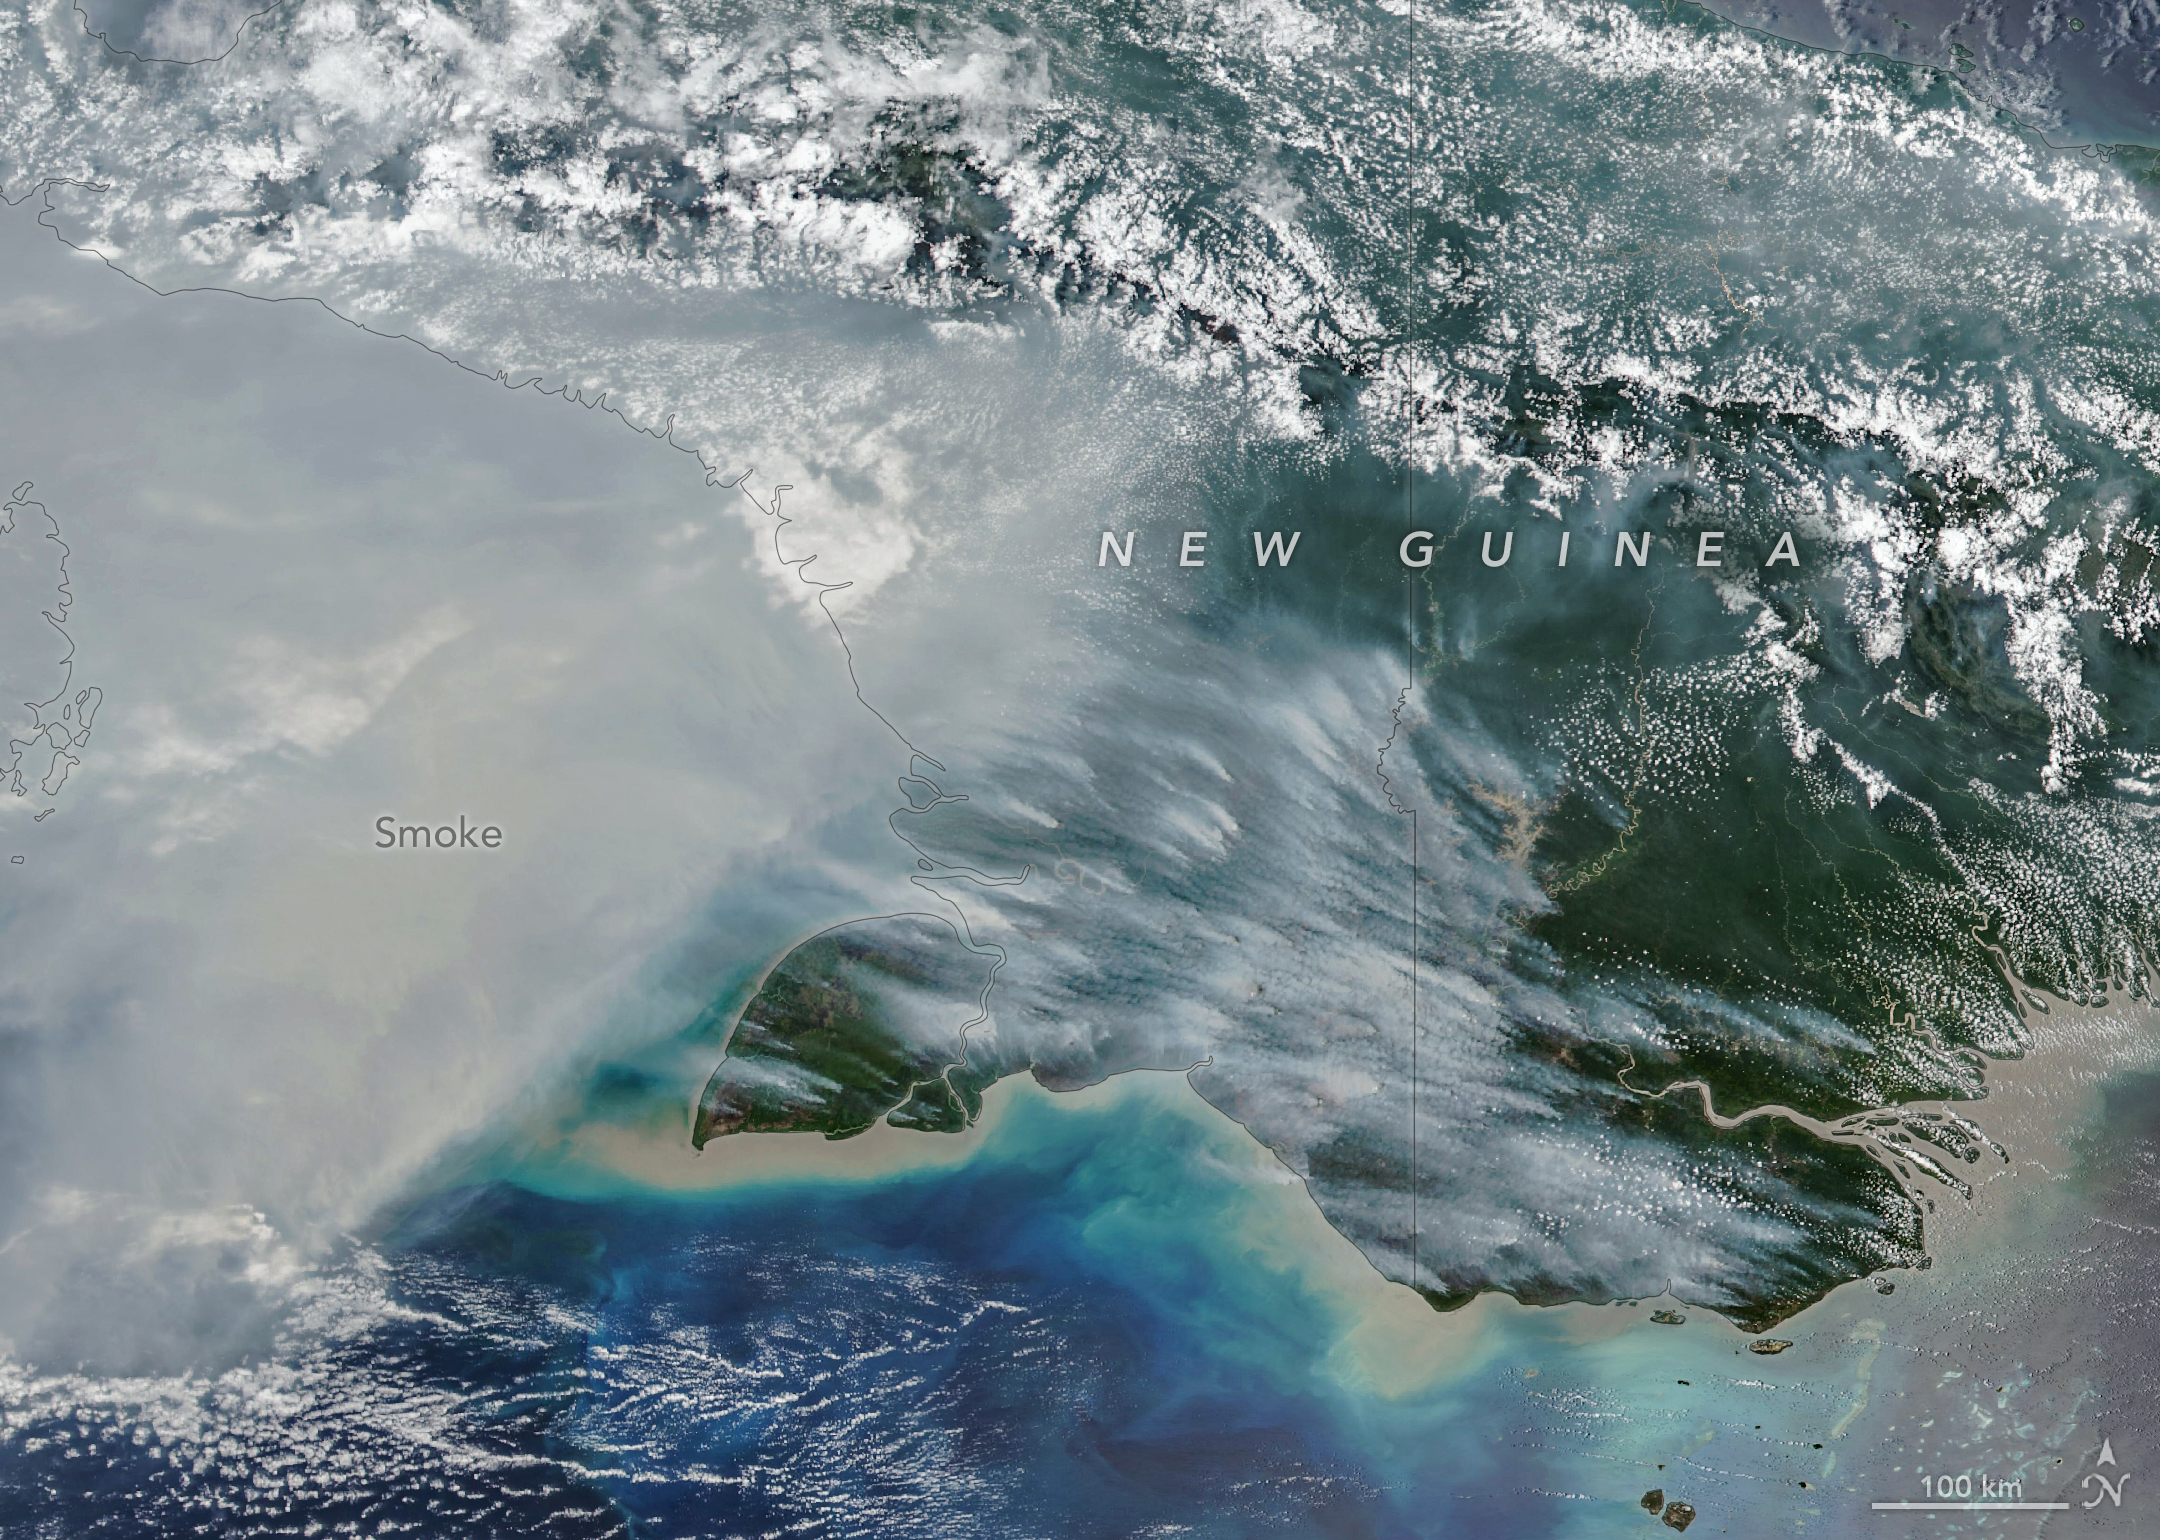
Smoke covers much of the southern third of New Guinea, while clouds and east-west-running mountain ranges are visible in the northern part of the island.

New Guinea, the world’s second-largest island, harbors an extraordinary variety of plant life across more than a dozen distinct ecoregions, including seasonally dry savannas, tropical rainforests, and lowland swamp forests. But in September and October 2026, as drought gripped New Guinea (sometimes called Papua) amid a strong El Niño, fires scorched the island and smoke shrouded large swaths of it for weeks.

The VIIRS (Visible Infrared Imaging Radiometer Suite) on the NOAA-20 satellite captured this image of thick smoke streaming from the southern part of the island on October 11, 2026. In recent weeks, soaring levels of air pollution delayed and canceled flights, closed schools, and prompted officials in some areas to urge children and older people to wear masks.

“Sometimes smoke that has drifted into the convection of nearby thunderstorms will get washed out or lofted up into the upper troposphere, but a lot of smoke stays near the surface and causes air quality problems,” said Robert Field, an associate research scientist at NASA’s Goddard Institute for Space Studies and Columbia University. “It’s a horrible situation.” 

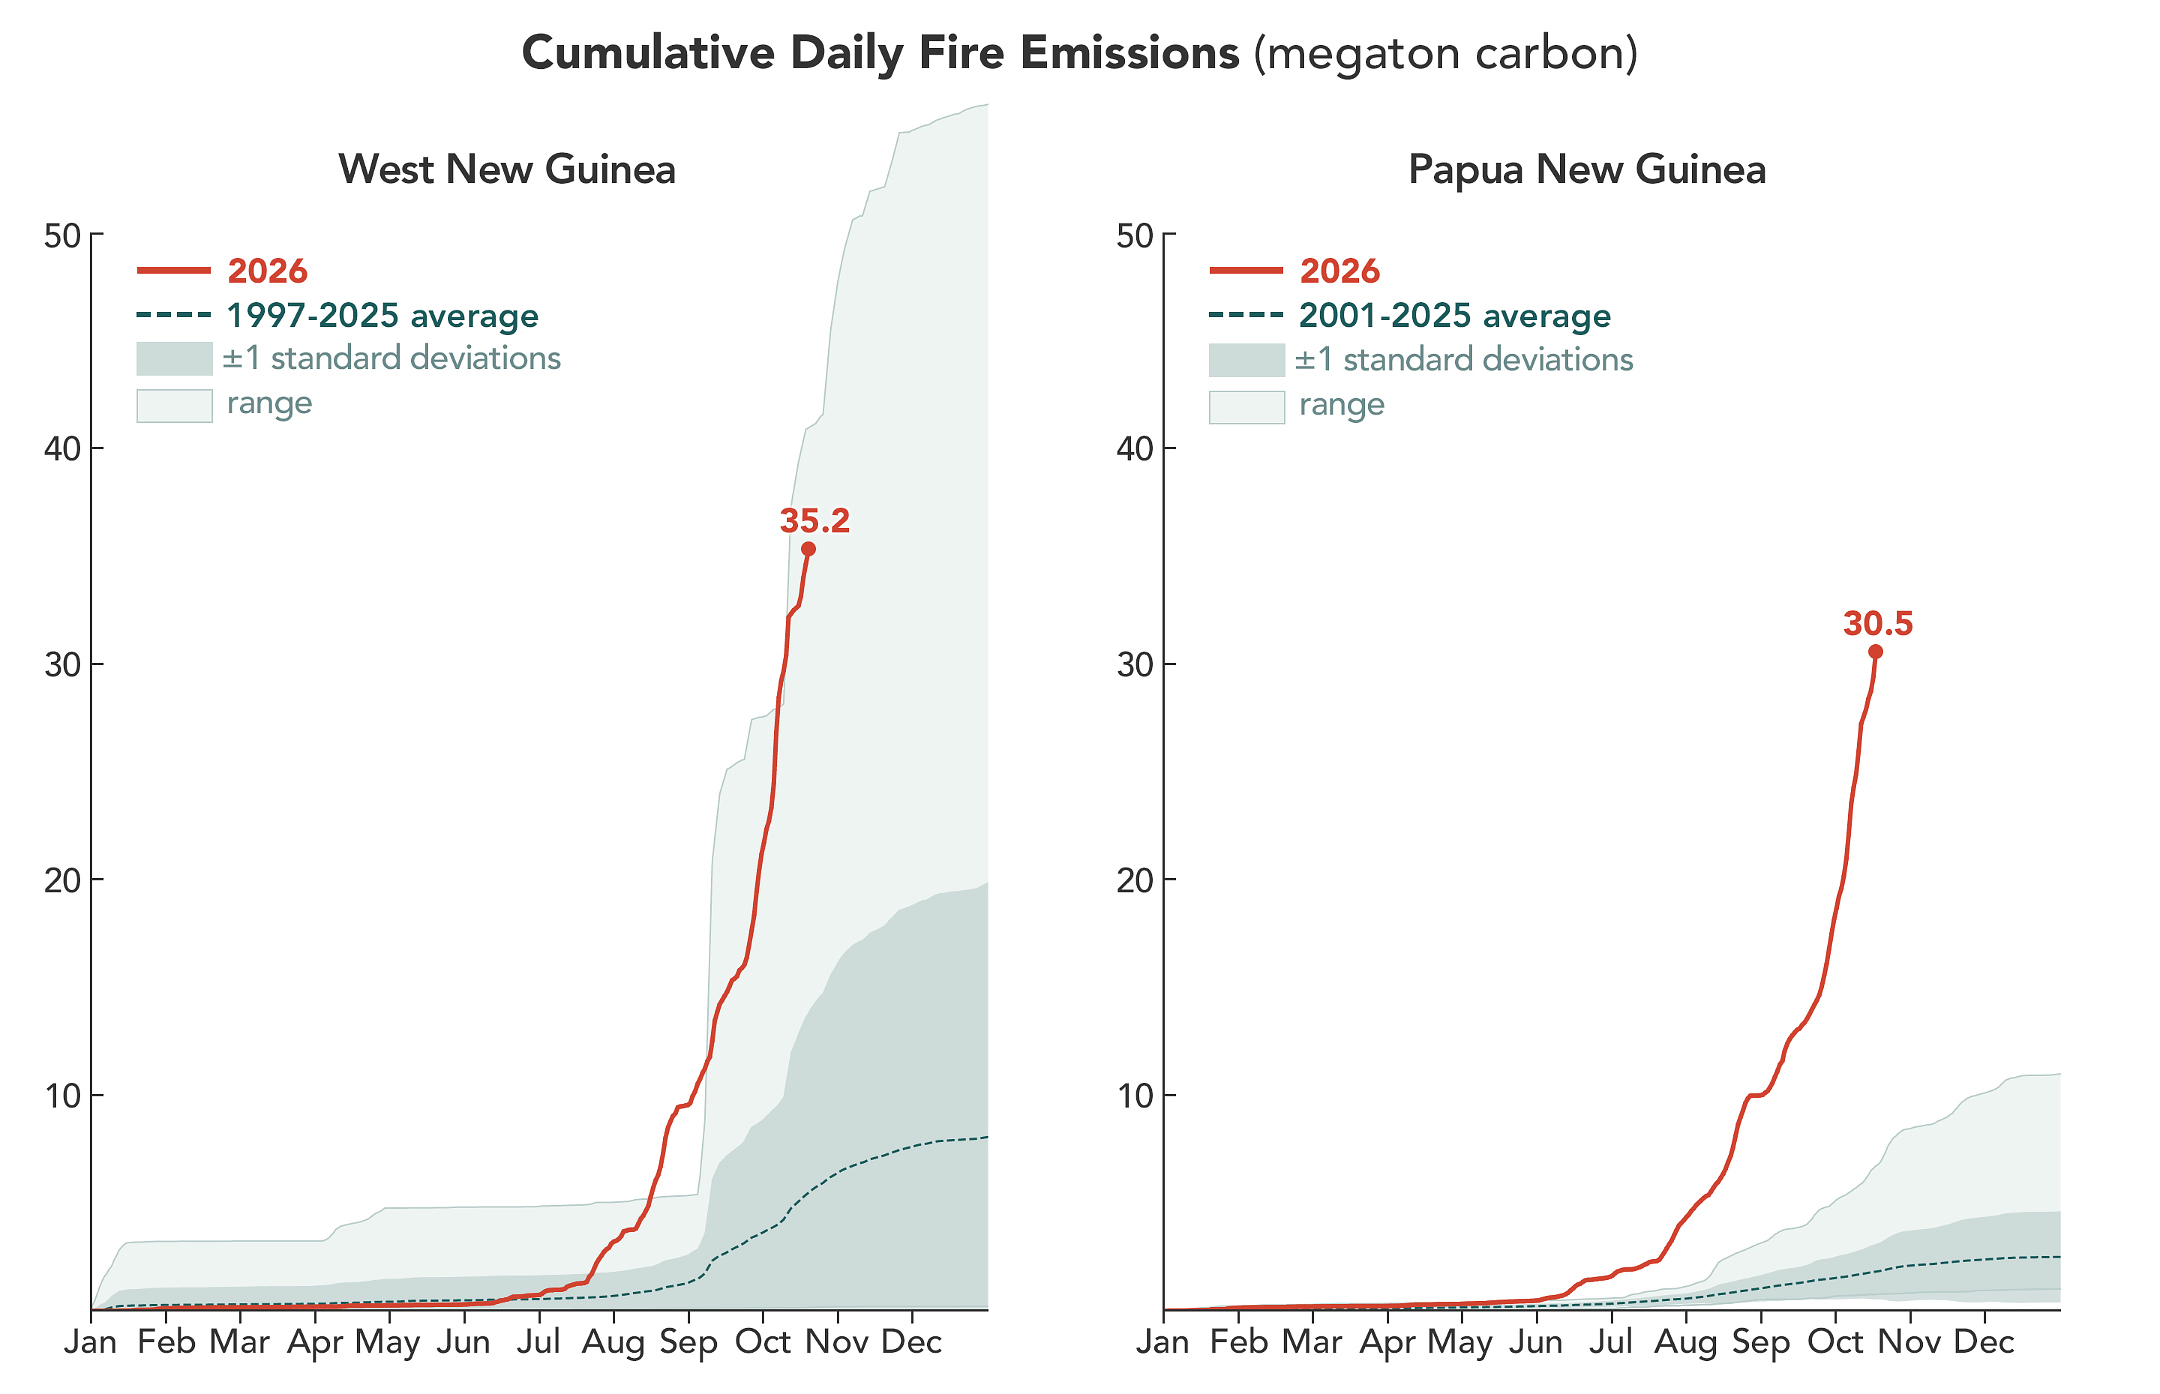
A line chart shows that fires on the Indonesian side of the island have generated more carbon emissions, and at a faster rate, than usual in 2026. By October 17, fires had generated 35.2 megatons of carbon. A line chart shows that carbon emissions from fires in Papua New Guinea rose earlier than usual in 2026, reaching 30.5 megatons of carbon by October 17.

According to the Global Fire Emissions Database (GFED), a fire emissions monitoring system, fires in Papua New Guinea, on the eastern half of the island, had released nearly 32 megatons of carbon by October 17, more than any other year on record at that point in the year (charts above). “Emissions are already much higher than the 2015 total for the year, and it’s very likely that this will become the highest year on record for Papua New Guinea, even surpassing 1997,” said Guido van der Werf, a fire scientist at Wageningen University & Research.

On the Indonesian side, sometimes called West New Guinea or Indonesian Papua, carbon emissions exceeded 35 megatons, the third highest after 2015 and 1997, other El Niño years with severe fires. Van der Werf led the development of GFED, a satellite-driven modeling framework that uses a mix of remote sensing, vegetation characteristics, and other information to estimate the extent of vegetation fires and the emissions over nearly three decades.

Unusually dry weather—a byproduct of El Niño shifting rainfall patterns—has primed ecosystems across the island to burn. The southernmost part of Papua New Guinea, dominated by relatively fire-prone savannas and grasslands of the Trans-Fly region, went more than 90 consecutive days without rain, according to Papua New Guinea’s National Weather Service. Since August, parts of the region have seen precipitation of roughly 5 to 10 percent of normal, according to the weather service’s data. Local news outlets report that drought is causing crop failures, water shortages, and school disruptions.

In this normally wet part of the world, people ignite the vast majority of fires, researchers say. Crop fires, pasture maintenance, deforestation and land clearing, and hunting are all common reasons people burn in New Guinea. In dry conditions, managed fires sometimes spread and burn uncontrolled as wildfires, particularly in the drier, southernmost parts of the island. 

“We’re seeing an exceptionally high level of fire activity in Papua New Guinea and Eastern Indonesia, particularly Indonesian Papua and Kalimantan, this year compared with Sumatra and other parts of Western Indonesia,” said Yang Chen, an associate researcher at the University of California, Irvine. “Papua has emerged as Indonesia’s new deforestation frontier.”

Over the past two decades, land in Indonesian Papua has been cleared for industrial oil palm and pulpwood plantations, shifting small-scale cultivation, urban expansion, and mining. According to Global Forest Watch, the region lost 27,000 hectares of primary forest in 2025, nearly double the 2024 total and the most since 2017.

Sumatra’s fires are relatively low compared to other drought years partly because many areas are already developed. “Areas with large oil palm, sugarcane, or pulpwood plantations also often have their own private fire brigades to protect their assets,” said Field. “It’s in unmanaged areas or primary forest edges where we’re generally seeing the most fire.”

Researchers expect the fires to continue until the heavy rains of the wet season arrive in the southern part of New Guinea, typically in early November.

NASA Earth Observatory image and charts by Michala Garrison, using data from NASA EOSDIS LANCE, GIBS/Worldview, Joint Polar Satellite System (JPSS), and the Global Fire Emissions Database (GFED). Story by Adam Voiland.

References & Resources

You may also be interested in:

Stay up-to-date with the latest content from NASA as we explore the universe and discover more about our home planet.

Fires Arrive in the Amazon Rainforest

6 min read

During El Niño, a cascade of fires across the tropics begins in equatorial Asia and continues in the central and…

Article

Peatland Fires Darken Skies in Indonesia

6 min read

With Indonesia gripped by drought, fires are smoldering on the surface and underground.

Article

Smoke Streams Across Eastern Washington

3 min read

Wildland fires in early August 2026 pushed air quality to unhealthy levels, destroyed hundreds of structures, and triggered mandatory evacuations…

Article

Source: science.nasa.gov
APOD: 2026 October 22 – The First Green Star, WD J1330+6435

APOD

Astronomy Picture of the Day

Discover the cosmos! Each day a different image or photograph of our fascinating universe is featured, along with a brief explanation written by a professional astronomer.

A star shines with a greenish hue in front of a dark field with more distant stars, surrounded by a greenish disk with debris.

The First Green Star, WD J1330+6435

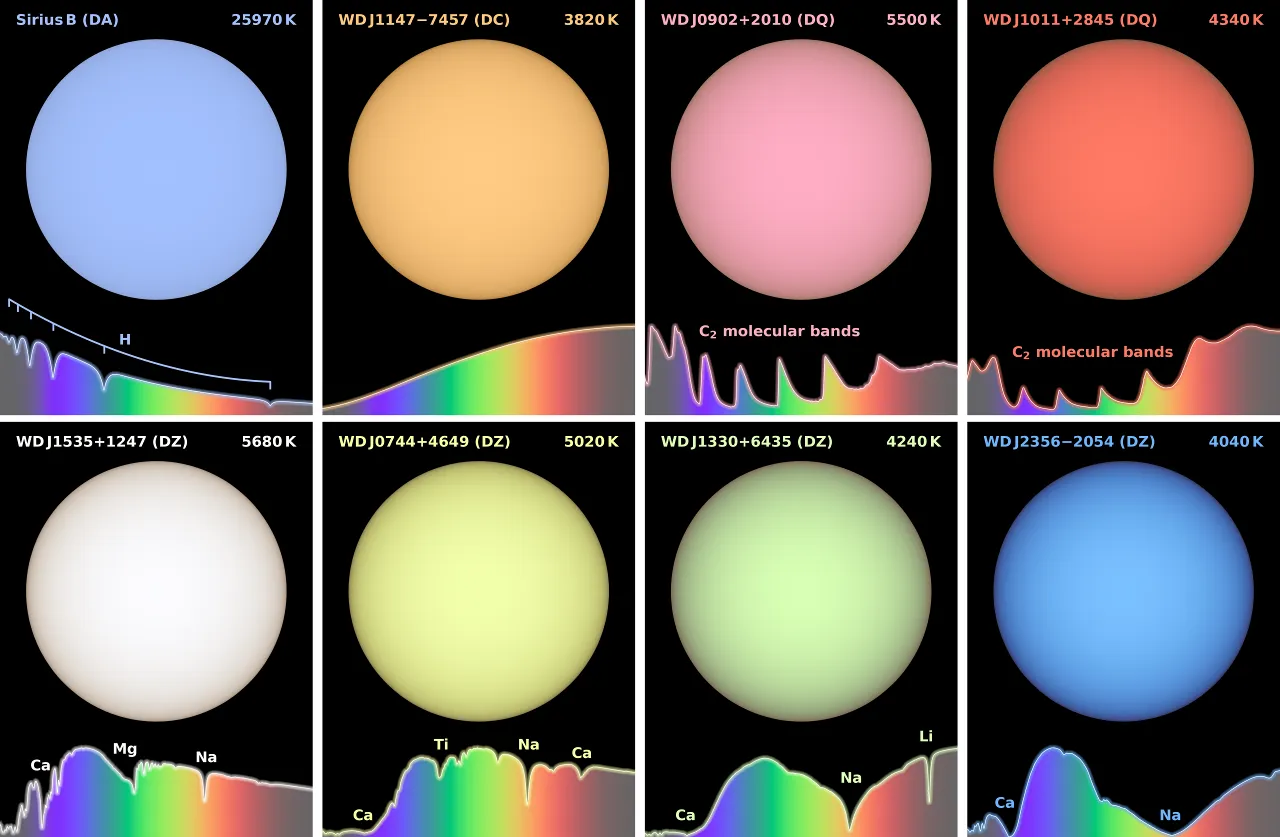
Explanation: Star light, star bright: is there a green star out tonight? Other than the Sun, all stars are so far from Earth that they appear as points in the sky. They are mostly white, but sometimes noticeably red or blue. This color typically relates to the temperature: blue stars are hotter than red stars. What about other colors? The featured image is an illustration showing WD J1330+6435, a white dwarf star, surrounded by an accretion disk with gas and rocks orbiting the star. White dwarfs are small, faint stars that are left over when a star like the Sun exhausts its nuclear fuel. Astronomers recently found that some white dwarf stars, despite their name, would appear yellow, green, cyan, pink, or purple. In these cases, trace elements that were accreted to these stars interact with the stellar atmosphere and shift its normally white color. But, alas! I wish I may, I wish I might, but they are too faint to see tonight…

Tomorrow’s picture: eye in the sky

Date October 22, 2026
Credit & Copyright Mark A. Garlick/University of Warwick
Authors & editors: Cecilia Chirenti, Robert Nemiroff, Jerry Bonnell, Keighley Rockcliffe
A service of: ASD at NASA / GSFC,
NASA Science Activation & Michigan Tech. U.

Source: science.nasa.gov
NASA’s Hubble Charts Path for Roman with Gravitational Lenses 

4 min read

NASA’s Hubble Charts Path for Roman with Gravitational Lenses 

A spiral galaxy with two distinct arms forming a backwards
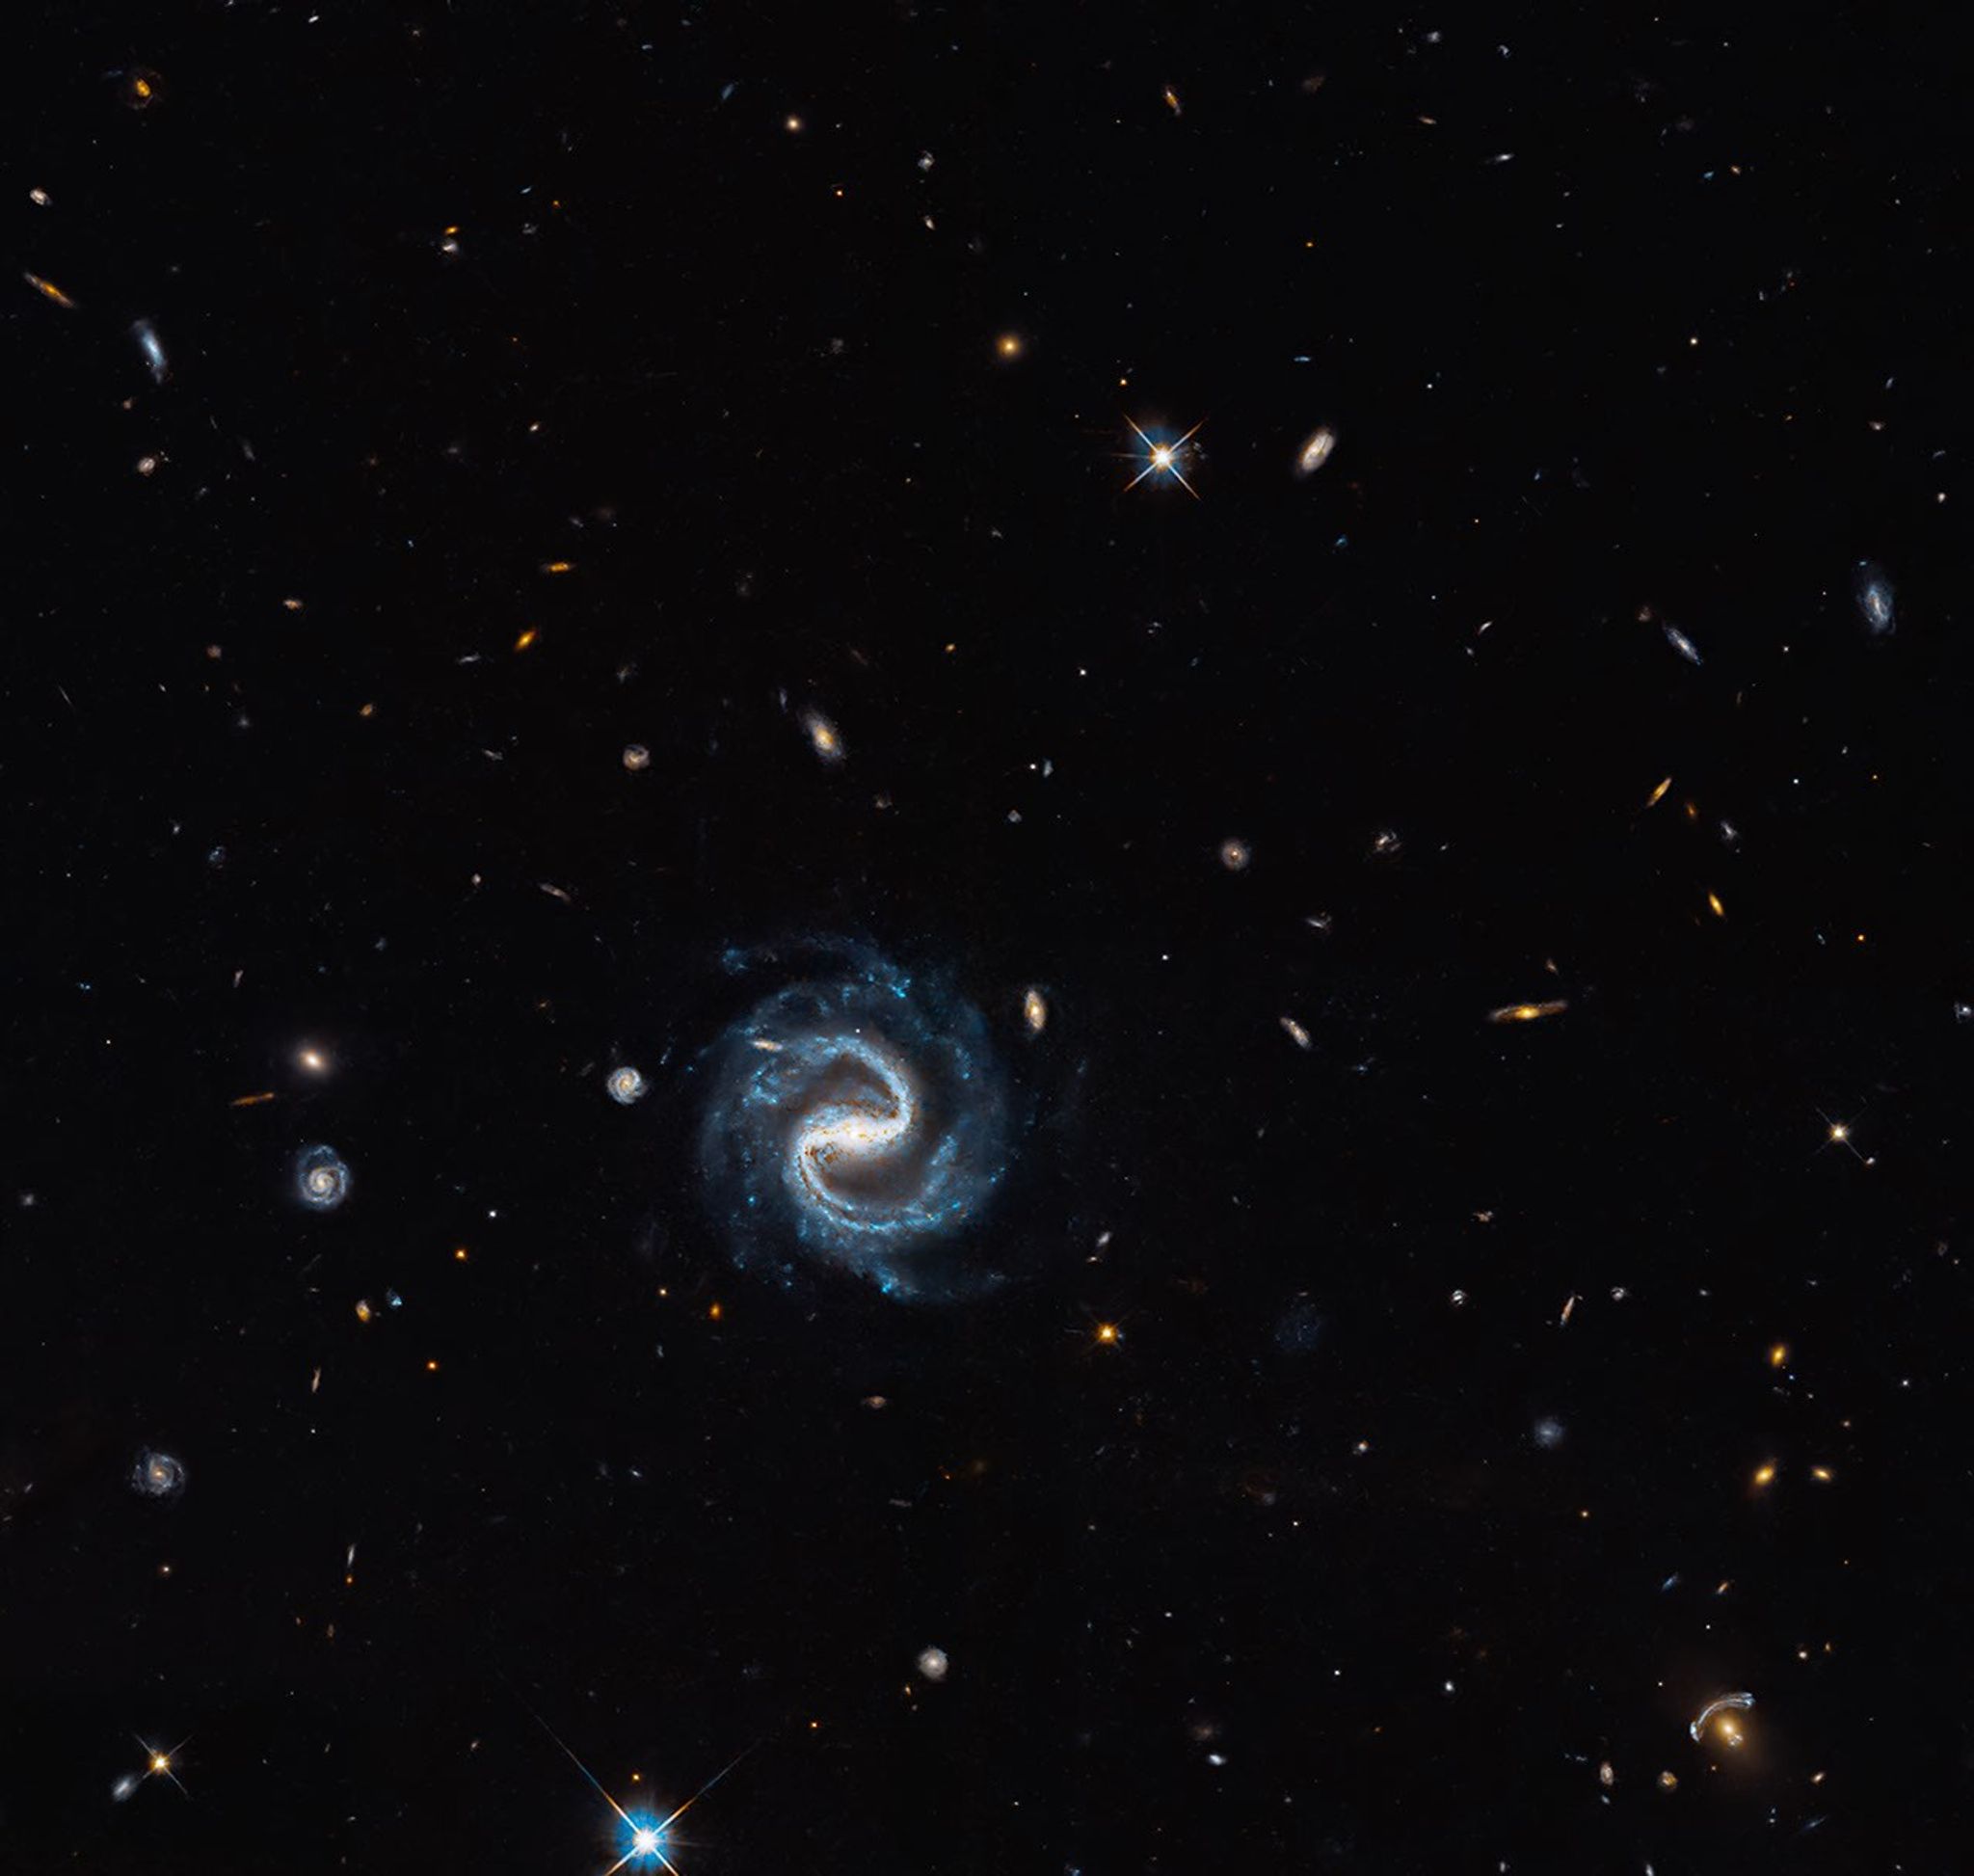
A sinuous spiral galaxy (center) appears in the same field of view as a vivid gravitational lens (right corner) in this Hubble image. The lens consists of a reddish elliptical foreground galaxy and the blue arcs of a magnified background galaxy.
NASA, ESA, and X. Huang (University of San Francisco); Processing: Gladys Kober (NASA/Catholic University of America)

A sweeping barred spiral galaxy marks the spot in this image, but the real treasure is the gravitational lens in the lower-right corner, where a distant background galaxy is being magnified and distorted by the gravity of a closer galaxy.

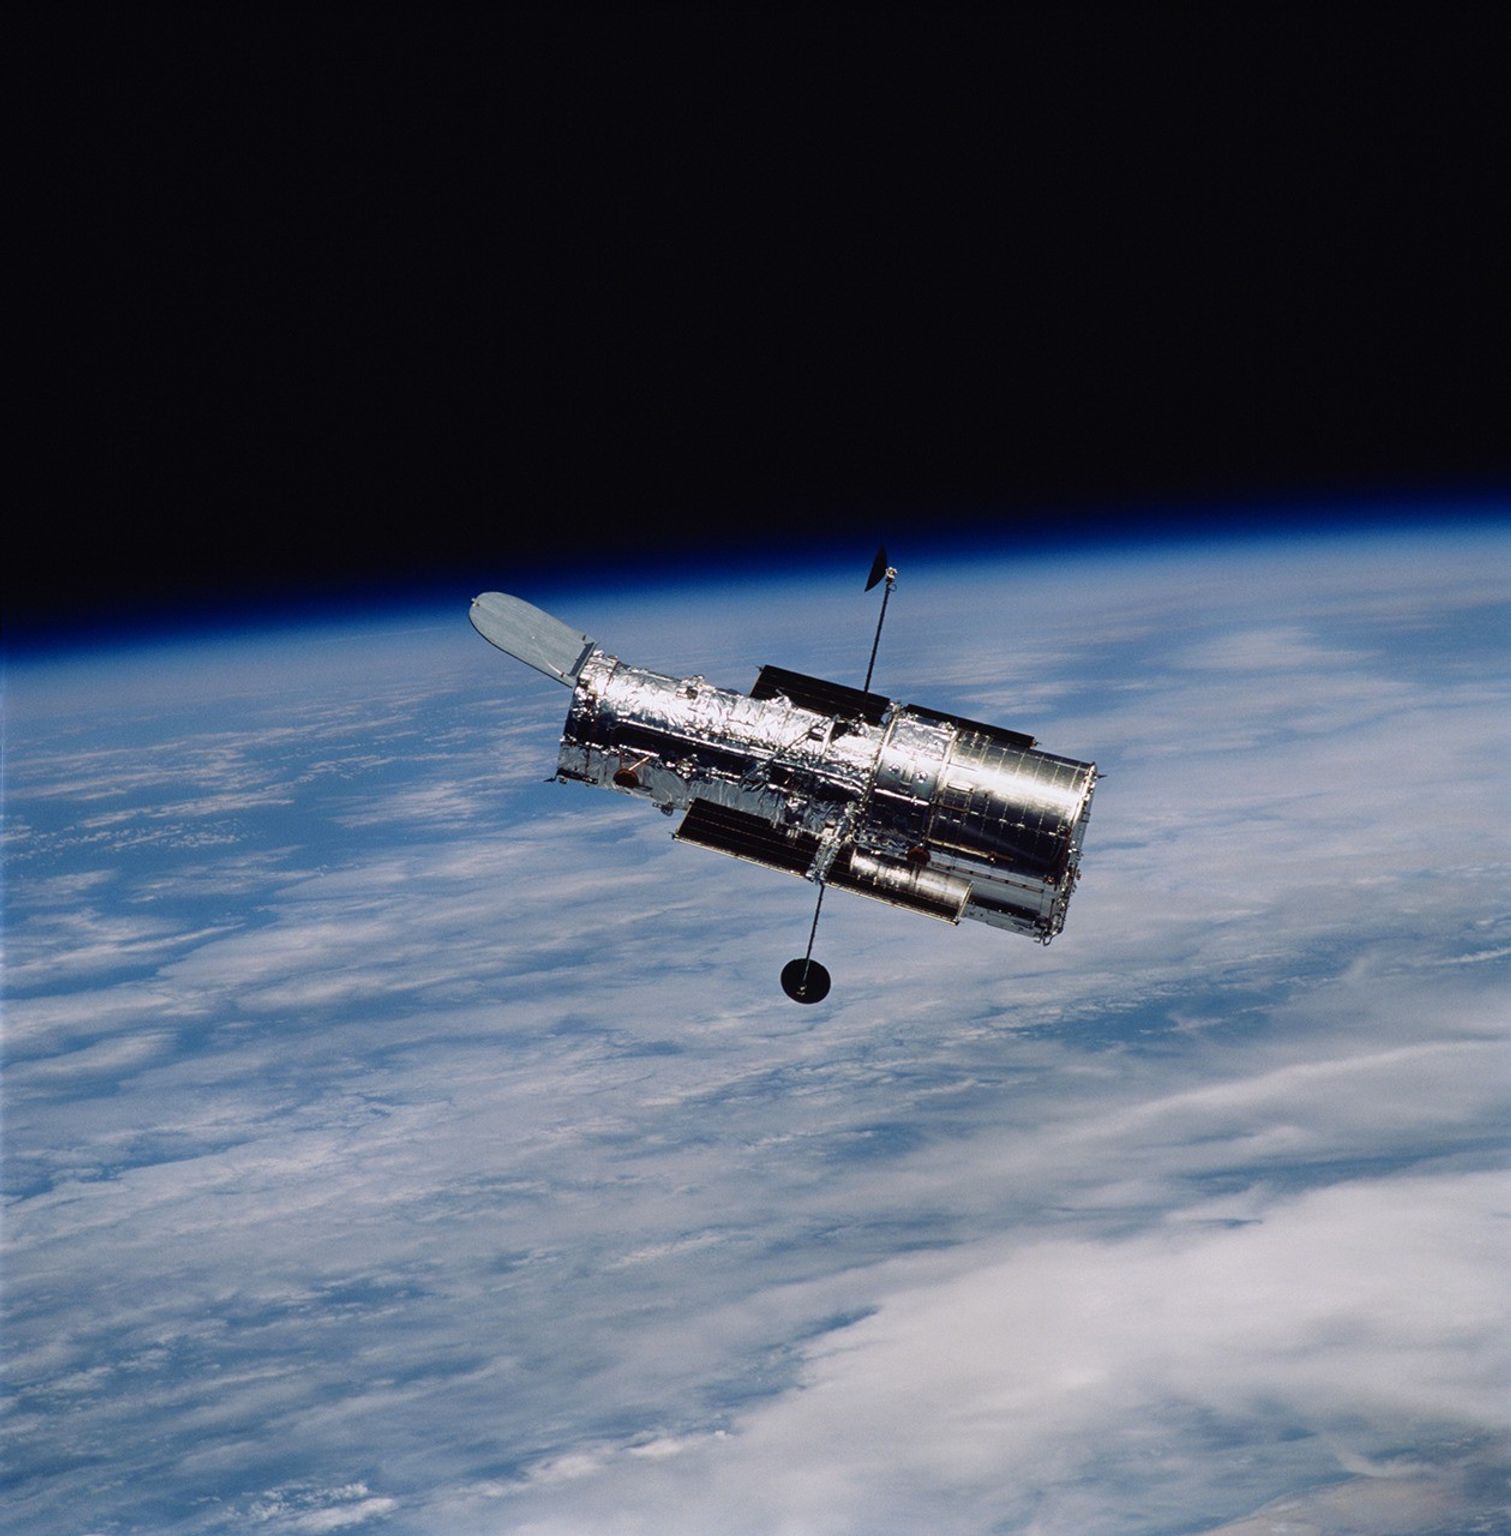
This observation is one of many gravitational lensing images taken by NASA’s Hubble Space Telescope in preparation for science with the new Nancy Grace Roman Space Telescope.

Gravitational lensing occurs when the mass of a foreground object – such as a galaxy – warps spacetime, causing light to bend, distort, and magnify as it passes around the object, similar to a giant lens in space. Lenses like this occur when a precise chance alignment takes place between the foreground and background galaxies, causing light from the background galaxy to curve around the foreground galaxy.

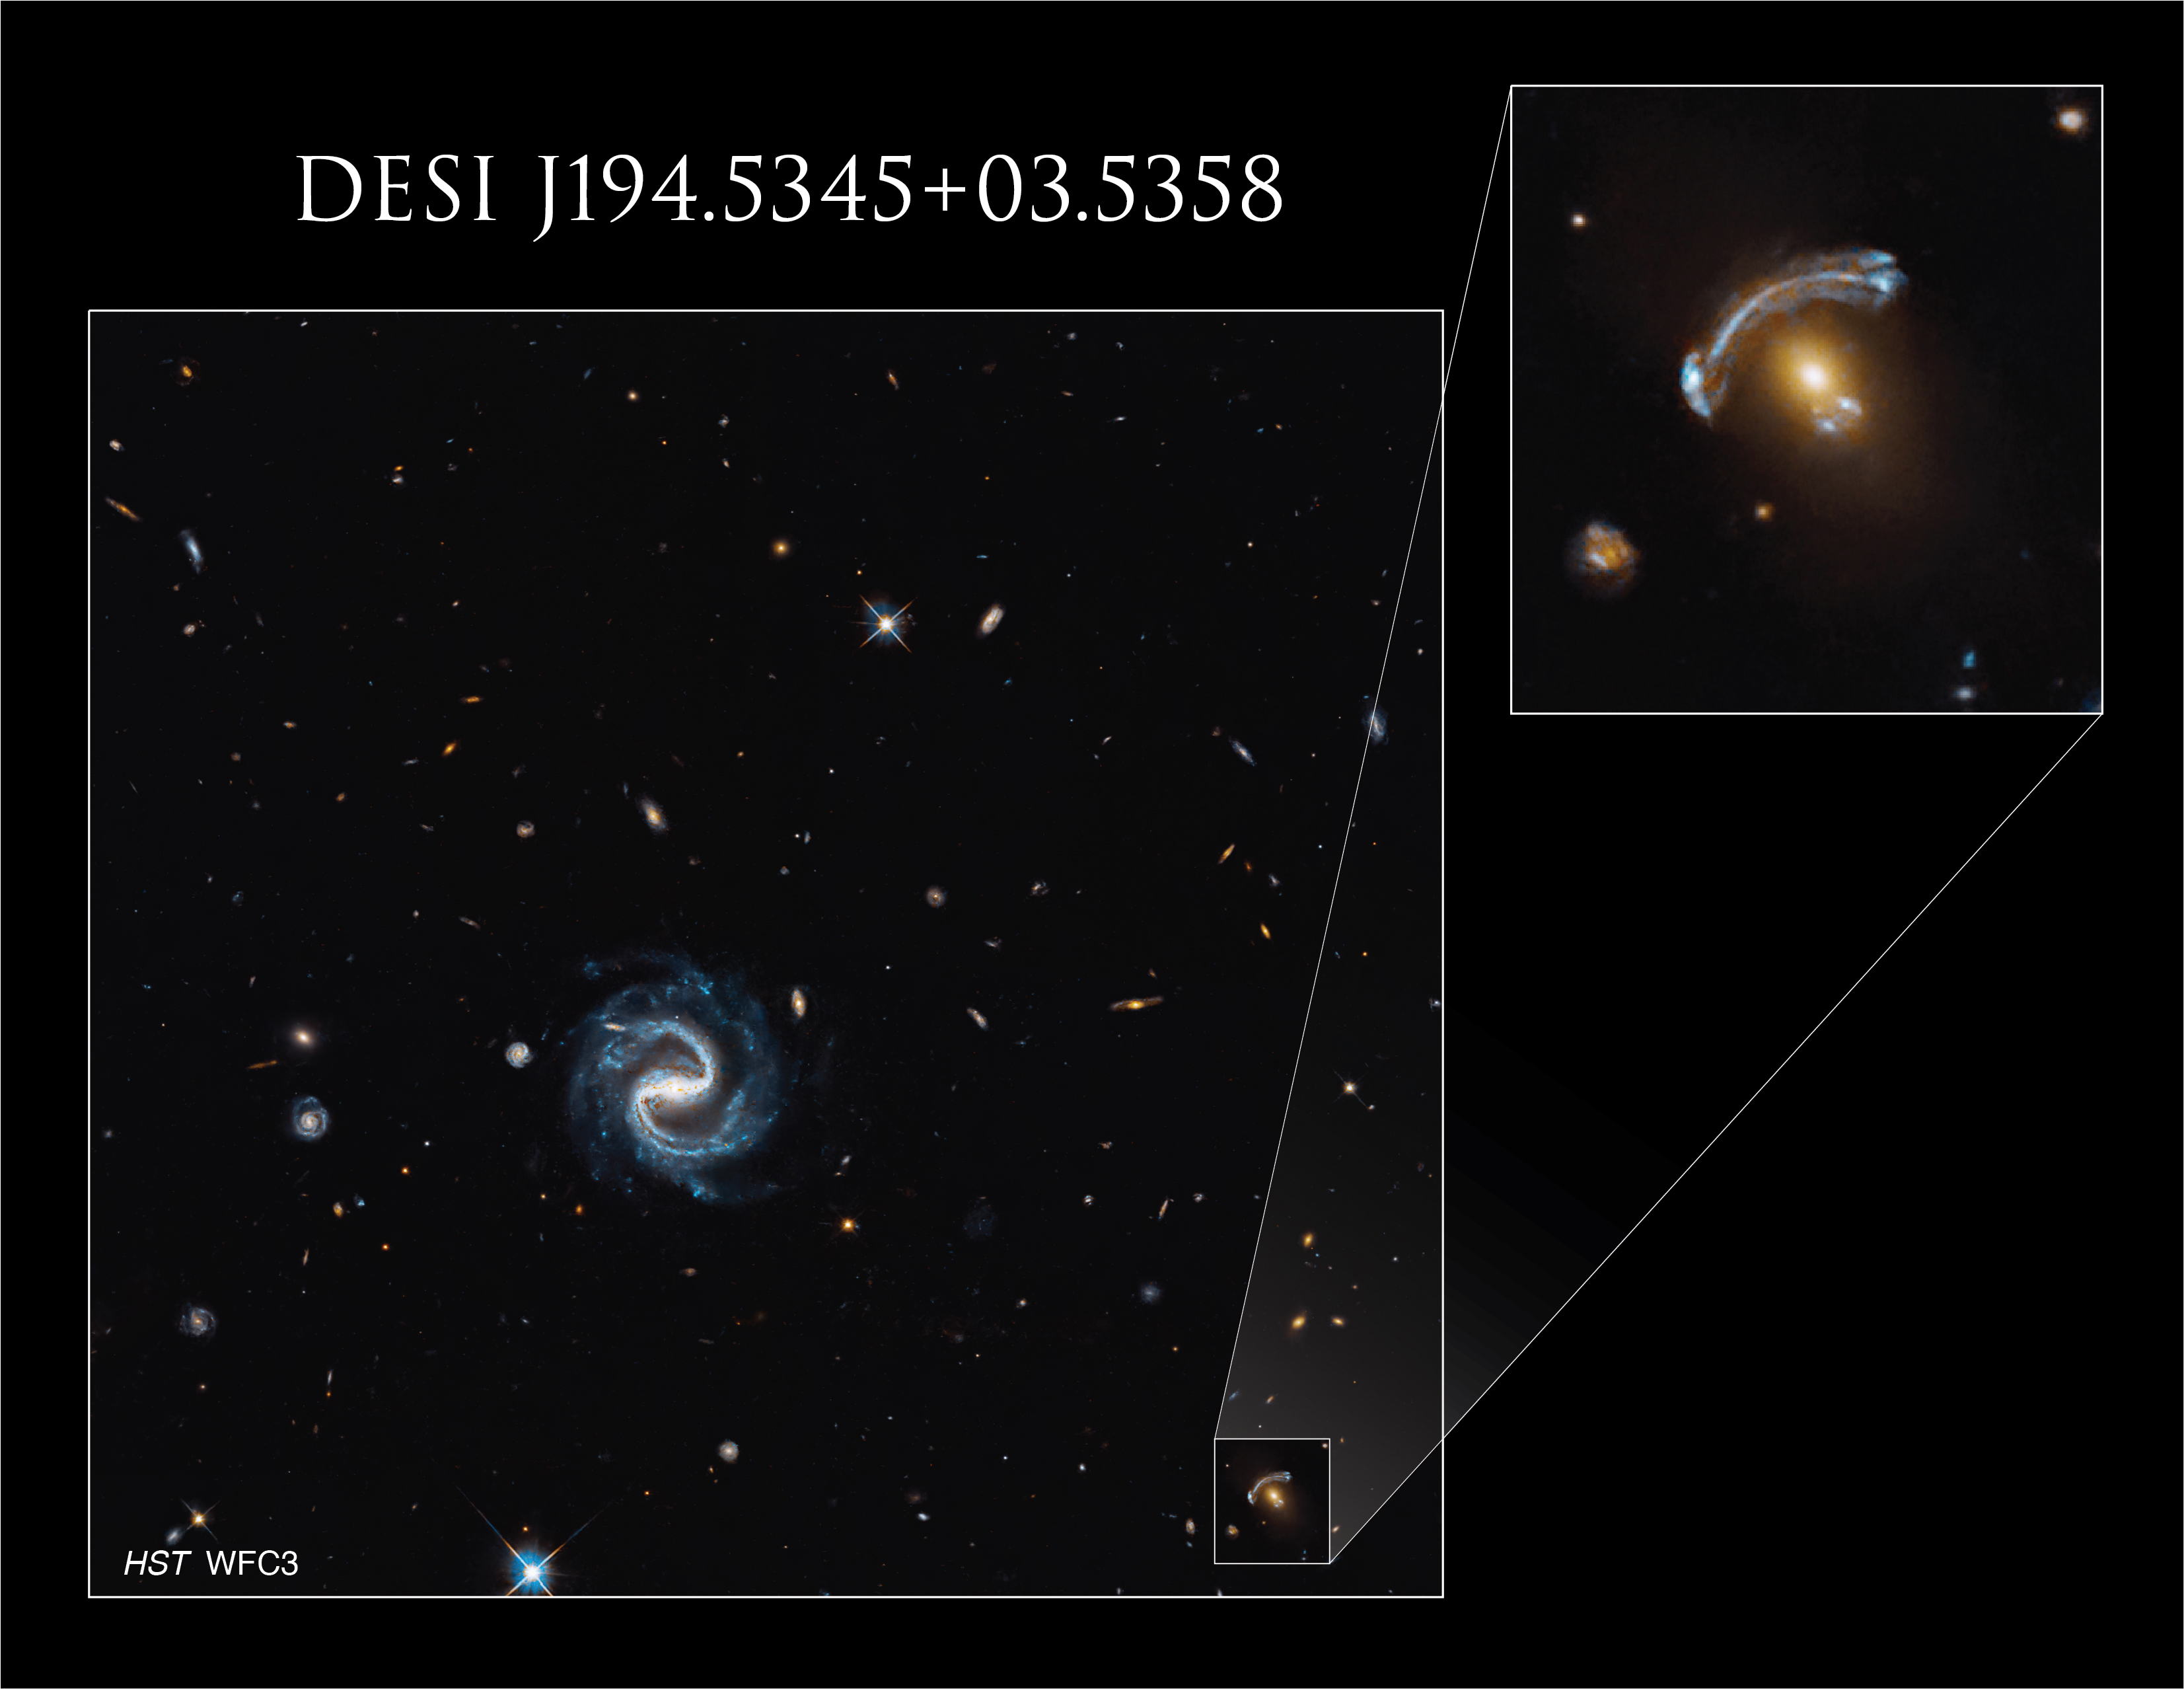
In this image, the gravitational lens features a foreground elliptical galaxy that is about 4.5 billion light-years away. That means the light we see from this galaxy now would have first started traveling toward us when our solar system was still forming. The background galaxy is about eight billion light-years away, almost twice as far. It appears as a pair of arcs, one large and very noticeable to the upper left of the foreground galaxy, the other a much smaller, flipped image of the same background galaxy to the lower right. This configuration is called an arc-counterarc pair.

A Hubble image of gravitational lens DESI J194.5345+03.5358 and a nearby spiral galaxy. The lens is magnified in a callout box. The lens has a spherical yellow galaxy at its center, with a large arc to the upper left of the galaxy and the same arc, flipped and much smaller, to the lower right of the galaxy.
The background galaxy magnified and made visible by this gravitational lens appears twice in this image ― as a large arc and smaller, flipped arc ― on opposite sides of the elliptical foreground galaxy.
NASA, ESA, and X. Huang (University of San Francisco); Processing: Gladys Kober (NASA/Catholic University of America)

The more massive the foreground galaxy is, the stronger the gravitational lens and the more significantly it bends light. By studying the distortion of the background galaxy, researchers can determine how much mass the foreground galaxy contains. This plays a huge role in the study of dark matter, the mysterious, invisible substance that makes up the majority of mass in the universe. The visible matter is not enough to account for the level of distortion in the background galaxy, which allows researchers to calculate both the mass of the foreground galaxy and how much dark matter it contains.

Almost all of the objects in this image are galaxies, except for a few scattered foreground stars. The barred spiral galaxy in this image – so called because its arms extend from a bar of stars in its center – is about the size of our own Milky Way galaxy, which astronomers think is a barred spiral as well. The tiny spiral to the left of the large spiral may be a satellite galaxy, similar to the Large and Small Magellanic Clouds that orbit the Milky Way.

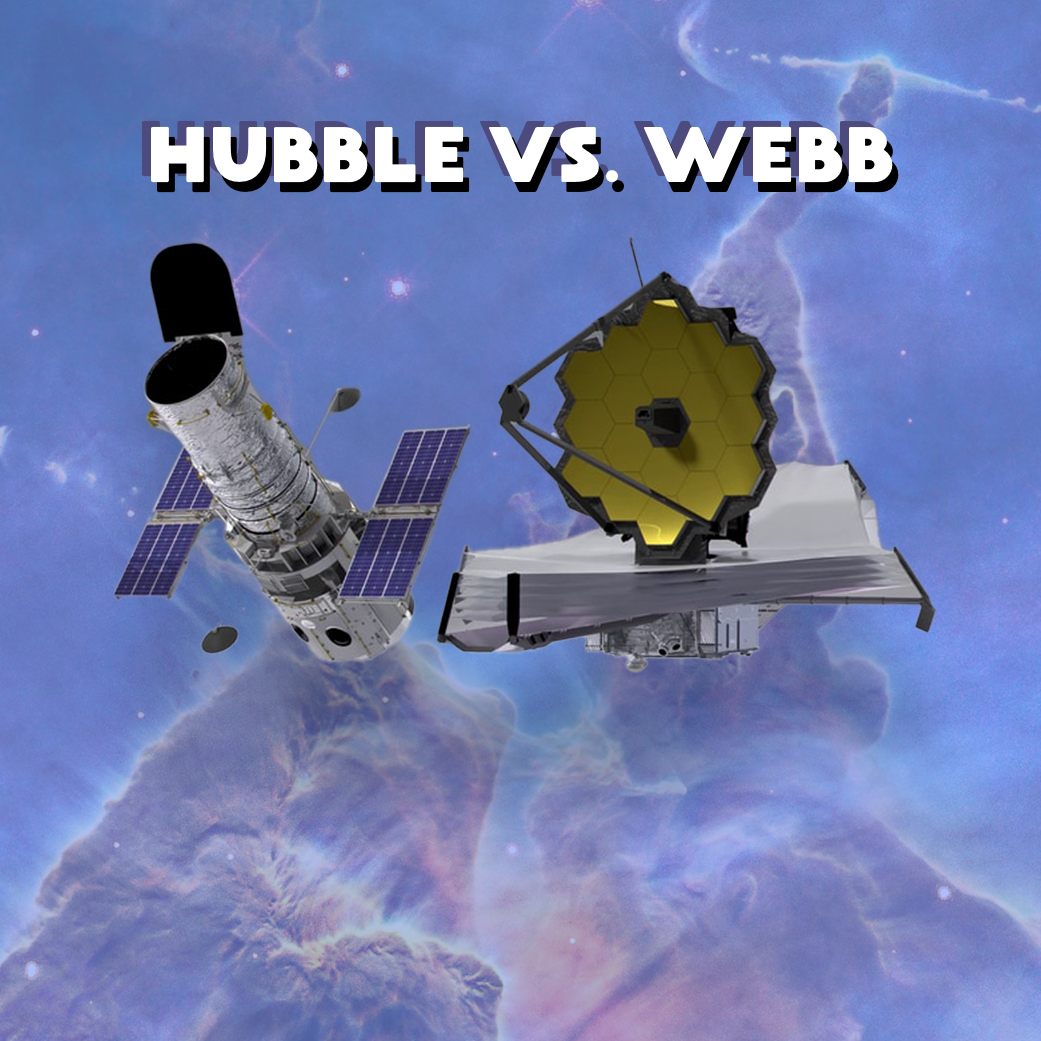
Hubble views the cosmos primarily in visible and ultraviolet light with some infrared coverage, and Roman sees mainly infrared wavelengths and some visible light. Hubble can provide high-resolution views of individual objects, while Roman has a much larger field of view conducive to panoramas.

Images like this offer a glimpse of how Hubble and Roman will work together to build an even more comprehensive picture of the cosmos. This is just one of many gravitational lens images captured by Hubble. Astronomers will use them to analyze gravitational distortions to learn more about dark matter in the foreground galaxies and to lay the groundwork for future Roman observations.

Hubble can only view these gravitational lenses one at a time, while Roman’s wide view of the sky will provide a greater sample of these lenses. Astronomers are using Hubble’s sharp images to build a computer model to better analyze dark matter-induced distortions. This tool will help astronomers analyze Roman’s large images. Hubble will also follow up on interesting lenses Roman detects.

Explore More

Media Contact:

Claire Andreoli
NASA’s Goddard Space Flight Center, Greenbelt, MD
[email protected]

Source: science.nasa.gov