Army 1st Lt. Victor Leonard Kandle, a World War II platoon leader, posthumously received the Medal of Honor for his exceptional leadership and courage.
Source: www.war.gov
Army 1st Lt. Victor Leonard Kandle, a World War II platoon leader, posthumously received the Medal of Honor for his exceptional leadership and courage.
Source: www.war.gov
Behind every military honor is a service member who has trained to carry out the duty with care, discipline and respect. Honor guard airmen at Barksdale Air Force Base, La., work hard to ensure service members and veterans receive the recognition they deserve.
Source: www.war.gov
APOD
Astronomy Picture of the Day
Discover the cosmos! Each day a different image or photograph of our fascinating universe is featured, along with a brief explanation written by a professional astronomer.

Explanation: The Great Nebula in Orion, an immense, nearby starbirth region, is one of the most famous of all astronomical nebulas. Here, glowing gas surrounds hot young stars at the edge of an immense interstellar molecular cloud only 1500 light-years away. In the featured deep image in assigned colors highlighted by emission in hydrogen, wisps and sheets of dust and gas are particularly evident. The Great Nebula in Orion can be found with the unaided eye near the easily identifiable belt of three stars in the popular constellation Orion. In addition to housing a bright open cluster of stars known as the Trapezium, the Orion Nebula contains many stellar nurseries. These nurseries contain much hydrogen gas, hot young stars, proplyds, and stellar jets spewing material at high speeds. Also known as M42, the Orion Nebula spans about 40 light years and is located in the same spiral arm of our Galaxy as the Sun.
Tomorrow’s picture: open space
| Date: | October 26, 2026 |
|---|---|
| Credit & Copyright: | Roberto Palaia |
| Authors & editors: | Robert Nemiroff, Jerry Bonnell, Cecilia Chirenti, Keighley Rockcliffe |
| A service of: |
ASD at NASA / GSFC, NASA Science Activation & Michigan Tech. U. |
Source: science.nasa.gov
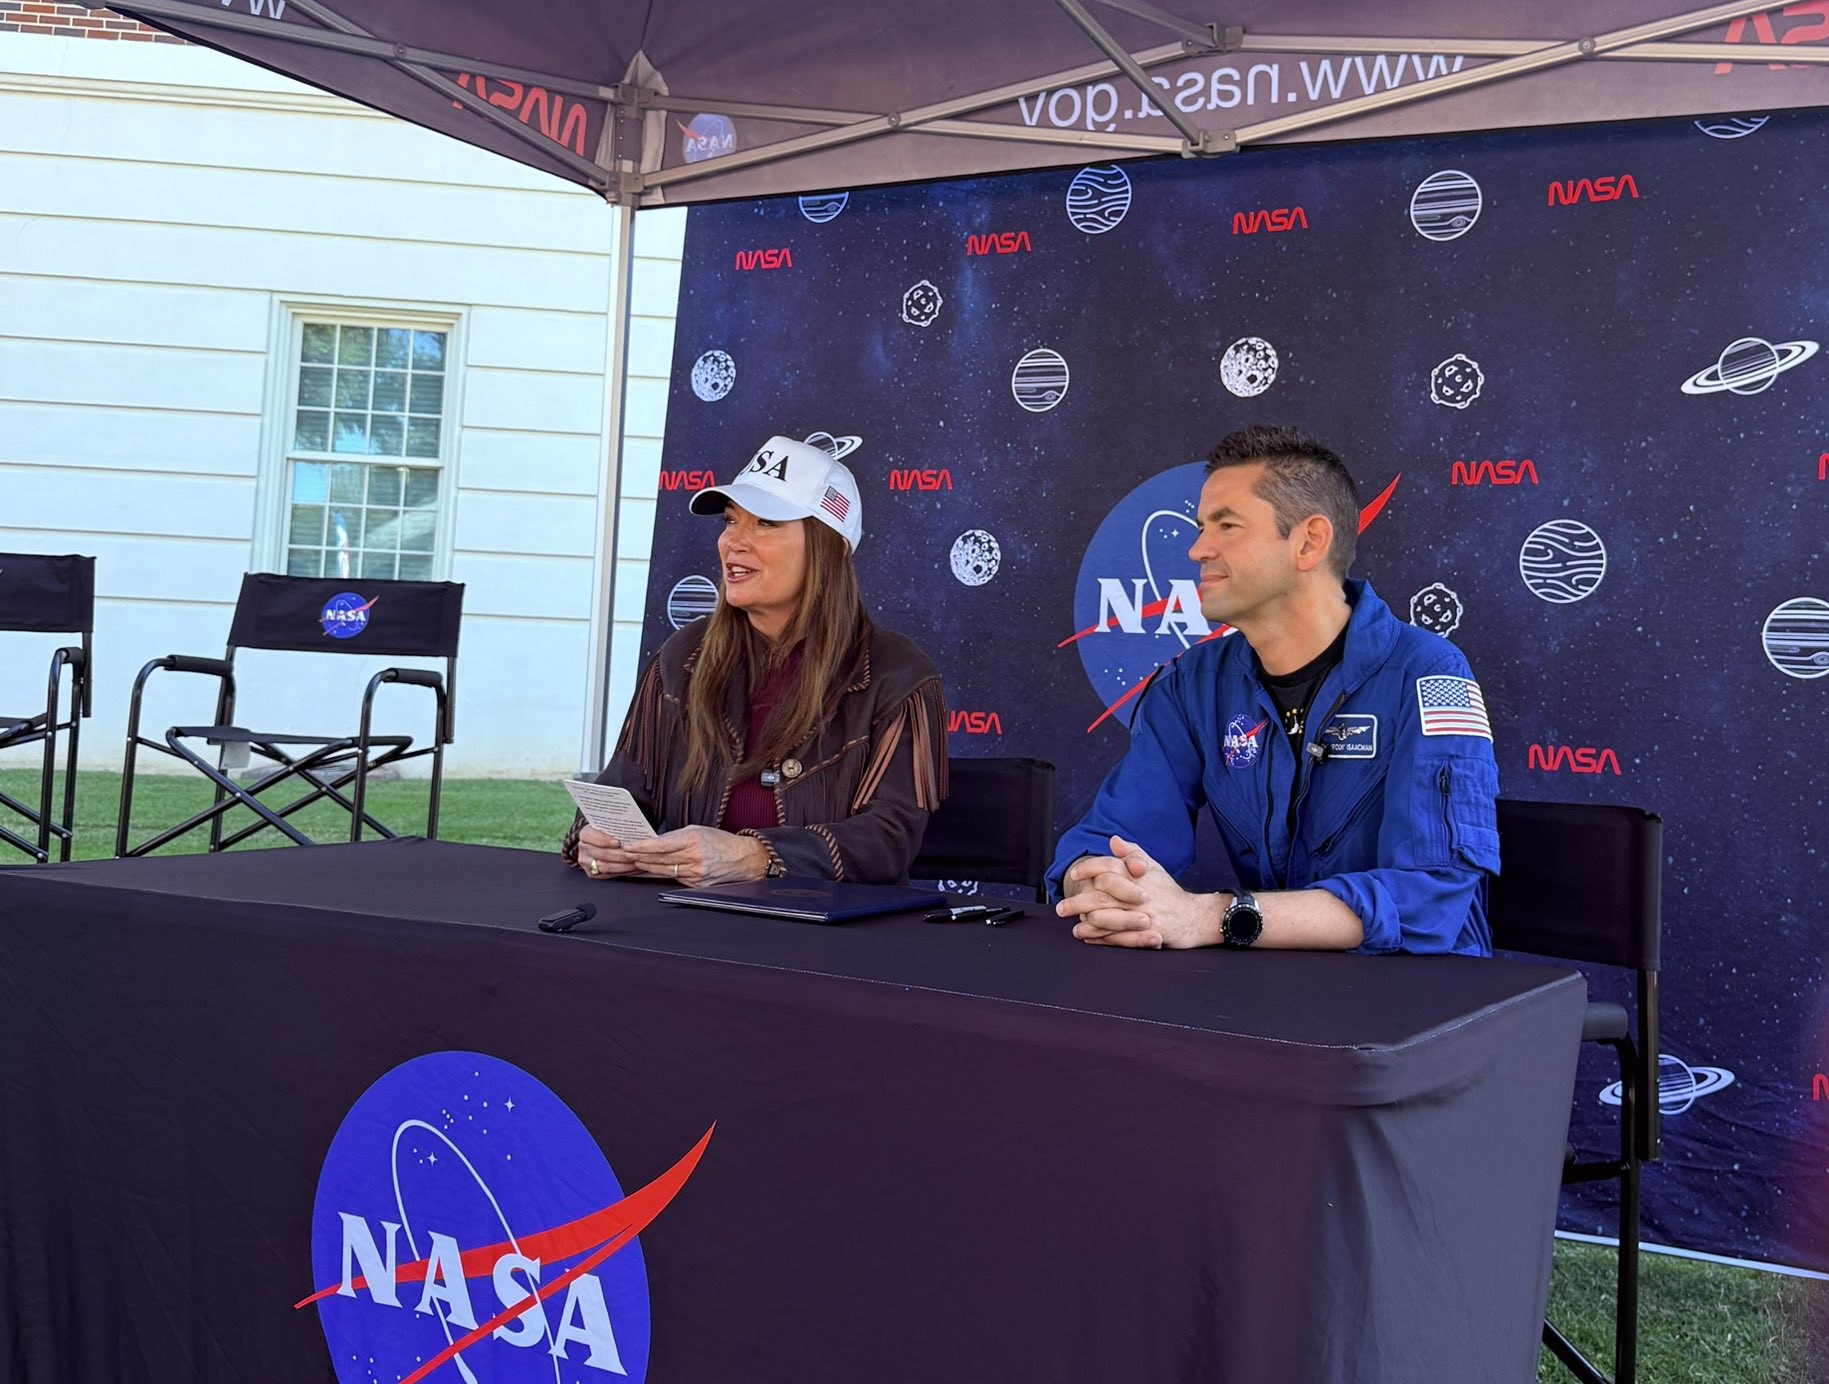
NASA and the U.S. Department of Agriculture (USDA) have signed a Memorandum of Understanding expanding cooperation in Earth observation, geospatial analytics, and advanced data technologies, supporting USDA’s data modernization plan for United States agriculture.
“NASA develops some of the most advanced sensing, computing, and analytical capabilities in the world, and we should put those tools to work wherever they can deliver meaningful outcomes for the American people,” said NASA Administrator Jared Isaacman. “By combining NASA’s Earth observation data and technical expertise with USDA’s knowledge of American agriculture, we can improve the information available to farmers and ranchers, strengthen our understanding of crop conditions and natural hazards, and pursue new high-risk, high-reward ideas that advance both science and American competitiveness.”
Isaacman and U.S. Secretary of Agriculture Brooke Rollins signed the agreement Oct. 24 during NASA’s Inspiration Tour at the University of Alabama in Tuscaloosa.
NASA and USDA’s longstanding partnership has supported collaborative research and data-sharing efforts that strengthen U.S. agriculture. The new agreement deepens this cooperation by focusing on improved data integration and enhanced coordination across Earth observation and agricultural applications.
“American farmers are the best in the world and deserve any solution we can leverage, even when it is out of this world. I am proud to announce that USDA will now work with Administrator Isaacman and NASA to utilize the full power of technology, research, and development to fortify U.S. agriculture,” said Rollins. “With this unprecedented partnership the Trump Administration is committing to a bright future of research and tech opportunities that will enhance USDA acreage and yield estimation and drive profitability for American agriculture.”
Under the new agreement, the agencies can explore activities in agricultural statistics, remote sensing science, modeling, geospatial data engineering, and super intelligence. NASA and USDA also will look at how to better align Earth observation data and analytical tools with agricultural needs, helping improve crop monitoring, acreage and yield estimates, and assessments of drought and other disasters.
The agencies will examine new approaches for managing and analyzing large datasets, strengthening USDA’s data systems while providing farmers, ranchers, and policymakers with more timely and reliable information.
For more information about NASA’s Earth science, visit:
https://science.nasa.gov/earth
-end-
Camille Gallo / Elizabeth Shaw
Headquarters, Washington
202-358-1600
[email protected] / [email protected]
Source: www.nasa.gov
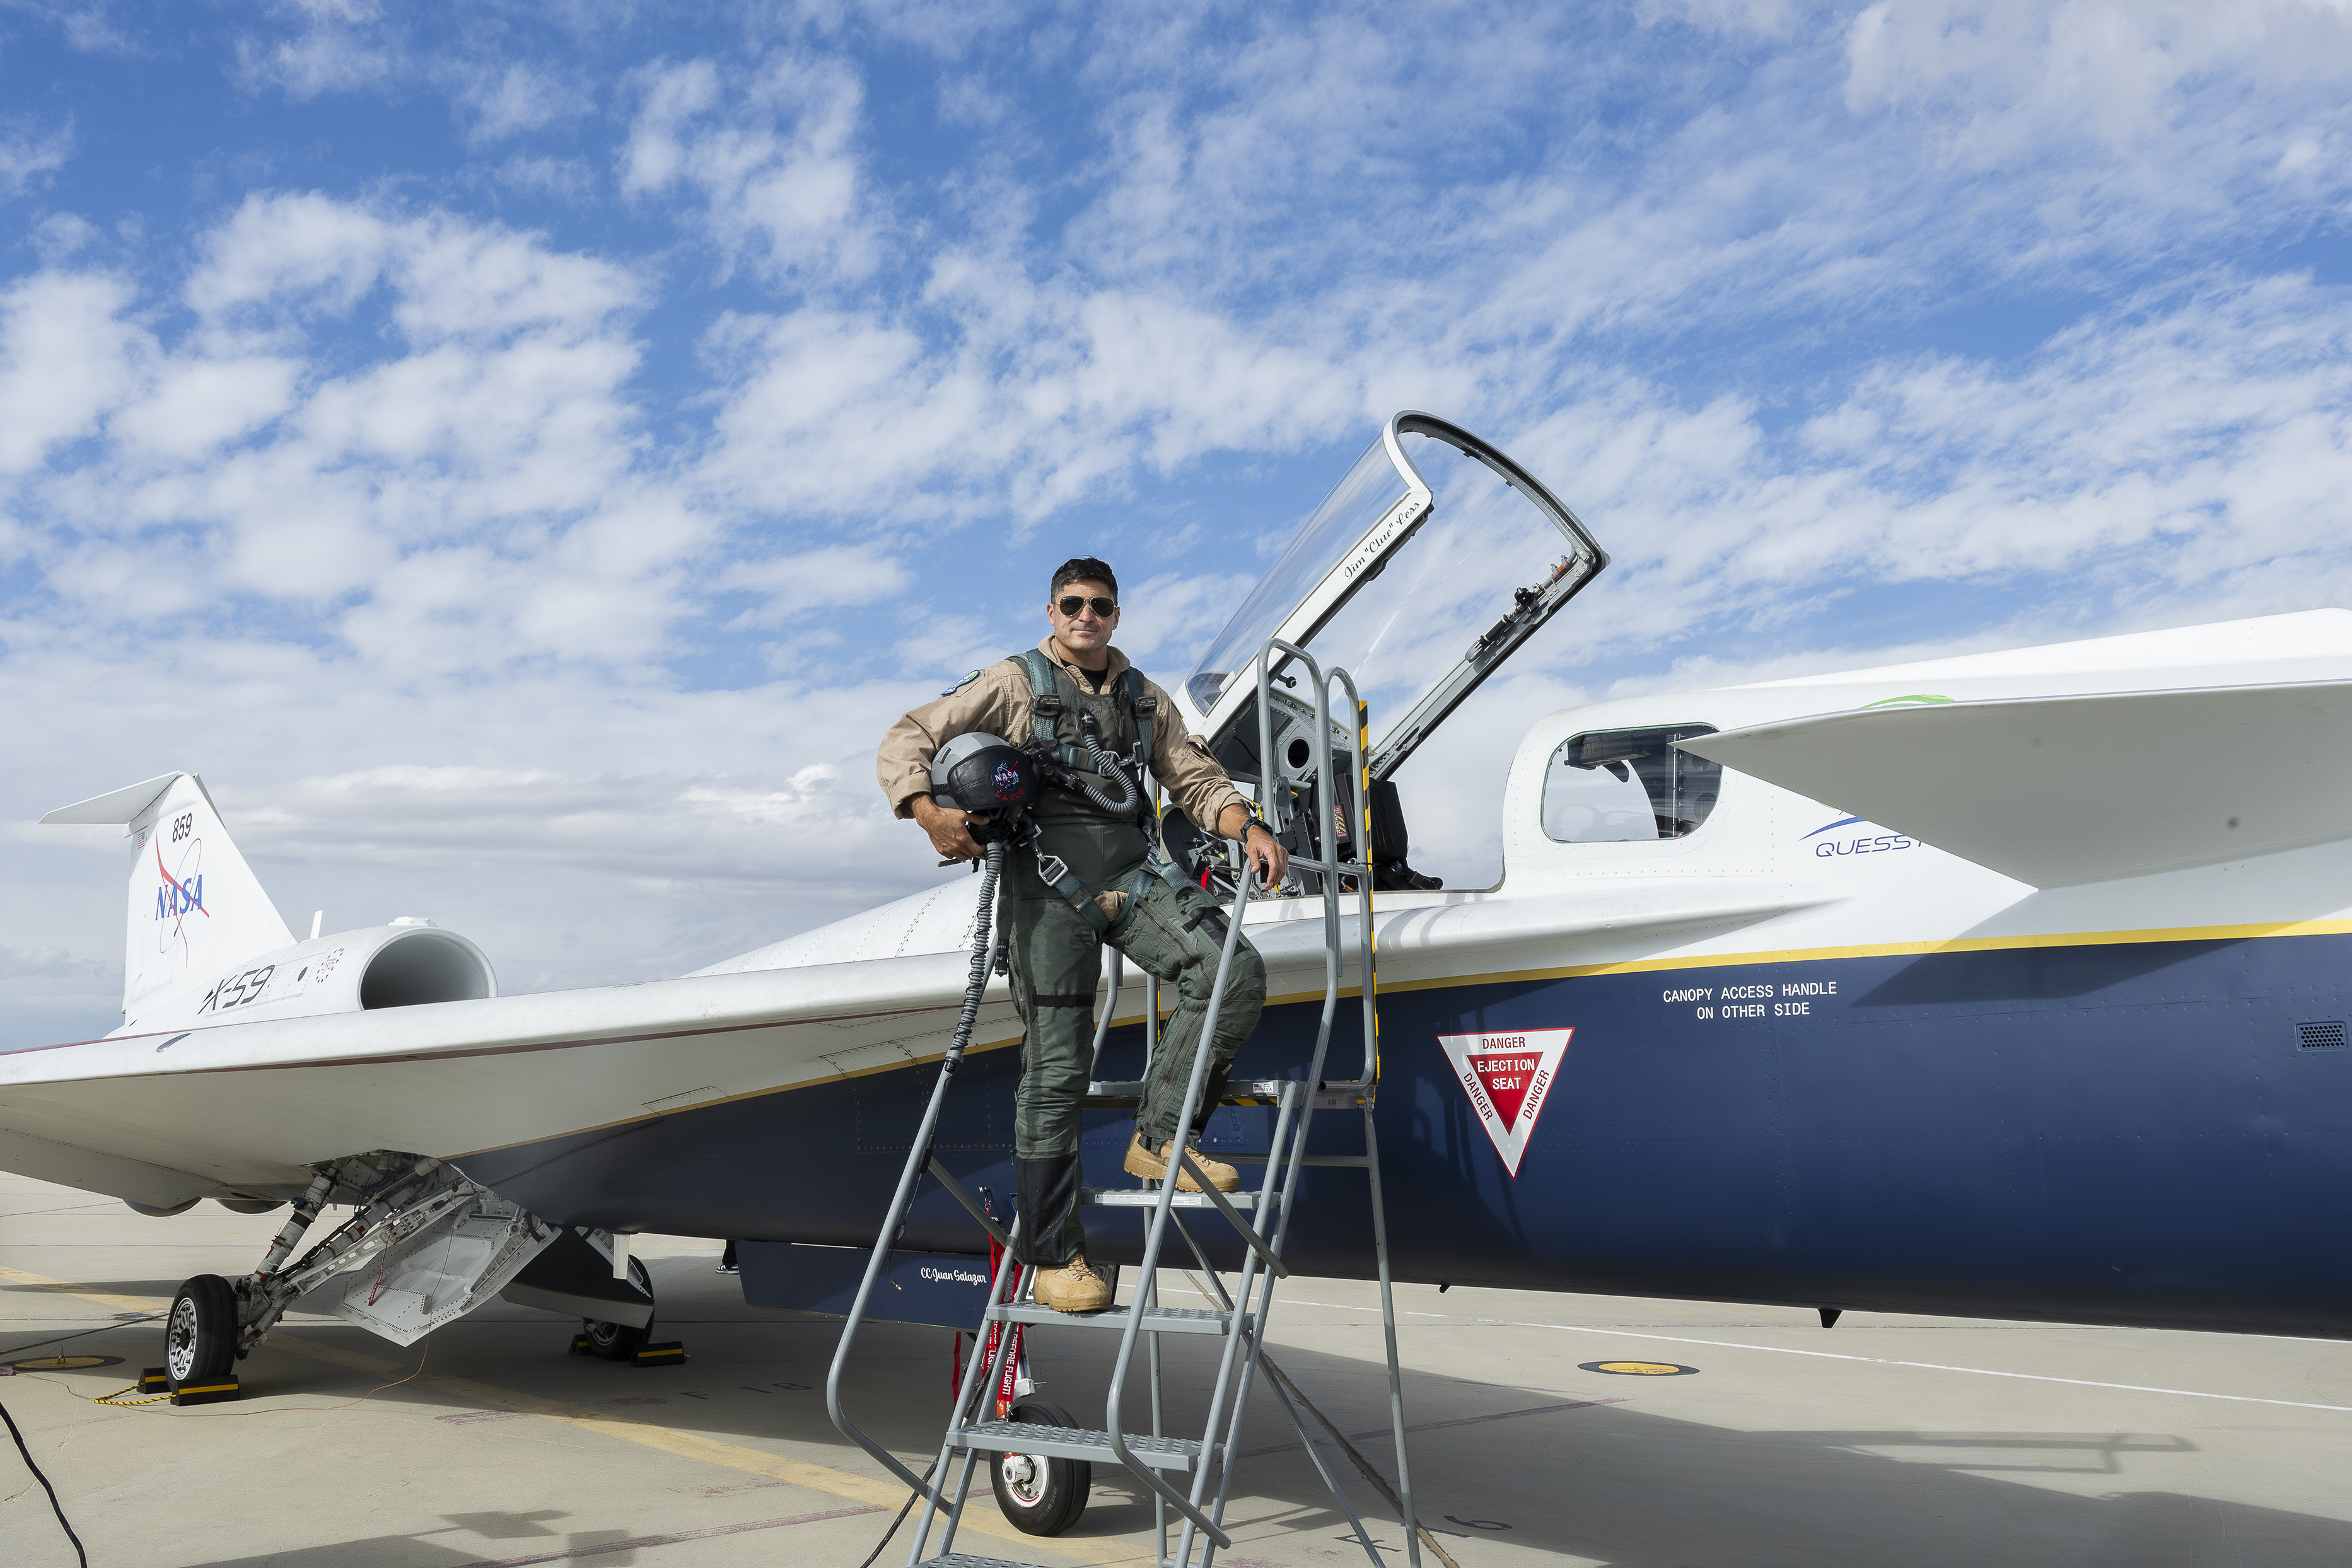
NASA test pilot Mike Lippert poses for a photo ahead of his first time flying the agency’s X-59 quiet supersonic research aircraft on Oct. 21, 2026. The X-59 has flown numerous times since its inaugural flight in November 2025; its first supersonic flight was on June 5, 2026.
Lippert took off from NASA’s Armstrong Flight Research Center in Edwards, California, and landed one hour later. The flight came after scheduled maintenance and a review of the X-59’s systems following the aircraft’s busiest week of testing to date.
Read more about Lippert and the Oct. 21 flight.
Image credit: NASA/Carla Escamilla
Source: www.nasa.gov
2 min read
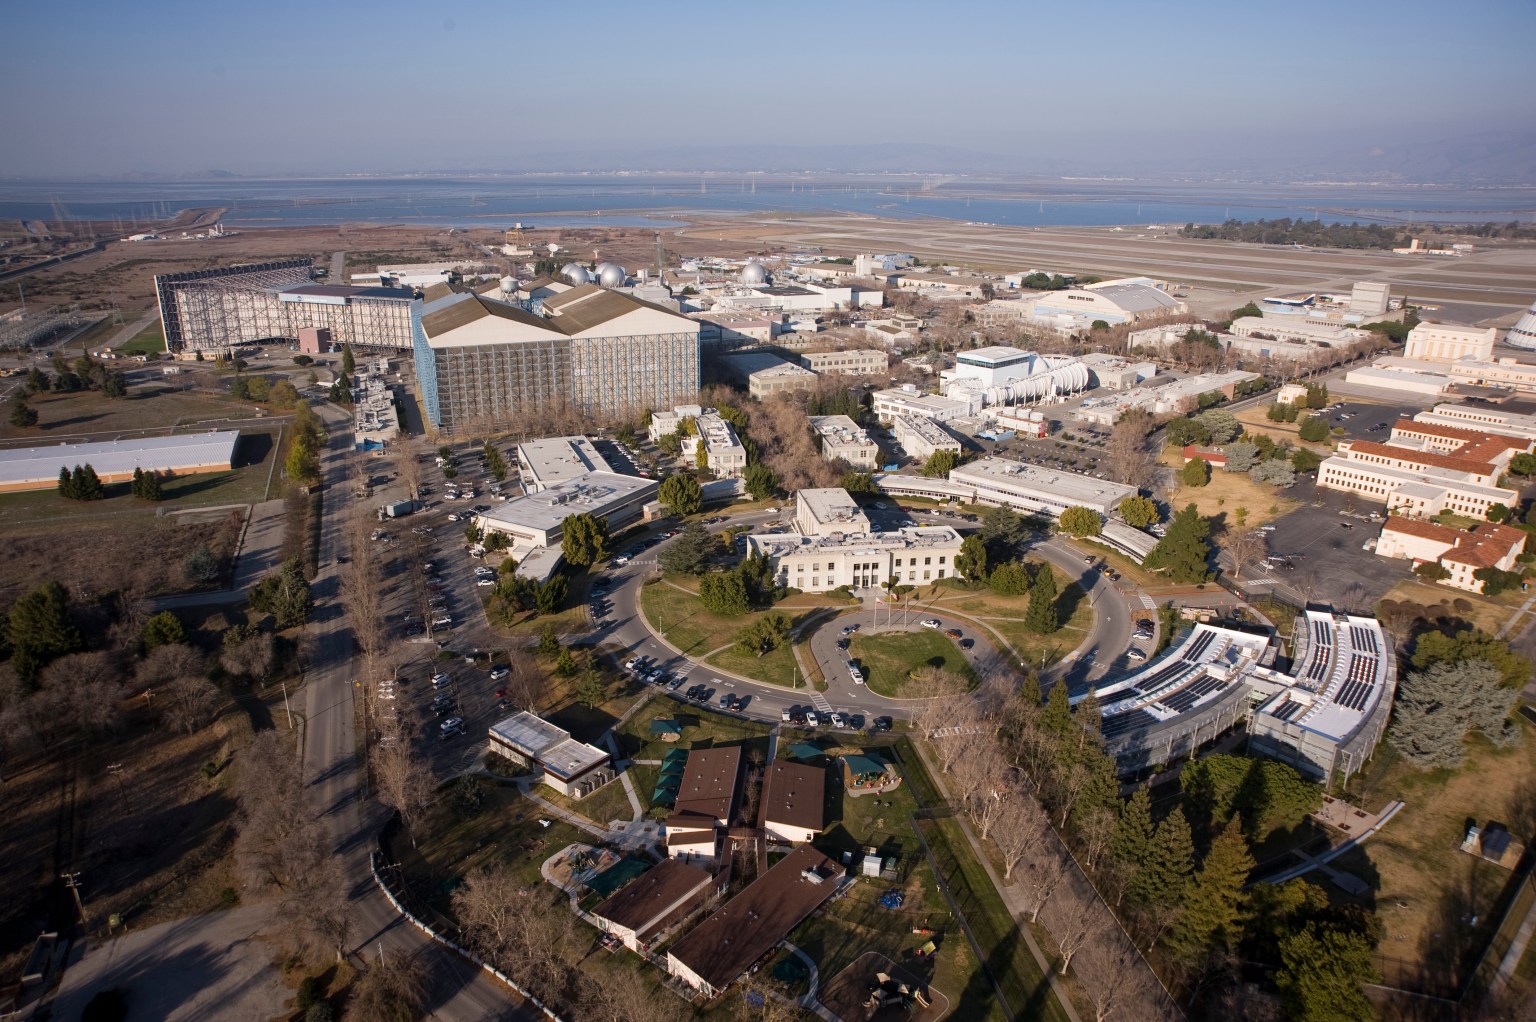
Members of the media are invited to tour a new lunar landing simulation at NASA’s Ames Research Center in California’s Silicon Valley on Thursday, Oct. 29, and Friday, Oct. 30.
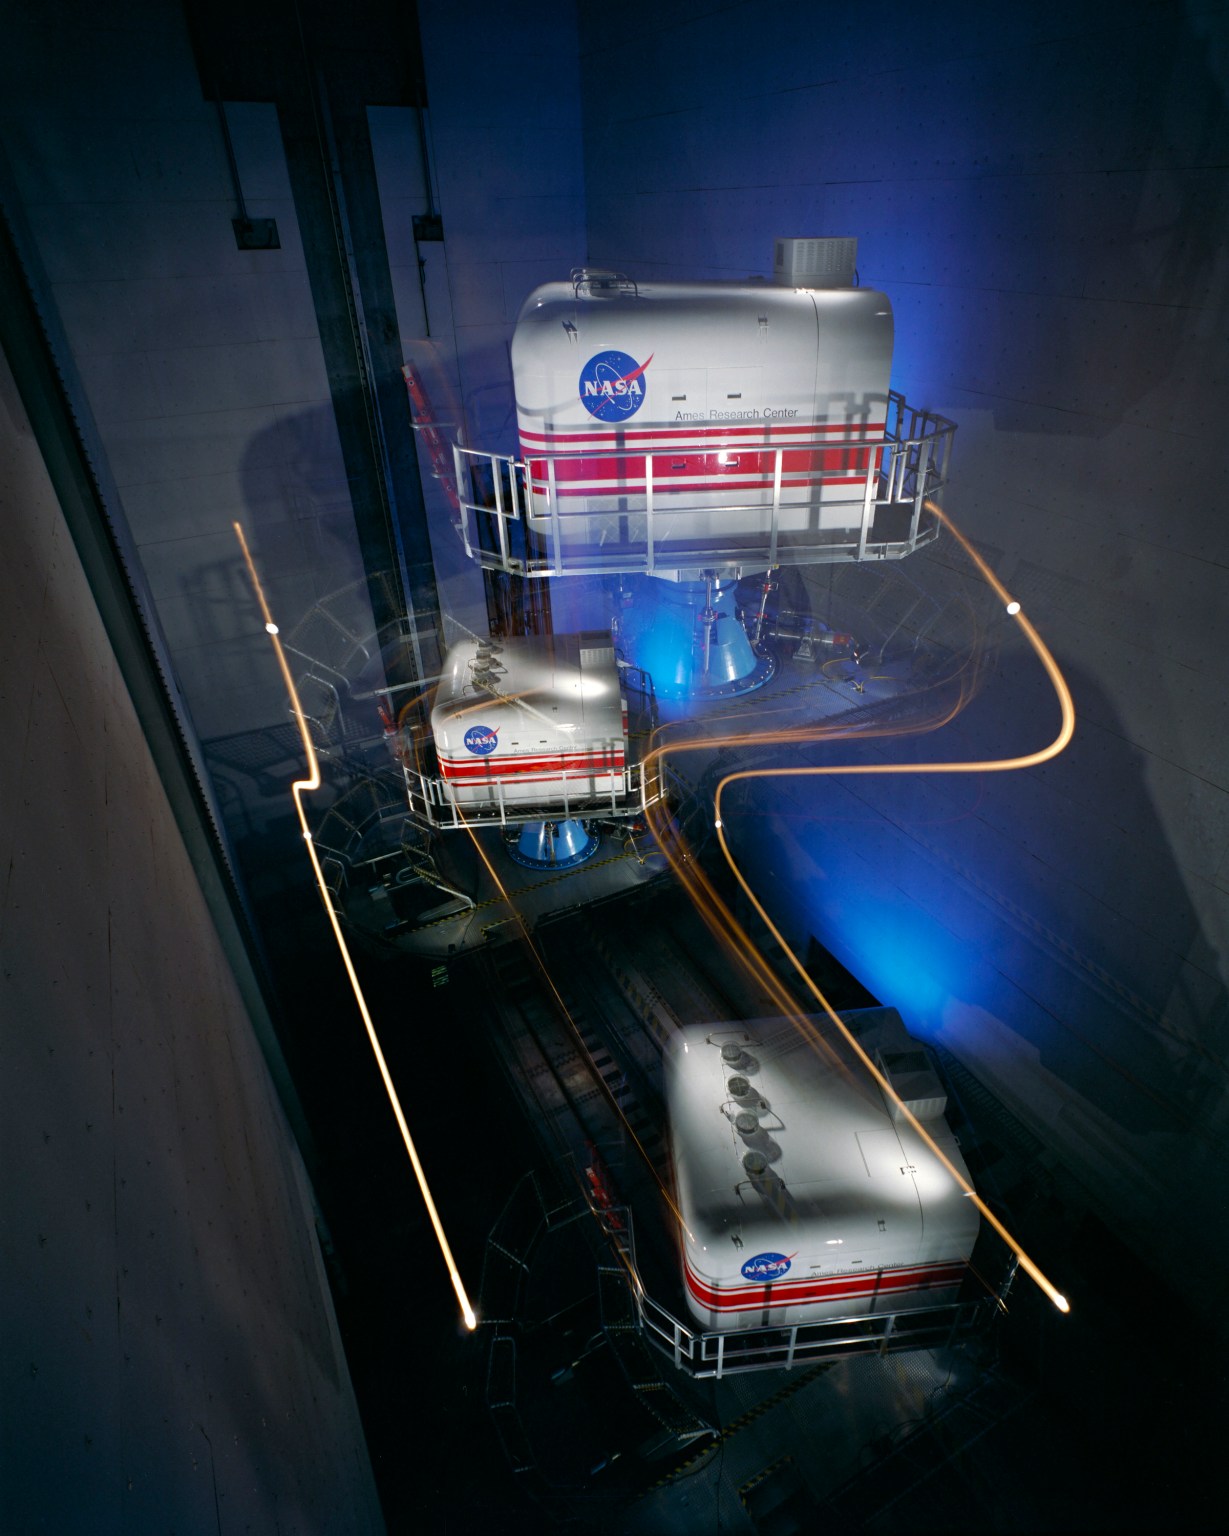
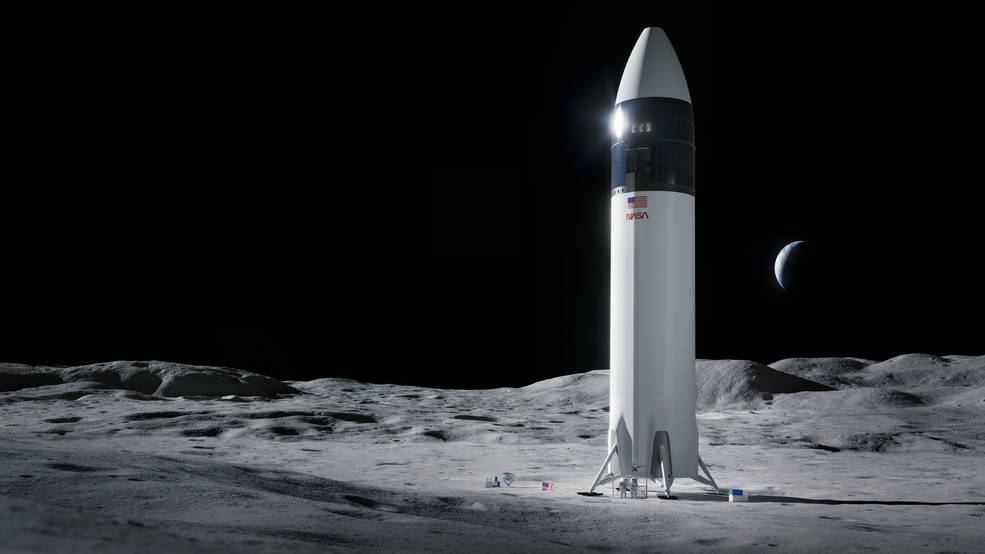
Using a combination of in-house and partner motion-based simulators, NASA is giving astronauts and engineering support teams simulated experiences before crew members pilot commercial human landing systems to the surface of the Moon. Through the Artemis program, NASA is targeting the next lunar landing in 2028.
During the tour, media will have an opportunity to participate in a Vertical Motion Simulator ride-along and interview subject matter experts.
Media interested in participating should RSVP by Tuesday, Oct. 27 at 5:00 pm PT to the NASA Ames newsroom at: [email protected]. Space is limited, and media must register in advance for consideration. NASA’s media accreditation policy is online. In your RSVP, please note your preference for Oct. 29 or Oct. 30.
The landing simulation at Ames was developed by NASA’s Johnson Space Center in Houston and integrated into the recently upgraded simulator flight deck.
As part of a Golden Age of innovation and exploration, NASA will send Artemis astronauts on increasingly difficult missions near the lunar South Pole to explore more of the Moon than ever before. In addition to providing economic benefits and advancing scientific discovery through its Moon missions, NASA will establish an enduring human presence on the lunar surface and build on the agency’s foundation for the first crewed mission to Mars.
For more information about NASA’s Artemis program, visit:
-end-
Jeanne Neal
Ames Research Center, Calif.
650-604-4789
[email protected]
Source: www.nasa.gov
4 min read
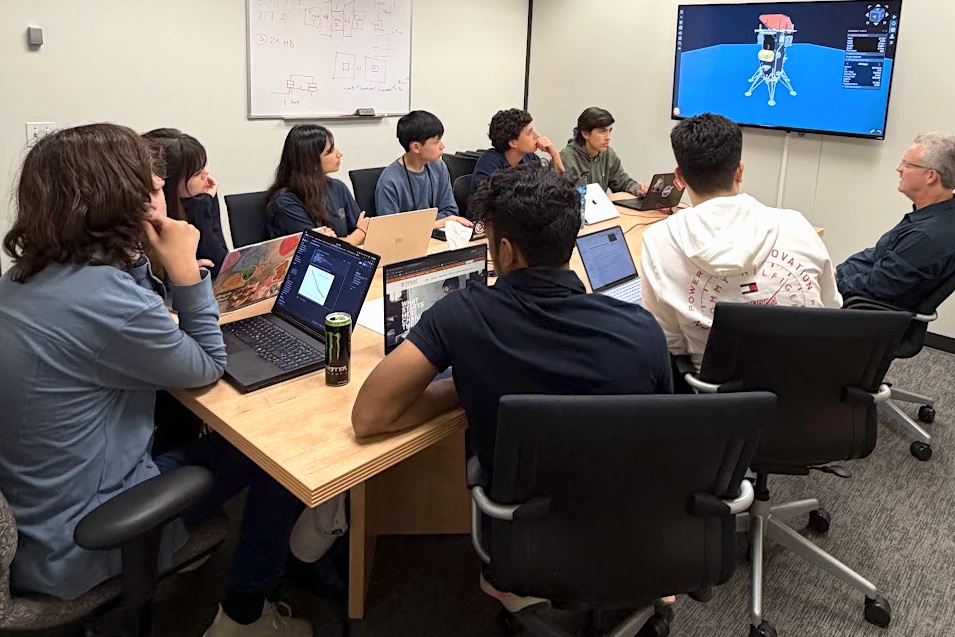
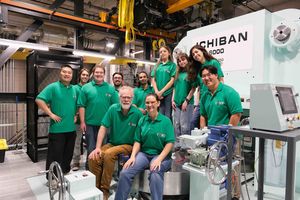
The NASA STEM (Science, Technology, Engineering, and Mathematics) Enhancement in Earth Science (SEES) Internship Program at the University of Texas Center for Space Research places high school students on small, mission-focused research teams mentored by NASA, academic, and industry experts. During summer 2026, the SEES Mission Architecture Tool for Research, Integration, and eXploration (MATRIX) team focused on applying a method for measuring propellant mass in microgravity, where liquid fuel clings to tank walls instead of settling – a challenge central to NASA’s Artemis missions.
The MATRIX team was mentored by Dr. Kevin Crosby, who, along with colleagues at NASA, developed the Modal Propellant Gauging (MPG) approach to microgravity propellant mass gauging at Carthage College in Kenosha, WI. MPG uses the acoustic response of propellant tanks to estimate the mass of fuel inside a tank. The method has been used successfully in several spaceflight experiments and is scheduled for demonstration on the Intuitive Machines IM-3 mission. The IM-3 lander, Trinity, is scheduled to touch down on the Moon in the Reiner Gamma region in 2027. The team developed models for predicting when MPG can take reliable readings during the mission, giving the interns direct experience with a technology preparing for spaceflight and lunar surface operations.
Reconstructing a Lunar Mission from Public Data
The MATRIX team relied entirely on publicly available sources, including Intuitive Machines’ published mission data. The NASA Jet Propulsion Laboratory’s Navigation and Ancillary Information Facility (NAIF) provided detailed trajectory records for the IM-1 and IM-2 missions. By comparing the IM-2 spacecraft’s reconstructed flight path with a model of its motion without engine thrust, the team identified engine burns and estimated the change in velocity associated with each burn.
Because a complete IM-3 trajectory is not public, the team wrote a reconstruction algorithm using published IM-1 and IM-2 flight data. To model fluid behavior, the team ran computational fluid dynamics (CFD) simulations to estimate slosh dynamics within the tanks and conducted Monte Carlo simulations to predict the range of possible propellant states.
Identifying Windows for Measurement
The team’s analysis showed that MPG can take reliable readings during the two primary burns, Lunar Orbit Insertion (LOI) and Powered Descent, and in some cases during Descent Orbit Insertion. The spacecraft’s starting mass had the greatest effect on how long each gauging window lasts. The MATRIX team also identified candidate IM-3 launch opportunities for 2027 and produced a landing analysis for the Reiner Gamma site that showed the distribution of possible landing sites near the target.
Presenting to the Scientific Community
The team briefed the Intuitive Machines propulsion group, walking the engineers through their methods and results and demonstrating that a rigorous analysis of an active lunar mission could be built from public data. The students presented their research, “Computational Models to Estimate Modal Propellant Gauging (MPG) Windows on the Intuitive Machines IM-3 Mission,” at the SEES Annual Symposium and the Wisconsin Space Grant Consortium Annual Conference. The team will present again at the American Geophysical Union (AGU) Annual Meeting in San Francisco in December 2026.
“This high school team, in a period of less than a month, developed a depth of understanding and facility with advanced methods that rivals advanced graduate students in the field,” said Crosby. “Their work product is exceptional, and their presentation to Intuitive Machines engineers impressed everyone with the sophistication and creativity of their work. The SEES program has consistently provided a unique environment for students to demonstrate they can achieve far more than what is asked of them, even in the most advanced classes.”
The SEES program gives 11th and 12th grade students direct experience with the data, tools, and analytical methods used across the aerospace industry. By applying NASA and commercial mission data to an active lunar mission, the MATRIX team contributed analysis relevant to propellant management, a capability needed for in-space refueling, fuel depots, and sustained exploration of the Moon and beyond. Thank you to all the mentors, project assistants, and volunteers who have made SEES possible for over a decade.
The SEES Mission Architecture (MATRIX) Team:
Raiymbek Abdykalykov, The Woodlands, TX
Emmanuel Bravo, Boca Raton, FL
Winston Huang, San Francisco, CA
Adrianna Krajnovic, Dallas, TX
Marco Lo Cicero, Tomball, TX
Henry Martin, Milwaukee, WI
Reva Paul, Bethlehem, PA
Swayam Sahoo, North Chelmsford, MA
Project Mentor: Dr. Kevin M. Crosby, Carthage College and Wisconsin Space Grant Consortium
Project Assistant: Mauro Esquivel, mathematics teacher, McAllen, TX
For more information, visit: https://www.csr.utexas.edu/sees-internship/
The SEES project is supported by NASA cooperative agreement award number NNH15ZDA004C and is part of the NASA Science Activation Program portfolio, which connects learners with authentic NASA science experiences through partnerships with educators and community organizations.
Source: science.nasa.gov


The Japanese tradition of momijigari, or “red leaf hunting,” stretches back more than a millennium, as evidenced by ancient poems describing journeys to admire fall foliage. In America, mentions of foliage trips began appearing in the historical record in the 19th century, around the time artists and poets such as Frederic Church and Emily Dickinson celebrated autumn color in depictions of the Northeast.
Modern-day leaf peepers have a new way to track and savor the seasonal phenomenon. The hyperspectral OCI (Ocean Color Instrument) on NASA’s PACE (Plankton, Aerosol, Cloud, ocean Ecosystem) satellite observes the planet’s oceans and vegetation daily at 286 spectral bands. Among this array are a few groups of wavelengths that allow scientists to track subtle changes in leaf pigments key to fall foliage displays, including anthocyanins (reds), carotenoids (yellows and oranges), and chlorophylls (greens).
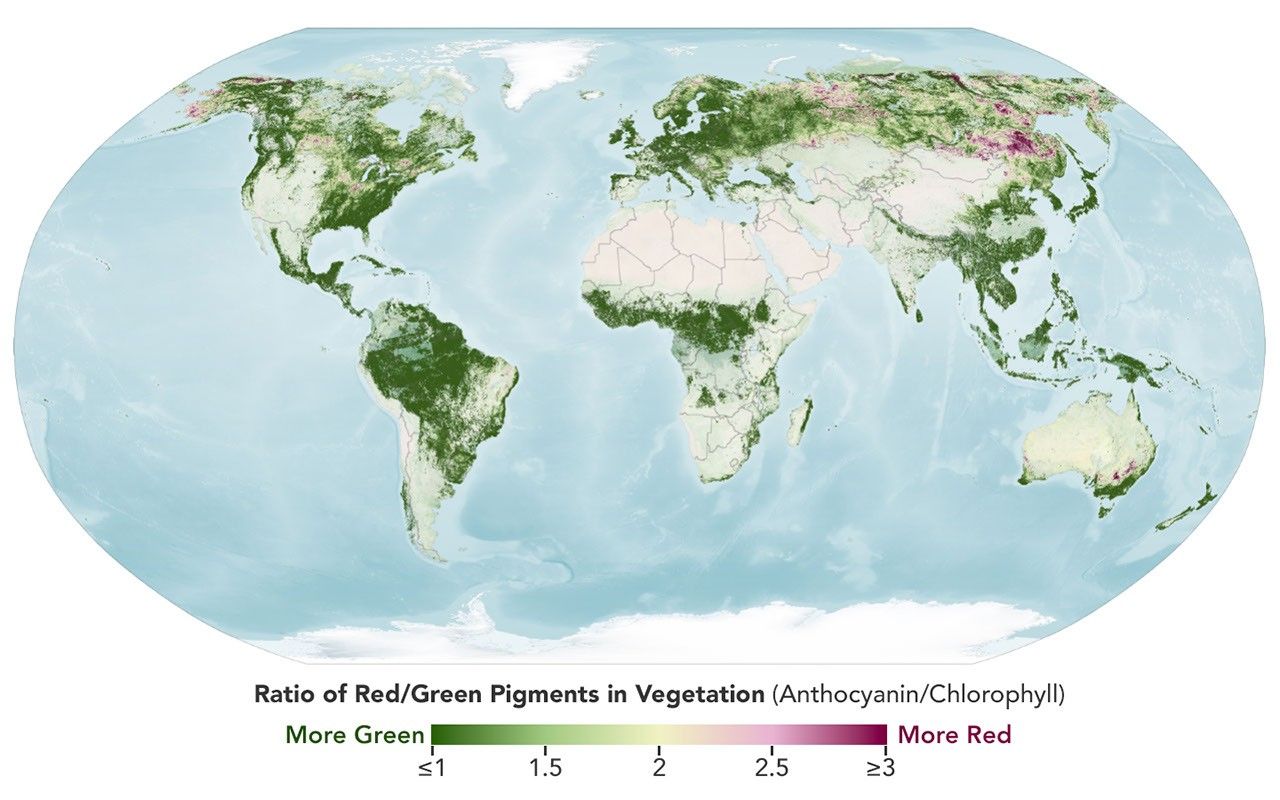
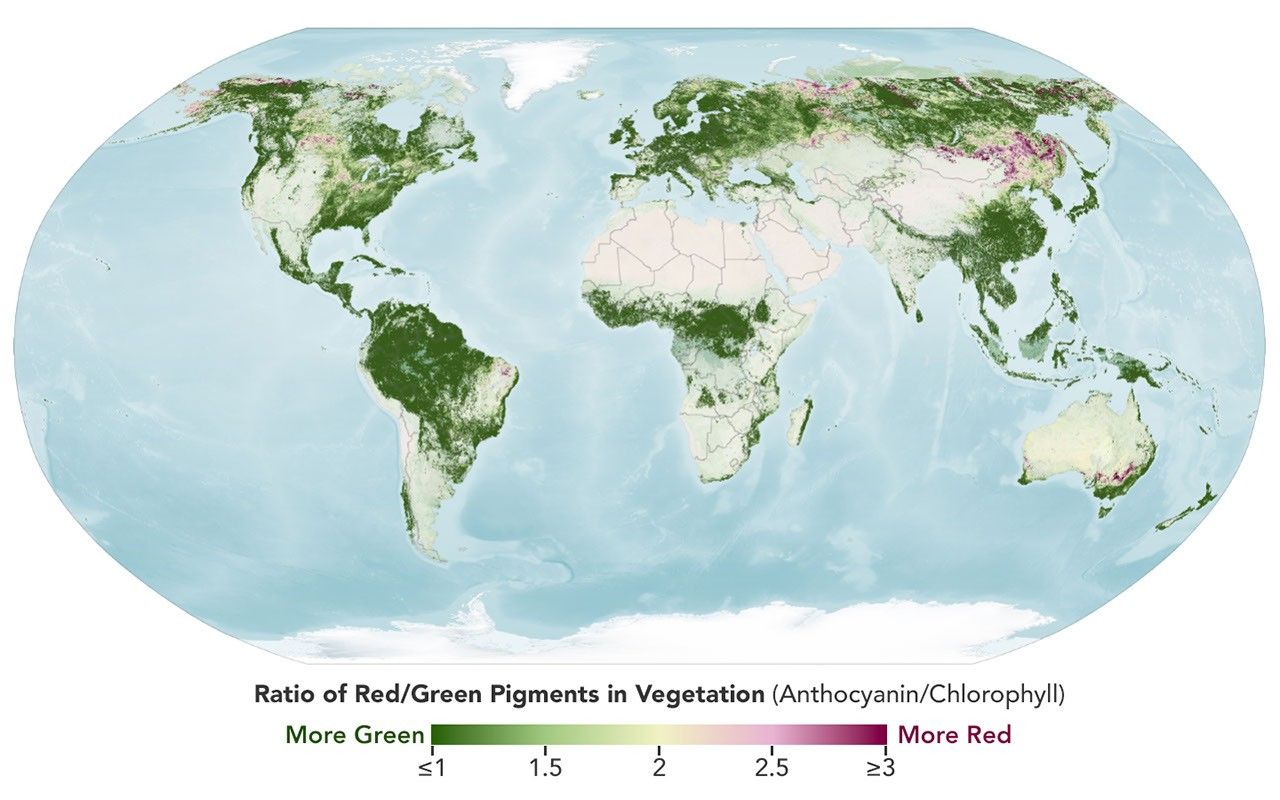
NASA scientists can track fall color by measuring how much red, orange, and yellow forests show compared with green. Tracking the ratio over time reveals where leaves are changing and when color peaks. The maps above show vegetation “redness” from September 29 to October 4 (left) and October 5 to 11 (right). Areas shown in green have values near 1, meaning the satellite detects about as much red as green, and most leaves have not yet turned. Areas shown in light yellow and red have higher values, indicating progressively more red pigment relative to green.
The satellite detected particularly high levels of redness in parts of northern and eastern Russia, northern Alaska, and northern Canada from September 29 to October 4. In New England and upstate New York, redness began to fade during the week of October 5 to 11, even as it spread across much of the Midwest and the Mid-Atlantic. (Not all the yellows and reds on the maps represent fall colors. Crops in some agricultural areas, for instance, show high anthocyanin levels as they age and after they are harvested. Also, in some regions, clouds produce what appear to be gaps in the vegetation.)
Many of the reddest areas—such as the Adirondacks in New York, the Green Mountains in Vermont, and the White Mountains in New Hampshire—have large numbers of sugar maples (Acer saccharum) and red maples (Acer rubrum), deciduous trees that turn a brilliant shade of crimson in the fall. Blueberries, bilberries, sedges, mosses, and grasses likely contribute to the intense reds detected in marshy tundra areas in northern Alaska, Canada, and Russia.
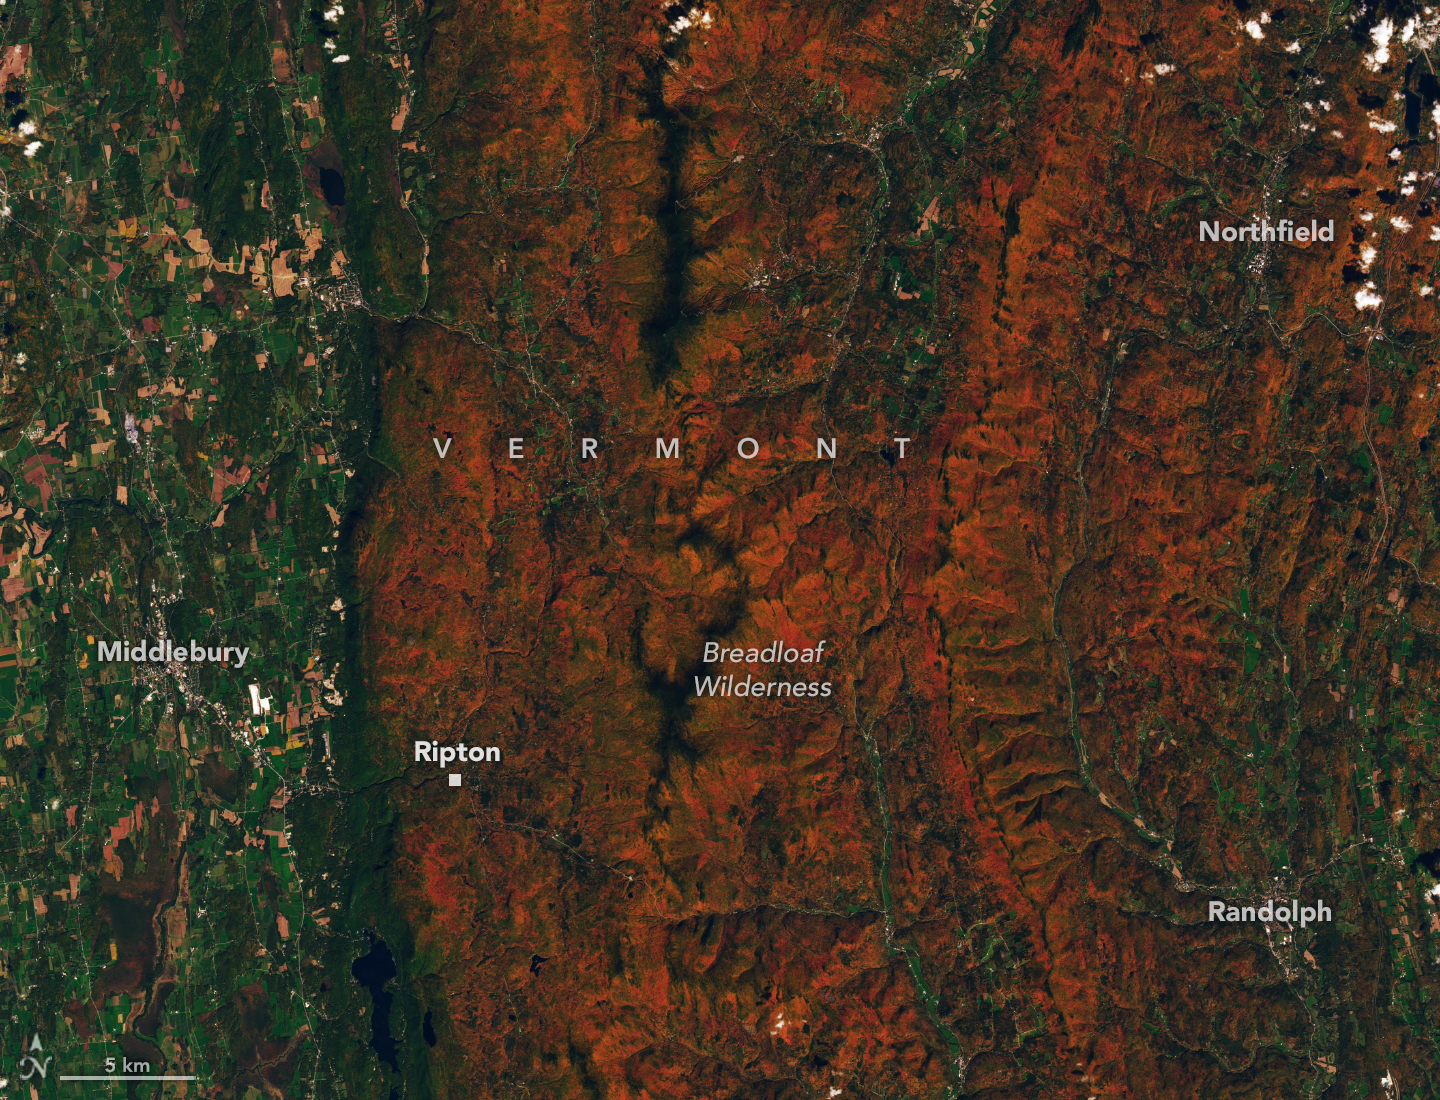
The OLI (Operational Land Imager) on Landsat 9 captured an image (above) of intensely red foliage around Ripton, Vermont, on October 3, 2026, around the peak of redness in the region. Poet Robert Frost, author of “October,” “The Road Not Taken,” “Nothing Gold Can Stay,” and several other poems that evoke fall foliage, kept a summer home and farm in Ripton and taught at Middlebury’s Bread Loaf School of English.
Some other satellites with hyperspectral sensors can measure fall foliage pigments in a way that is similar to PACE, but only in more localized areas and less frequently. PACE is the first satellite capable of measuring all three key leaf pigments—anthocyanins, carotenoids, and chlorophylls—across the entire planet every day or two.
“It’s the ability to collect time-series data of anthocyanins and carotenoids everywhere on Earth repeatedly that is game-changing,” said Karl Huemmrich, a vegetation scientist with the Goddard Earth Sciences Technology and Research II center at the University of Maryland, Baltimore County. Huemmrich, who is also a member of the PACE science team, was eager to work with the satellite because of OCI’s broad swath and short revisit time. “The time-series data allow us to determine peak redness and yellowness anywhere on Earth,” he said.
In the fall, leaves change colors as they lose chlorophyll, a green molecule that plants use to synthesize food. Since chlorophyll is not a stable compound, plants must continuously synthesize it, a process that requires ample sunlight and warm temperatures. As temperatures decrease and days shorten in autumn, levels of chlorophyll drop, causing greens to fade and presenting an opportunity for carotenoids and anthocyanins to show their colors.
As part of the ongoing North American Phenology Campaign run by the Global Learning and Observations to Benefit the Environment (GLOBE) program, NASA data scientist Skye Caplan has been posting weekly foliage maps of vegetation redness. The maps show waves of red emerging in the high latitudes in August and shifting equatorward in September and October. The PACE team is asking the public to submit photos of fall foliage to help scientists “ground truth” the satellite observations and better understand how various factors influence vegetation color.
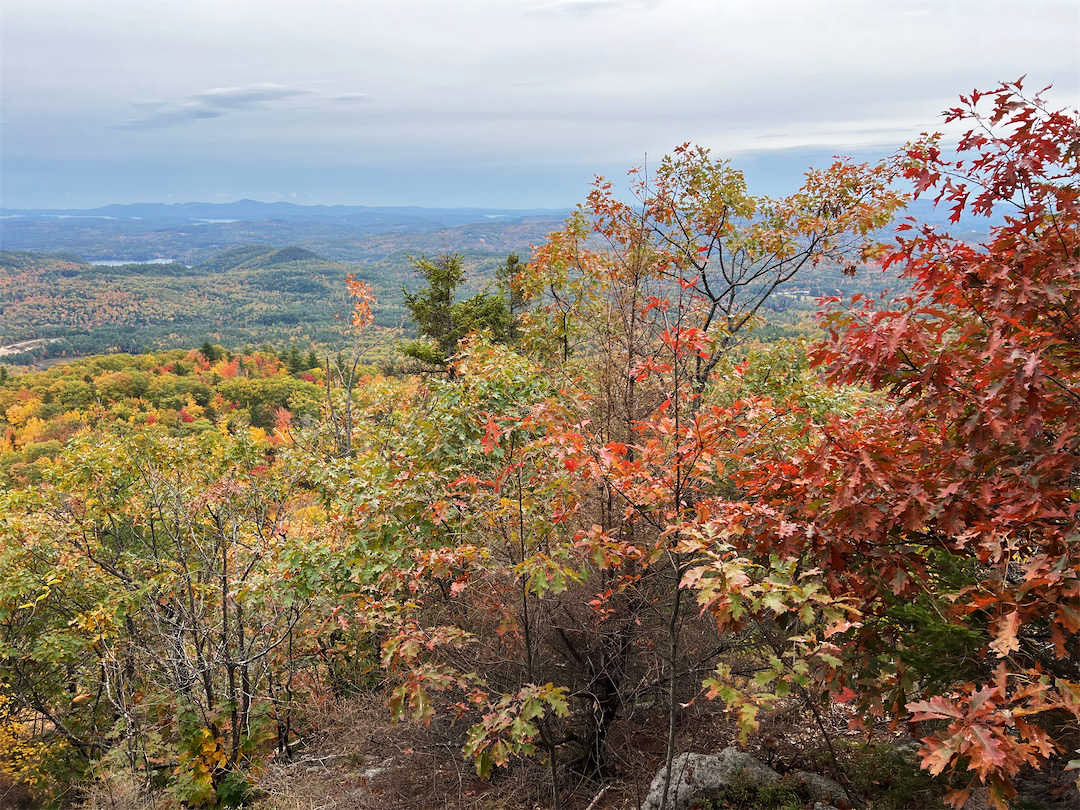
“Changes in pigments can also occur when vegetation is stressed due to drought or insect damage,” said Caplan. She noted that changes like these likely help explain why PACE measures high levels of redness in agricultural regions of Brazil, Australia, and Canada that don’t track closely with broader seasonal changes.
“The more photos we can get from the ground, the better,” Caplan said. Ground photos help scientists refine PACE’s observations of vegetation color, which the team hopes will eventually support several lines of research. These include how the timing of spring greening and fall senescence is changing, how vegetation changes affect the global carbon cycle, and how leaf color influences wildfire risk. Scientists also want to know whether PACE can detect early warning signs of drought, insect infestations, and plant disease.
People can participate in the GLOBE campaign even if they live in an area without dense forests or picturesque fall foliage displays. Scientists also want ground observations of shrubs, grasses, wildflowers, evergreens, crops, and other vegetation. But when it comes to “red leaf hunting,” don’t delay, Caplan said. “Color changes happen kind of slowly, then all at once, and then they’re gone.”
NASA Earth Observatory images by Lauren Dauphin, using PACE data courtesy of Skye Caplan/NASA’s Goddard Space Flight Center and Landsat data from the U.S. Geological Survey. Photo courtesy of the GLOBE Program. Story by Adam Voiland.
Stay up-to-date with the latest content from NASA as we explore the universe and discover more about our home planet.
Reds, yellows, and oranges are already sweeping across tundra landscapes in Nunavut.
Fall color covers the forested slopes of Bieszczady National Park, while patches of polonina, a type of high-mountain meadow, have…
Orange streams are now being spotted in hundreds of watersheds in permafrost areas throughout Alaska’s Brooks Range.
Source: science.nasa.gov